-
"TABLE OF CONTENTS\r\n1 EXECUTIVE SUMMARY 21\r\n1.1 MARKET ATTRACTIVENESS
-
ANALYSIS 23\r\n1.1.1 GLOBAL METAL CASTING MARKET, BY MATERIAL TYPE 24\r\n1.1.2
-
GLOBAL METAL CASTING MARKET, BY PROCESS TYPE 25\r\n1.1.3 GLOBAL METAL CASTING
-
MARKET, BY END USE INDUSTRY 26\r\n1.1.4 GLOBAL METAL CASTING MARKET, BY REGION
-
\r\n2 MARKET INTRODUCTION 28\r\n2.1 DEFINITION 28\r\n2.2
-
SCOPE OF THE STUDY 28\r\n2.3 MARKET STRUCTURE 29\r\n3 RESEARCH METHODOLOGY
-
\r\n3.1 RESEARCH PROCESS 30\r\n3.2 PRIMARY RESEARCH 31\r\n3.3
-
SECONDARY RESEARCH 32\r\n3.4 MARKET SIZE ESTIMATION 32\r\n3.5 TOP-DOWN
-
AND BOTTOM-UP APPROACH 33\r\n3.6 FORECAST MODEL 34\r\n3.7 LIST OF
-
ASSUMPTIONS & LIMITATIONS 35\r\n4 MARKET DYNAMICS 36\r\n4.1 INTRODUCTION
-
\r\n4.2 DRIVERS 37\r\n4.2.1 INCREASING DEMAND FOR ALUMINUM IN THE
-
AUTOMOTIVE INDUSTRY 37\r\n4.2.2 GROWTH OF THE MAJOR END-USE INDUSTRIES 37\r\n4.3
-
RESTRAINTS 39\r\n4.3.1 INCREASING PREFERENCE FOR ALTERNATIVE PROCESSES 39\r\n4.4
-
OPPORTUNITIES 40\r\n4.4.1 GROWING PREFERENCE FOR ELECTRIC VEHICLES 40\r\n4.4.2
-
INCREASING ADOPTION OF ELECTRIC BUSES TO TRANSFORM PUBLIC TRANSPORT 41\r\n4.4.3
-
INCREASING FDI IN THE ELECTRICAL AND ELECTRONICS INDUSTRY IN EMERGING ECONOMIES
-
\r\n4.5 TRENDS 42\r\n4.5.1 3D PRINTING TECHNIQUE IS GAINING TRACTION
-
IN THE TRADITIONAL METAL CASTING PROCESS 42\r\n5 MARKET FACTOR ANALYSIS 43\r\n5.1
-
SUPPLY CHAIN ANALYSIS 43\r\n5.1.1 RAW MATERIAL SUPPLIERS 43\r\n5.1.2
-
METAL CASTING PRODUCERS 43\r\n5.1.3 DISTRIBUTION & SALES CHANNEL 44\r\n5.1.4
-
END USE INDUSTRY 44\r\n5.2 PORTER'S FIVE FORCES ANALYSIS 45\r\n5.2.1
-
THREAT OF NEW ENTRANTS 45\r\n5.2.2 BARGAINING POWER OF SUPPLIERS 46\r\n5.2.3
-
THREAT OF SUBSTITUTES 46\r\n5.2.4 BARGAINING POWER OF BUYERS 46\r\n5.2.5
-
INTENSITY OF RIVALRY 46\r\n5.3 PRICING OVERVIEW, 2019-2021 (USD/TONS) 46\r\n5.4
-
IMPACT OF COVID 19 OUTBREAK ON GLOBAL METAL CASTING MARKET 47\r\n5.4.1 OVERVIEW
-
\r\n5.4.2 QUALITATIVE ANALYSIS ON CHANGES IN SUPPLY CHAIN 47\r\n5.4.3
-
QUALITATIVE ANALYSIS ON CHANGE IN DEMAND FOR METAL CASTING INDUSTRY DUE TO COVID-19
-
\r\n5.4.4 MAJOR GOVERNMENT POLICIES TO COUNTER THE PANDEMIC 48\r\n5.4.5
-
KEY POLICY RESPONSES AS OF DECEMBER 2020 48\r\n5.4.5.1 FISCAL POLICIES 48\r\n6
-
GLOBAL METAL CASTING MARKET, BY MATERIAL TYPE 49\r\n6.1 OVERVIEW 49\r\n6.1.1
-
METAL CASTING: MARKET ESTIMATES & FORECAST BY MATERIAL TYPE, 2022-2030 50\r\n6.1.2
-
METAL CASTING: MARKET ESTIMATES & FORECAST BY MATERIAL TYPE, 2022-2030 51\r\n6.2
-
CAST IRON 52\r\n6.2.1 CAST IRON: MARKET ESTIMATES & FORECAST BY REGION,2022-2030
-
\r\n6.3 ALUMINIUM 53\r\n6.3.1 ALUMINIUM: MARKET ESTIMATES &
-
FORECAST BY REGION,2022-2030 53\r\n6.4 STAINLESS STEEL 54\r\n6.4.1
-
STAINLESS STEEL: MARKET ESTIMATES & FORECAST BY REGION,2022-2030 54\r\n6.5
-
ZINC 55\r\n6.5.1 ZINC: MARKET ESTIMATES & FORECAST BY REGION,2022-2030
-
\r\n6.6 MAGNESIUM 56\r\n6.6.1 MAGNESIUM: MARKET ESTIMATES &
-
FORECAST BY REGION,2022-2030 56\r\n6.7 CARBON STEEL 57\r\n6.7.1 CARBON
-
STEEL: MARKET ESTIMATES & FORECAST BY REGION,2022-2030 57\r\n6.8 HIGH
-
STEEL ALLOY 58\r\n6.8.1 HIGH STEEL ALLOY: MARKET ESTIMATES & FORECAST
-
BY REGION,2022-2030 58\r\n6.9 OTHERS 59\r\n6.9.1 OTHERS: MARKET ESTIMATES
-
& FORECAST BY REGION,2022-2030 59\r\n7 GLOBAL METAL CASTING MARKET, BY
-
PROCESS TYPE 60\r\n7.1 OVERVIEW 60\r\n7.1.1 METAL CASTING: MARKET
-
ESTIMATES & FORECAST BY PROCESS TYPE, 2022-2030 61\r\n7.1.2 METAL CASTING:
-
MARKET ESTIMATES & FORECAST BY PROCESS TYPE, 2022-2030 62\r\n7.2 SAND
-
CASTING 63\r\n7.2.1 SAND CASTING: MARKET ESTIMATES & FORECAST BY REGION,2022-2030
-
\r\n7.3 DIE CASTING 64\r\n7.3.1 DIE CASTING: MARKET ESTIMATES &
-
FORECAST BY REGION,2022-2030 64\r\n7.4 SHELL MOLD CASTING 65\r\n7.4.1
-
SHELL MOLD CASTING: MARKET ESTIMATES & FORECAST BY REGION,2022-2030 65\r\n7.5
-
GRAVITY CASTING 66\r\n7.5.1 GRAVITY CASTING: MARKET ESTIMATES & FORECAST
-
BY REGION,2022-2030 66\r\n7.6 VACUUM CASTING 67\r\n7.6.1 VACUUM CASTING:
-
MARKET ESTIMATES & FORECAST BY REGION,2022-2030 67\r\n7.7 INVESTMENT
-
CASTING 68\r\n7.7.1 INVESTMENT CASTING: MARKET ESTIMATES & FORECAST BY
-
REGION,2022-2030 68\r\n7.8 OTHERS 69\r\n7.8.1 OTHERS: MARKET ESTIMATES
-
& FORECAST BY REGION,2022-2030 69\r\n8 GLOBAL METAL CASTING MARKET, BY
-
END-USE INDUSTRY 70\r\n8.1 OVERVIEW 70\r\n8.1.1 METAL CASTING: MARKET
-
ESTIMATES & FORECAST BY END-USE INDUSTRY, 2022-2030 71\r\n8.1.2 METAL
-
CASTING: MARKET ESTIMATES & FORECAST BY END-USE INDUSTRY, 2022-2030 72\r\n8.2
-
AUTOMOTIVE & TRANSPORTATION 73\r\n8.2.1 AUTOMOTIVE & TRANSPORTATION:
-
MARKET ESTIMATES & FORECAST BY REGION, 2022-2030 73\r\n8.2.2 GEARBOX
-
\r\n8.2.3 WHEELS 76\r\n8.2.4 ENGINE BLOCKS 77\r\n8.2.5 CYLINDER
-
HEAD 78\r\n8.2.6 EXHAUST MANIFOLD 79\r\n8.2.7 SEAT FRAME 80\r\n8.2.8
-
OTHERS 81\r\n8.3 BUILDING & CONSTRUCTION 82\r\n8.3.1 BUILDING
-
& CONSTRUCTION: MARKET ESTIMATES & FORECAST BY REGION,2022-2030 82\r\n8.4
-
MINING 83\r\n8.4.1 MINING: MARKET ESTIMATES & FORECAST BY REGION,2022-2030
-
\r\n8.5 EQUIPMENT & MACHINE 84\r\n8.5.1 EQUIPMENT & MACHINE:
-
MARKET ESTIMATES & FORECAST BY REGION,2022-2030 84\r\n8.5.2 PUMPS &
-
VALVES 86\r\n8.5.3 OTHERS 87\r\n8.6 CONSUMER GOODS 88\r\n8.6.1
-
CONSUMER GOODS: MARKET ESTIMATES & FORECAST BY REGION,2022-2030 88\r\n8.7
-
OTHERS 89\r\n8.7.1 OTHERS: MARKET ESTIMATES & FORECAST BY REGION,2022-2030
-
\r\n9 GLOBAL METAL CASTING MARKET, BY REGION 91\r\n9.1 OVERVIEW
-
\r\n9.2 NORTH AMERICA 94\r\n9.2.1 US 100\r\n9.2.2 CANADA
-
\r\n9.3 EUROPE 110\r\n9.3.1 GERMANY 116\r\n9.3.2 UK 121\r\n9.3.3
-
FRANCE 126\r\n9.3.4 SPAIN 131\r\n9.3.5 ITALY 136\r\n9.3.6 RUSSIA
-
\r\n9.3.7 REST OF EUROPE 146\r\n9.4 ASIA-PACIFIC 152\r\n9.4.1
-
CHINA 158\r\n9.4.2 JAPAN 163\r\n9.4.3 INDIA 168\r\n9.4.4 SOUTH
-
KOREA 173\r\n9.4.5 AUSTRALIA & NEW ZEALAND 178\r\n9.4.6 REST OF
-
ASIA-PACIFIC 183\r\n9.1 LATIN AMERICA 189\r\n9.1.1 BRAZIL 195\r\n9.1.2
-
MEXICO 200\r\n9.1.3 ARGENTINA 205\r\n9.1.4 REST OF LATIN AMERICA 210\r\n9.2
-
MIDDLE EAST & AFRICA 216\r\n9.2.1 GCC COUNTRIES 222\r\n9.2.2 SOUTH
-
AFRICA 227\r\n9.2.3 TURKEY 232\r\n9.2.4 REST OF THE MIDDLE EAST &
-
AFRICA 237\r\n \r\n10 COMPETITIVE LANDSCAPE 243\r\n10.1
-
COMPETITIVE OVERVIEW 243\r\n10.2 GLOBAL MARKET STRATEGY ANALYSIS 243\r\n10.3
-
RECENT DEVELOPMENTS 244\r\n10.4 COMPETITIVE BENCHMARKING 245\r\n11
-
COMPANY PROFILES 246\r\n11.1 ENDURANCE TECHNOLOGIES LIMITED 246\r\n11.1.1
-
COMPANY OVERVIEW 246\r\n11.1.2 FINANCIAL OVERVIEW 247\r\n11.1.3 PRODUCTS
-
OFFERED 248\r\n11.1.4 KEY DEVELOPMENTS 248\r\n11.1.5 SWOT ANALYSIS
-
\r\n11.1.6 KEY STRATEGIES 249\r\n11.2 GF CASTING SOLUTIONS AG 250\r\n11.2.1
-
COMPANY OVERVIEW 250\r\n11.2.2 FINANCIAL OVERVIEW 250\r\n11.2.3 PRODUCTS
-
OFFERED 251\r\n11.2.4 KEY DEVELOPMENTS 252\r\n11.2.5 SWOT ANALYSIS
-
\r\n11.2.6 KEY STRATEGIES 253\r\n11.3 RYOBI LIMITED 254\r\n11.3.1
-
COMPANY OVERVIEW 254\r\n11.3.2 FINANCIAL OVERVIEW 255\r\n11.3.3 PRODUCTS
-
OFFERED 255\r\n11.3.4 KEY DEVELOPMENTS 256\r\n11.3.5 SWOT ANALYSIS
-
\r\n11.3.6 KEY STRATEGIES 256\r\n11.4 DYNACAST 257\r\n11.4.1
-
COMPANY OVERVIEW 257\r\n11.4.2 FINANCIAL OVERVIEW 257\r\n11.4.3 PRODUCTS
-
OFFERED 257\r\n11.4.4 KEY DEVELOPMENTS 259\r\n11.4.5 SWOT ANALYSIS
-
\r\n11.4.6 KEY STRATEGIES 260\r\n11.5 PRECISION CASTPARTS CORP
-
\r\n11.5.1 COMPANY OVERVIEW 261\r\n11.5.2 FINANCIAL OVERVIEW 261\r\n11.5.3
-
PRODUCTS OFFERED 261\r\n11.5.4 KEY DEVELOPMENTS 262\r\n11.5.5 SWOT
-
ANALYSIS 262\r\n11.5.6 KEY STRATEGIES 262\r\n11.6 GIBBS 263\r\n11.6.1
-
COMPANY OVERVIEW 263\r\n11.6.2 FINANCIAL OVERVIEW 263\r\n11.6.3 PRODUCTS
-
OFFERED 263\r\n11.6.4 KEY DEVELOPMENTS 264\r\n11.6.5 SWOT ANALYSIS
-
\r\n11.6.6 KEY STRATEGIES 265\r\n11.7 ALCAST TECHNOLOGIES 266\r\n11.7.1
-
COMPANY OVERVIEW 266\r\n11.7.2 FINANCIAL OVERVIEW 266\r\n11.7.3 PRODUCTS
-
OFFERED 266\r\n11.7.4 KEY DEVELOPMENTS 266\r\n11.7.5 SWOT ANALYSIS
-
\r\n11.7.6 KEY STRATEGIES 267\r\n11.8 AHRESTY WILMINGTON CORPORATION
-
\r\n11.8.1 COMPANY OVERVIEW 268\r\n11.8.2 FINANCIAL OVERVIEW 268\r\n11.8.3
-
PRODUCTS OFFERED 268\r\n11.8.4 KEY DEVELOPMENTS 268\r\n11.8.5 SWOT
-
ANALYSIS 269\r\n11.8.6 KEY STRATEGIES 269\r\n11.9 FORCEBEYOND 270\r\n11.9.1
-
COMPANY OVERVIEW 270\r\n11.9.2 FINANCIAL OVERVIEW 270\r\n11.9.3 PRODUCTS
-
OFFERED 270\r\n11.9.4 KEY DEVELOPMENTS 271\r\n11.9.5 SWOT ANALYSIS
-
\r\n11.9.6 KEY STRATEGIES 272\r\n11.10 RELIANCE FOUNDRY CO. LTD
-
\r\n11.10.1 COMPANY OVERVIEW 273\r\n11.10.2 FINANCIAL OVERVIEW
-
\r\n11.10.3 PRODUCTS OFFERED 273\r\n11.10.4 KEY DEVELOPMENTS 274\r\n11.10.5
-
SWOT ANALYSIS 274\r\n11.10.6 KEY STRATEGIES 274\r\n12 APPENDIX 275\r\n12.1
-
REFERENCES 275\r\n12.2 RELATED REPORTS 276\r\n \r\nLIST
-
OF TABLES\r\nTABLE 1 LIST OF ASSUMPTIONS & LIMITATIONS 35\r\nTABLE
-
PRICING OVERVIEW, BY REGION 46\r\nTABLE 3 METAL CASTING MARKET ESTIMATES
-
& FORECAST, BY MATERIAL TYPE, 2022-2030 (USD MILLION) 50\r\nTABLE 4 METAL
-
CASTING MARKET ESTIMATES & FORECAST, BY MATERIAL TYPE, 2022-2030 (KILO TONS)
-
\r\nTABLE 5 CAST IRON MARKET ESTIMATES & FORECAST, BY REGION, 2022-2030
-
(USD MILLION) 52\r\nTABLE 6 CAST IRON MARKET ESTIMATES & FORECAST, BY
-
REGION, 2022-2030 (KILO TONS) 52\r\nTABLE 7 ALUMINIUM MARKET ESTIMATES &
-
FORECAST, BY REGION, 2022-2030 (USD MILLION) 53\r\nTABLE 8 ALUMINIUM MARKET
-
ESTIMATES & FORECAST, BY REGION, 2022-2030 (KILO TONS) 53\r\nTABLE 9
-
STAINLESS STEEL MARKET ESTIMATES & FORECAST, BY REGION, 2022-2030 (USD MILLION)
-
\r\nTABLE 10 STAINLESS STEEL MARKET ESTIMATES & FORECAST, BY REGION,
-
2030 (KILO TONS) 54\r\nTABLE 11 ZINC MARKET ESTIMATES & FORECAST,
-
BY REGION, 2022-2030 (USD MILLION) 55\r\nTABLE 12 ZINC MARKET ESTIMATES &
-
FORECAST, BY REGION, 2022-2030 (KILO TONS) 55\r\nTABLE 13 MAGNESIUM MARKET
-
ESTIMATES & FORECAST, BY REGION, 2022-2030 (USD MILLION) 56\r\nTABLE
-
MAGNESIUM MARKET ESTIMATES & FORECAST, BY REGION, 2022-2030 (KILO TONS) 56\r\nTABLE
-
CARBON STEEL MARKET ESTIMATES & FORECAST, BY REGION, 2022-2030 (USD MILLION)
-
\r\nTABLE 16 CARBON STEEL MARKET ESTIMATES & FORECAST, BY REGION, 2022-2030
-
(KILO TONS) 57\r\nTABLE 17 HIGH STEEL ALLOY MARKET ESTIMATES & FORECAST,
-
BY REGION, 2022-2030 (USD MILLION) 58\r\nTABLE 18 HIGH STEEL ALLOY MARKET
-
ESTIMATES & FORECAST, BY REGION, 2022-2030 (KILO TONS) 58\r\nTABLE 19
-
OTHERS MARKET ESTIMATES & FORECAST, BY REGION, 2022-2030 (USD MILLION) 59\r\nTABLE
-
OTHERS MARKET ESTIMATES & FORECAST, BY REGION, 2022-2030 (KILO TONS) 59\r\nTABLE
-
METAL CASTING MARKET ESTIMATES & FORECAST, BY PROCESS TYPE, 2022-2030 (USD
-
MILLION) 61\r\nTABLE 22 METAL CASTING MARKET ESTIMATES & FORECAST, BY
-
PROCESS TYPE, 2022-2030 (KILO TONS) 62\r\nTABLE 23 SAND CASTING MARKET ESTIMATES
-
& FORECAST, BY REGION, 2022-2030 (USD MILLION) 63\r\nTABLE 24 SAND CASTING
-
MARKET ESTIMATES & FORECAST, BY REGION, 2022-2030 (KILO TONS) 63\r\nTABLE
-
DIE CASTING MARKET ESTIMATES & FORECAST, BY REGION, 2022-2030 (USD MILLION)
-
\r\nTABLE 26 DIE CASTING MARKET ESTIMATES & FORECAST, BY REGION, 2022-2030
-
(KILO TONS) 64\r\nTABLE 27 SHELL MOLD CASTING MARKET ESTIMATES & FORECAST,
-
BY REGION, 2022-2030 (USD MILLION) 65\r\nTABLE 28 SHELL MOLD CASTING MARKET
-
ESTIMATES & FORECAST, BY REGION, 2022-2030 (KILO TONS) 65\r\nTABLE 29
-
GRAVITY CASTING MARKET ESTIMATES & FORECAST, BY REGION, 2022-2030 (USD MILLION)
-
\r\nTABLE 30 GRAVITY CASTING MARKET ESTIMATES & FORECAST, BY REGION,
-
2030 (KILO TONS) 66\r\nTABLE 31 VACUUM CASTING MARKET ESTIMATES &
-
FORECAST, BY REGION, 2022-2030 (USD MILLION) 67\r\nTABLE 32 VACUUM CASTING
-
MARKET ESTIMATES & FORECAST, BY REGION, 2022-2030 (KILO TONS) 67\r\nTABLE
-
INVESTMENT CASTING MARKET ESTIMATES & FORECAST, BY REGION, 2022-2030 (USD
-
MILLION) 68\r\nTABLE 34 INVESTMENT CASTING MARKET ESTIMATES & FORECAST,
-
BY REGION, 2022-2030 (KILO TONS) 68\r\nTABLE 35 OTHERS MARKET ESTIMATES &
-
FORECAST, BY REGION, 2022-2030 (USD MILLION) 69\r\nTABLE 36 OTHERS MARKET
-
ESTIMATES & FORECAST, BY REGION, 2022-2030 (KILO TONS) 69\r\nTABLE 37
-
METAL CASTING MARKET ESTIMATES & FORECAST, BY END-USE INDUSTRY, 2022-2030 (USD
-
MILLION) 71\r\nTABLE 38 METAL CASTING MARKET ESTIMATES & FORECAST, BY
-
END-USE INDUSTRY, 2022-2030 (KILO TONS) 72\r\nTABLE 39 AUTOMOTIVE & TRANSPORTATION
-
MARKET ESTIMATES & FORECAST, BY REGION, 2022-2030 (USD MILLION) 73\r\nTABLE
-
AUTOMOTIVE & TRANSPORTATION MARKET ESTIMATES & FORECAST, BY REGION, 2022-2030
-
(KILO TONS) 74\r\nTABLE 41 METAL CASTING MARKET ESTIMATES & FORECAST,
-
BY AUTOMOTIVE & TRANSPORTATION, 2022-2030 (USD MILLION) 74\r\nTABLE 42
-
METAL CASTING MARKET ESTIMATES & FORECAST, BY AUTOMOTIVE & TRANSPORTATION,
-
2030 (KILO TONS) 75\r\nTABLE 43 GEARBOX MARKET ESTIMATES & FORECAST,
-
BY REGION, 2022-2030 (USD MILLION) 75\r\nTABLE 44 GEARBOX MARKET ESTIMATES
-
& FORECAST, BY REGION, 2022-2030 (KILO TONS) 76\r\nTABLE 45 WHEELS MARKET
-
ESTIMATES & FORECAST, BY REGION, 2022-2030 (USD MILLION) 76\r\nTABLE
-
WHEELS MARKET ESTIMATES & FORECAST, BY REGION, 2022-2030 (KILO TONS) 77\r\nTABLE
-
ENGINE BLOCKS MARKET ESTIMATES & FORECAST, BY REGION, 2022-2030 (USD MILLION)
-
\r\nTABLE 48 ENGINE BLOCKS MARKET ESTIMATES & FORECAST, BY REGION,
-
2030 (KILO TONS) 78\r\nTABLE 49 CYLINDER HEAD BLOCKS MARKET ESTIMATES
-
& FORECAST, BY REGION, 2022-2030 (USD MILLION) 78\r\nTABLE 50 CYLINDER
-
HEAD MARKET ESTIMATES & FORECAST, BY REGION, 2022-2030 (KILO TONS) 79\r\nTABLE
-
EXHAUST MANIFOLD MARKET ESTIMATES & FORECAST, BY REGION, 2022-2030 (USD MILLION)
-
\r\nTABLE 52 EXHAUST MANIFOLD MARKET ESTIMATES & FORECAST, BY REGION,
-
2030 (KILO TONS) 80\r\nTABLE 53 SEAT FRAME MARKET ESTIMATES & FORECAST,
-
BY REGION, 2022-2030 (USD MILLION) 80\r\nTABLE 54 SEAT FRAME MARKET ESTIMATES
-
& FORECAST, BY REGION, 2022-2030 (KILO TONS) 81\r\nTABLE 55 OTHERS MARKET
-
ESTIMATES & FORECAST, BY REGION, 2022-2030 (USD MILLION) 81\r\nTABLE
-
OTHERS MARKET ESTIMATES & FORECAST, BY REGION, 2022-2030 (KILO TONS) 82\r\nTABLE
-
BUILDING & CONSTRUCTION MARKET ESTIMATES & FORECAST, BY REGION, 2022-2030
-
(USD MILLION) 82\r\nTABLE 58 BUILDING & CONSTRUCTION MARKET ESTIMATES
-
& FORECAST, BY REGION, 2022-2030 (KILO TONS) 83\r\nTABLE 59 MINING MARKET
-
ESTIMATES & FORECAST, BY REGION, 2022-2030 (USD MILLION) 83\r\nTABLE
-
MINING MARKET ESTIMATES & FORECAST, BY REGION, 2022-2030 (KILO TONS) 84\r\nTABLE
-
EQUIPMENT & MACHINE MARKET ESTIMATES & FORECAST, BY REGION, 2022-2030
-
(USD MILLION) 84\r\nTABLE 62 EQUIPMENT & MACHINE MARKET ESTIMATES &
-
FORECAST, BY REGION, 2022-2030 (KILO TONS) 85\r\nTABLE 63 METAL CASTING MARKET
-
ESTIMATES & FORECAST, BY EQUIPMENT & MACHINE, 2022-2030 (USD MILLION) 85\r\nTABLE
-
METAL CASTING MARKET ESTIMATES & FORECAST, BY EQUIPMENT & MACHINE, 2022-2030
-
(KILO TONS) 86\r\nTABLE 65 PUMPS & VALVES MARKET ESTIMATES & FORECAST,
-
BY REGION, 2022-2030 (USD MILLION) 86\r\nTABLE 66 PUMPS & VALVES MARKET
-
ESTIMATES & FORECAST, BY REGION, 2022-2030 (KILO TONS) 87\r\nTABLE 67
-
OTHERS MARKET ESTIMATES & FORECAST, BY REGION, 2022-2030 (USD MILLION) 87\r\nTABLE
-
OTHERS MARKET ESTIMATES & FORECAST, BY REGION, 2022-2030 (KILO TONS) 88\r\nTABLE
-
CONSUMER GOODS MARKET ESTIMATES & FORECAST, BY REGION, 2022-2030 (USD MILLION)
-
\r\nTABLE 70 CONSUMER GOODS MARKET ESTIMATES & FORECAST, BY REGION,
-
2030 (KILO TONS) 89\r\nTABLE 71 OTHERS MARKET ESTIMATES & FORECAST,
-
BY REGION, 2022-2030 (USD MILLION) 89\r\nTABLE 72 OTHERS MARKET ESTIMATES
-
& FORECAST, BY REGION, 2022-2030 (KILO TONS) 90\r\nTABLE 73 GLOBAL METAL
-
CASTING MARKET, BY REGION, 2022-2030 (USD MILLION) 92\r\nTABLE 74 GLOBAL
-
METAL CASTING MARKET, BY REGION, 2022-2030 (KILO TONS) 93\r\nTABLE 75 NORTH
-
AMERICA: METAL CASTING MARKET, BY COUNTRY, 2022-2030 (USD MILLION) 94\r\nTABLE
-
NORTH AMERICA: METAL CASTING MARKET, BY COUNTRY, 2022-2030 (KILO TONS) 94\r\nTABLE
-
NORTH AMERICA: METAL CASTING MARKET, BY MATERIAL TYPE, 2022-2030 (USD MILLION)
-
\r\nTABLE 78 NORTH AMERICA: METAL CASTING MARKET, BY MATERIAL TYPE, 2022-2030
-
(KILO TONS) 95\r\nTABLE 79 NORTH AMERICA: METAL CASTING MARKET, BY PROCESS
-
TYPE, 2022-2030 (USD MILLION) 96\r\nTABLE 80 NORTH AMERICA: METAL CASTING
-
MARKET, BY PROCESS TYPE, 2022-2030 (KILO TONS) 96\r\nTABLE 81 NORTH AMERICA:
-
METAL CASTING MARKET, BY END-USE INDUSTRY, 2022-2030 (USD MILLION) 97\r\nTABLE
-
NORTH AMERICA: METAL CASTING MARKET, BY END-USE INDUSTRY, 2022-2030 (KILO TONS)
-
\r\nTABLE 83 NORTH AMERICA: METAL CASTING MARKET, BY AUTOMOTIVE & TRANSPORTATION,
-
2030 (USD MILLION) 98\r\nTABLE 84 NORTH AMERICA: METAL CASTING MARKET,
-
BY AUTOMOTIVE & TRANSPORTATION, 2022-2030 (KILO TONS) 98\r\nTABLE 85
-
NORTH AMERICA: METAL CASTING MARKET, BY EQUIPMENT & MACHINE, 2022-2030 (USD
-
MILLION) 99\r\nTABLE 86 NORTH AMERICA: METAL CASTING MARKET, BY EQUIPMENT
-
& MACHINE, 2022-2030 (KILO TONS) 99\r\nTABLE 87 US: METAL CASTING MARKET,
-
BY MATERIAL TYPE, 2022-2030 (USD MILLION) 100\r\nTABLE 88 US: METAL CASTING
-
MARKET, BY MATERIAL TYPE, 2022-2030 (KILO TONS) 100\r\nTABLE 89 US: METAL
-
CASTING MARKET, BY PROCESS TYPE, 2022-2030 (USD MILLION) 101\r\nTABLE 90
-
US: METAL CASTING MARKET, BY PROCESS TYPE, 2022-2030 (KILO TONS) 101\r\nTABLE
-
US: METAL CASTING MARKET, BY END-USE INDUSTRY, 2022-2030 (USD MILLION) 102\r\nTABLE
-
US: METAL CASTING MARKET, BY END-USE INDUSTRY, 2022-2030 (KILO TONS) 102\r\nTABLE
-
US: METAL CASTING MARKET, BY AUTOMOTIVE & TRANSPORTATION, 2022-2030 (USD
-
MILLION) 103\r\nTABLE 94 US: METAL CASTING MARKET, BY AUTOMOTIVE & TRANSPORTATION,
-
2030 (KILO TONS) 103\r\nTABLE 95 US: METAL CASTING MARKET, BY EQUIPMENT
-
& MACHINE, 2022-2030 (USD MILLION) 104\r\nTABLE 96 US: METAL CASTING
-
MARKET, BY EQUIPMENT & MACHINE, 2022-2030 (KILO TONS) 104\r\nTABLE 97
-
CANADA: METAL CASTING MARKET, BY MATERIAL TYPE, 2022-2030 (USD MILLION) 105\r\nTABLE
-
CANADA: METAL CASTING MARKET, BY MATERIAL TYPE, 2022-2030 (KILO TONS) 105\r\nTABLE
-
CANADA: METAL CASTING MARKET, BY PROCESS TYPE, 2022-2030 (USD MILLION) 106\r\nTABLE
-
CANADA: METAL CASTING MARKET, BY PROCESS TYPE, 2022-2030 (KILO TONS) 106\r\nTABLE
-
CANADA: METAL CASTING MARKET, BY END-USE INDUSTRY, 2022-2030 (USD MILLION) 107\r\nTABLE
-
CANADA: METAL CASTING MARKET, BY END-USE INDUSTRY, 2022-2030 (KILO TONS) 107\r\nTABLE
-
CANADA: METAL CASTING MARKET, BY AUTOMOTIVE & TRANSPORTATION, 2022-2030
-
(USD MILLION) 108\r\nTABLE 104 CANADA: METAL CASTING MARKET, BY AUTOMOTIVE
-
& TRANSPORTATION, 2022-2030 (KILO TONS) 108\r\nTABLE 105 CANADA: METAL
-
CASTING MARKET, BY EQUIPMENT & MACHINE, 2022-2030 (USD MILLION) 109\r\nTABLE
-
CANADA: METAL CASTING MARKET, BY EQUIPMENT & MACHINE, 2022-2030 (KILO TONS)
-
\r\nTABLE 107 EUROPE: METAL CASTING MARKET, BY COUNTRY, 2022-2030 (USD
-
MILLION) 110\r\nTABLE 108 EUROPE: METAL CASTING MARKET, BY COUNTRY, 2022-2030
-
(KILO TONS) 111\r\nTABLE 109 EUROPE: METAL CASTING MARKET, BY MATERIAL TYPE,
-
2030 (USD MILLION) 111\r\nTABLE 110 EUROPE: METAL CASTING MARKET, BY
-
MATERIAL TYPE, 2022-2030 (KILO TONS) 112\r\nTABLE 111 EUROPE: METAL CASTING
-
MARKET, BY PROCESS TYPE, 2022-2030 (USD MILLION) 112\r\nTABLE 112 EUROPE:
-
METAL CASTING MARKET, BY PROCESS TYPE, 2022-2030 (KILO TONS) 113\r\nTABLE
-
EUROPE: METAL CASTING MARKET, BY END-USE INDUSTRY, 2022-2030 (USD MILLION) 113\r\nTABLE
-
EUROPE: METAL CASTING MARKET, BY END-USE INDUSTRY, 2022-2030 (KILO TONS) 114\r\nTABLE
-
EUROPE: METAL CASTING MARKET, BY AUTOMOTIVE & TRANSPORTATION, 2022-2030
-
(USD MILLION) 114\r\nTABLE 116 EUROPE: METAL CASTING MARKET, BY AUTOMOTIVE
-
& TRANSPORTATION, 2022-2030 (KILO TONS) 115\r\nTABLE 117 EUROPE: METAL
-
CASTING MARKET, BY EQUIPMENT & MACHINE, 2022-2030 (USD MILLION) 115\r\nTABLE
-
EUROPE: METAL CASTING MARKET, BY EQUIPMENT & MACHINE, 2022-2030 (KILO TONS)
-
\r\nTABLE 119 GERMANY: METAL CASTING MARKET, BY MATERIAL TYPE, 2022-2030
-
(USD MILLION) 116\r\nTABLE 120 GERMANY: METAL CASTING MARKET, BY MATERIAL
-
TYPE, 2022-2030 (KILO TONS) 117\r\nTABLE 121 GERMANY: METAL CASTING MARKET,
-
BY PROCESS TYPE, 2022-2030 (USD MILLION) 117\r\nTABLE 122 GERMANY: METAL
-
CASTING MARKET, BY PROCESS TYPE, 2022-2030 (KILO TONS) 118\r\nTABLE 123 GERMANY:
-
METAL CASTING MARKET, BY END-USE INDUSTRY, 2022-2030 (USD MILLION) 118\r\nTABLE
-
GERMANY: METAL CASTING MARKET, BY END-USE INDUSTRY, 2022-2030 (KILO TONS) 119\r\nTABLE
-
GERMANY: METAL CASTING MARKET, BY AUTOMOTIVE & TRANSPORTATION, 2022-2030
-
(USD MILLION) 119\r\nTABLE 126 GERMANY: METAL CASTING MARKET, BY AUTOMOTIVE
-
& TRANSPORTATION, 2022-2030 (KILO TONS) 120\r\nTABLE 127 GERMANY: METAL
-
CASTING MARKET, BY EQUIPMENT & MACHINE, 2022-2030 (USD MILLION) 120\r\nTABLE
-
GERMANY: METAL CASTING MARKET, BY EQUIPMENT & MACHINE, 2022-2030 (KILO TONS)
-
\r\nTABLE 129 UK: METAL CASTING MARKET, BY MATERIAL TYPE, 2022-2030 (USD
-
MILLION) 121\r\nTABLE 130 UK: METAL CASTING MARKET, BY MATERIAL TYPE, 2022-2030
-
(KILO TONS) 122\r\nTABLE 131 UK: METAL CASTING MARKET, BY PROCESS TYPE, 2022-2030
-
(USD MILLION) 122\r\nTABLE 132 UK: METAL CASTING MARKET, BY PROCESS TYPE,
-
2030 (KILO TONS) 123\r\nTABLE 133 UK: METAL CASTING MARKET, BY END-USE
-
INDUSTRY, 2022-2030 (USD MILLION) 123\r\nTABLE 134 UK: METAL CASTING MARKET,
-
BY END-USE INDUSTRY, 2022-2030 (KILO TONS) 124\r\nTABLE 135 UK: METAL CASTING
-
MARKET, BY AUTOMOTIVE & TRANSPORTATION, 2022-2030 (USD MILLION) 124\r\nTABLE
-
UK: METAL CASTING MARKET, BY AUTOMOTIVE & TRANSPORTATION, 2022-2030 (KILO
-
TONS) 125\r\nTABLE 137 UK: METAL CASTING MARKET, BY EQUIPMENT & MACHINE,
-
2030 (USD MILLION) 125\r\nTABLE 138 UK: METAL CASTING MARKET, BY EQUIPMENT
-
& MACHINE, 2022-2030 (KILO TONS) 126\r\nTABLE 139 FRANCE: METAL CASTING
-
MARKET, BY MATERIAL TYPE, 2022-2030 (USD MILLION) 126\r\nTABLE 140 FRANCE:
-
METAL CASTING MARKET, BY MATERIAL TYPE, 2022-2030 (KILO TONS) 127\r\nTABLE
-
FRANCE: METAL CASTING MARKET, BY PROCESS TYPE, 2022-2030 (USD MILLION) 127\r\nTABLE
-
FRANCE: METAL CASTING MARKET, BY PROCESS TYPE, 2022-2030 (KILO TONS) 128\r\nTABLE
-
FRANCE: METAL CASTING MARKET, BY END-USE INDUSTRY, 2022-2030 (USD MILLION) 128\r\nTABLE
-
FRANCE: METAL CASTING MARKET, BY END-USE INDUSTRY, 2022-2030 (KILO TONS) 129\r\nTABLE
-
FRANCE: METAL CASTING MARKET, BY AUTOMOTIVE & TRANSPORTATION, 2022-2030
-
(USD MILLION) 129\r\nTABLE 146 FRANCE: METAL CASTING MARKET, BY AUTOMOTIVE
-
& TRANSPORTATION, 2022-2030 (KILO TONS) 130\r\nTABLE 147 FRANCE: METAL
-
CASTING MARKET, BY EQUIPMENT & MACHINE, 2022-2030 (USD MILLION) 130\r\nTABLE
-
FRANCE: METAL CASTING MARKET, BY EQUIPMENT & MACHINE, 2022-2030 (KILO TONS)
-
\r\nTABLE 149 SPAIN: METAL CASTING MARKET, BY MATERIAL TYPE, 2022-2030
-
(USD MILLION) 131\r\nTABLE 150 SPAIN: METAL CASTING MARKET, BY MATERIAL TYPE,
-
2030 (KILO TONS) 132\r\nTABLE 151 SPAIN: METAL CASTING MARKET, BY PROCESS
-
TYPE, 2022-2030 (USD MILLION) 132\r\nTABLE 152 SPAIN: METAL CASTING MARKET,
-
BY PROCESS TYPE, 2022-2030 (KILO TONS) 133\r\nTABLE 153 SPAIN: METAL CASTING
-
MARKET, BY END-USE INDUSTRY, 2022-2030 (USD MILLION) 133\r\nTABLE 154 SPAIN:
-
METAL CASTING MARKET, BY END-USE INDUSTRY, 2022-2030 (KILO TONS) 134\r\nTABLE
-
SPAIN: METAL CASTING MARKET, BY AUTOMOTIVE & TRANSPORTATION, 2022-2030 (USD
-
MILLION) 134\r\nTABLE 156 SPAIN: METAL CASTING MARKET, BY AUTOMOTIVE &
-
TRANSPORTATION, 2022-2030 (KILO TONS) 135\r\nTABLE 157 SPAIN: METAL CASTING
-
MARKET, BY EQUIPMENT & MACHINE, 2022-2030 (USD MILLION) 135\r\nTABLE
-
SPAIN: METAL CASTING MARKET, BY EQUIPMENT & MACHINE, 2022-2030 (KILO TONS)
-
\r\nTABLE 159 ITALY: METAL CASTING MARKET, BY MATERIAL TYPE, 2022-2030
-
(USD MILLION) 136\r\nTABLE 160 ITALY: METAL CASTING MARKET, BY MATERIAL TYPE,
-
2030 (KILO TONS) 137\r\nTABLE 161 ITALY: METAL CASTING MARKET, BY PROCESS
-
TYPE, 2022-2030 (USD MILLION) 137\r\nTABLE 162 ITALY: METAL CASTING MARKET,
-
BY PROCESS TYPE, 2022-2030 (KILO TONS) 138\r\nTABLE 163 ITALY: METAL CASTING
-
MARKET, BY END-USE INDUSTRY, 2022-2030 (USD MILLION) 138\r\nTABLE 164 ITALY:
-
METAL CASTING MARKET, BY END-USE INDUSTRY, 2022-2030 (KILO TONS) 139\r\nTABLE
-
ITALY: METAL CASTING MARKET, BY AUTOMOTIVE & TRANSPORTATION, 2022-2030 (USD
-
MILLION) 139\r\nTABLE 166 ITALY: METAL CASTING MARKET, BY AUTOMOTIVE &
-
TRANSPORTATION, 2022-2030 (KILO TONS) 140\r\nTABLE 167 ITALY: METAL CASTING
-
MARKET, BY EQUIPMENT & MACHINE, 2022-2030 (USD MILLION) 140\r\nTABLE
-
ITALY: METAL CASTING MARKET, BY EQUIPMENT & MACHINE, 2022-2030 (KILO TONS)
-
\r\nTABLE 169 RUSSIA: METAL CASTING MARKET, BY MATERIAL TYPE, 2022-2030
-
(USD MILLION) 141\r\nTABLE 170 RUSSIA: METAL CASTING MARKET, BY MATERIAL
-
TYPE, 2022-2030 (KILO TONS) 142\r\nTABLE 171 RUSSIA: METAL CASTING MARKET,
-
BY PROCESS TYPE, 2022-2030 (USD MILLION) 142\r\nTABLE 172 RUSSIA: METAL CASTING
-
MARKET, BY PROCESS TYPE, 2022-2030 (KILO TONS) 143\r\nTABLE 173 RUSSIA: METAL
-
CASTING MARKET, BY END-USE INDUSTRY, 2022-2030 (USD MILLION) 143\r\nTABLE
-
RUSSIA: METAL CASTING MARKET, BY END-USE INDUSTRY, 2022-2030 (KILO TONS) 144\r\nTABLE
-
RUSSIA: METAL CASTING MARKET, BY AUTOMOTIVE & TRANSPORTATION, 2022-2030
-
(USD MILLION) 144\r\nTABLE 176 RUSSIA: METAL CASTING MARKET, BY AUTOMOTIVE
-
& TRANSPORTATION, 2022-2030 (KILO TONS) 145\r\nTABLE 177 RUSSIA: METAL
-
CASTING MARKET, BY EQUIPMENT & MACHINE, 2022-2030 (USD MILLION) 145\r\nTABLE
-
RUSSIA: METAL CASTING MARKET, BY EQUIPMENT & MACHINE, 2022-2030 (KILO TONS)
-
\r\nTABLE 179 REST OF EUROPE: METAL CASTING MARKET, BY MATERIAL TYPE,
-
2030 (USD MILLION) 146\r\nTABLE 180 REST OF EUROPE: METAL CASTING MARKET,
-
BY MATERIAL TYPE, 2022-2030 (KILO TONS) 147\r\nTABLE 181 REST OF EUROPE:
-
METAL CASTING MARKET, BY PROCESS TYPE, 2022-2030 (USD MILLION) 147\r\nTABLE
-
REST OF EUROPE: METAL CASTING MARKET, BY PROCESS TYPE, 2022-2030 (KILO TONS)
-
\r\nTABLE 183 REST OF EUROPE: METAL CASTING MARKET, BY END-USE INDUSTRY,
-
2030 (USD MILLION) 148\r\nTABLE 184 REST OF EUROPE: METAL CASTING MARKET,
-
BY END-USE INDUSTRY, 2022-2030 (KILO TONS) 149\r\nTABLE 185 REST OF EUROPE:
-
METAL CASTING MARKET, BY AUTOMOTIVE & TRANSPORTATION, 2022-2030 (USD MILLION)
-
\r\nTABLE 186 REST OF EUROPE: METAL CASTING MARKET, BY AUTOMOTIVE &
-
TRANSPORTATION, 2022-2030 (KILO TONS) 150\r\nTABLE 187 REST OF EUROPE: METAL
-
CASTING MARKET, BY EQUIPMENT & MACHINE, 2022-2030 (USD MILLION) 150\r\nTABLE
-
REST OF EUROPE: METAL CASTING MARKET, BY EQUIPMENT & MACHINE, 2022-2030
-
(KILO TONS) 151\r\nTABLE 189 ASIA-PACIFIC: METAL CASTING MARKET, BY COUNTRY,
-
2030 (USD MILLION) 152\r\nTABLE 190 ASIA-PACIFIC: METAL CASTING MARKET,
-
BY COUNTRY, 2022-2030 (KILO TONS) 153\r\nTABLE 191 ASIA-PACIFIC: METAL CASTING
-
MARKET, BY MATERIAL TYPE, 2022-2030 (USD MILLION) 153\r\nTABLE 192 ASIA-PACIFIC:
-
METAL CASTING MARKET, BY MATERIAL TYPE, 2022-2030 (KILO TONS) 154\r\nTABLE
-
ASIA-PACIFIC: METAL CASTING MARKET, BY PROCESS TYPE, 2022-2030 (USD MILLION)
-
\r\nTABLE 194 ASIA-PACIFIC: METAL CASTING MARKET, BY PROCESS TYPE, 2022-2030
-
(KILO TONS) 155\r\nTABLE 195 ASIA-PACIFIC: METAL CASTING MARKET, BY END-USE
-
INDUSTRY, 2022-2030 (USD MILLION) 155\r\nTABLE 196 ASIA-PACIFIC: METAL CASTING
-
MARKET, BY END-USE INDUSTRY, 2022-2030 (KILO TONS) 156\r\nTABLE 197 ASIA-PACIFIC:
-
METAL CASTING MARKET, BY AUTOMOTIVE & TRANSPORTATION, 2022-2030 (USD MILLION)
-
\r\nTABLE 198 ASIA-PACIFIC: METAL CASTING MARKET, BY AUTOMOTIVE &
-
TRANSPORTATION, 2022-2030 (KILO TONS) 157\r\nTABLE 199 ASIA-PACIFIC: METAL
-
CASTING MARKET, BY EQUIPMENT & MACHINE, 2022-2030 (USD MILLION) 157\r\nTABLE
-
ASIA-PACIFIC: METAL CASTING MARKET, BY EQUIPMENT & MACHINE, 2022-2030 (KILO
-
TONS) 158\r\nTABLE 201 CHINA: METAL CASTING MARKET, BY MATERIAL TYPE, 2022-2030
-
(USD MILLION) 158\r\nTABLE 202 CHINA: METAL CASTING MARKET, BY MATERIAL TYPE,
-
2030 (KILO TONS) 159\r\nTABLE 203 CHINA: METAL CASTING MARKET, BY PROCESS
-
TYPE, 2022-2030 (USD MILLION) 159\r\nTABLE 204 CHINA: METAL CASTING MARKET,
-
BY PROCESS TYPE, 2022-2030 (KILO TONS) 160\r\nTABLE 205 CHINA: METAL CASTING
-
MARKET, BY END-USE INDUSTRY, 2022-2030 (USD MILLION) 160\r\nTABLE 206 CHINA:
-
METAL CASTING MARKET, BY END-USE INDUSTRY, 2022-2030 (KILO TONS) 161\r\nTABLE
-
CHINA: METAL CASTING MARKET, BY AUTOMOTIVE & TRANSPORTATION, 2022-2030 (USD
-
MILLION) 161\r\nTABLE 208 CHINA: METAL CASTING MARKET, BY AUTOMOTIVE &
-
TRANSPORTATION, 2022-2030 (KILO TONS) 162\r\nTABLE 209 CHINA: METAL CASTING
-
MARKET, BY EQUIPMENT & MACHINE, 2022-2030 (USD MILLION) 162\r\nTABLE
-
CHINA: METAL CASTING MARKET, BY EQUIPMENT & MACHINE, 2022-2030 (KILO TONS)
-
\r\nTABLE 211 JAPAN: METAL CASTING MARKET, BY MATERIAL TYPE, 2022-2030
-
(USD MILLION) 163\r\nTABLE 212 JAPAN: METAL CASTING MARKET, BY MATERIAL TYPE,
-
2030 (KILO TONS) 164\r\nTABLE 213 JAPAN: METAL CASTING MARKET, BY PROCESS
-
TYPE, 2022-2030 (USD MILLION) 164\r\nTABLE 214 JAPAN: METAL CASTING MARKET,
-
BY PROCESS TYPE, 2022-2030 (KILO TONS) 165\r\nTABLE 215 JAPAN: METAL CASTING
-
MARKET, BY END-USE INDUSTRY, 2022-2030 (USD MILLION) 165\r\nTABLE 216 JAPAN:
-
METAL CASTING MARKET, BY END-USE INDUSTRY, 2022-2030 (KILO TONS) 166\r\nTABLE
-
JAPAN: METAL CASTING MARKET, BY AUTOMOTIVE & TRANSPORTATION, 2022-2030 (USD
-
MILLION) 166\r\nTABLE 218 JAPAN: METAL CASTING MARKET, BY AUTOMOTIVE &
-
TRANSPORTATION, 2022-2030 (KILO TONS) 167\r\nTABLE 219 JAPAN: METAL CASTING
-
MARKET, BY EQUIPMENT & MACHINE, 2022-2030 (USD MILLION) 167\r\nTABLE
-
JAPAN: METAL CASTING MARKET, BY EQUIPMENT & MACHINE, 2022-2030 (KILO TONS)
-
\r\nTABLE 221 INDIA: METAL CASTING MARKET, BY MATERIAL TYPE, 2022-2030
-
(USD MILLION) 168\r\nTABLE 222 INDIA: METAL CASTING MARKET, BY MATERIAL TYPE,
-
2030 (KILO TONS) 169\r\nTABLE 223 INDIA: METAL CASTING MARKET, BY PROCESS
-
TYPE, 2022-2030 (USD MILLION) 169\r\nTABLE 224 INDIA: METAL CASTING MARKET,
-
BY PROCESS TYPE, 2022-2030 (KILO TONS) 170\r\nTABLE 225 INDIA: METAL CASTING
-
MARKET, BY END-USE INDUSTRY, 2022-2030 (USD MILLION) 170\r\nTABLE 226 INDIA:
-
METAL CASTING MARKET, BY END-USE INDUSTRY, 2022-2030 (KILO TONS) 171\r\nTABLE
-
INDIA: METAL CASTING MARKET, BY AUTOMOTIVE & TRANSPORTATION, 2022-2030 (USD
-
MILLION) 171\r\nTABLE 228 INDIA: METAL CASTING MARKET, BY AUTOMOTIVE &
-
TRANSPORTATION, 2022-2030 (KILO TONS) 172\r\nTABLE 229 INDIA: METAL CASTING
-
MARKET, BY EQUIPMENT & MACHINE, 2022-2030 (USD MILLION) 172\r\nTABLE
-
INDIA: METAL CASTING MARKET, BY EQUIPMENT & MACHINE, 2022-2030 (KILO TONS)
-
\r\nTABLE 231 SOUTH KOREA: METAL CASTING MARKET, BY MATERIAL TYPE, 2022-2030
-
(USD MILLION) 173\r\nTABLE 232 SOUTH KOREA: METAL CASTING MARKET, BY MATERIAL
-
TYPE, 2022-2030 (KILO TONS) 174\r\nTABLE 233 SOUTH KOREA: METAL CASTING MARKET,
-
BY PROCESS TYPE, 2022-2030 (USD MILLION) 174\r\nTABLE 234 SOUTH KOREA: METAL
-
CASTING MARKET, BY PROCESS TYPE, 2022-2030 (KILO TONS) 175\r\nTABLE 235 SOUTH
-
KOREA: METAL CASTING MARKET, BY END-USE INDUSTRY, 2022-2030 (USD MILLION) 175\r\nTABLE
-
SOUTH KOREA: METAL CASTING MARKET, BY END-USE INDUSTRY, 2022-2030 (KILO TONS)
-
\r\nTABLE 237 SOUTH KOREA: METAL CASTING MARKET, BY AUTOMOTIVE & TRANSPORTATION,
-
2030 (USD MILLION) 176\r\nTABLE 238 SOUTH KOREA: METAL CASTING MARKET,
-
BY AUTOMOTIVE & TRANSPORTATION, 2022-2030 (KILO TONS) 177\r\nTABLE 239
-
SOUTH KOREA: METAL CASTING MARKET, BY EQUIPMENT & MACHINE, 2022-2030 (USD MILLION)
-
\r\nTABLE 240 SOUTH KOREA: METAL CASTING MARKET, BY EQUIPMENT & MACHINE,
-
2030 (KILO TONS) 178\r\nTABLE 241 AUSTRALIA & NEW ZEALAND: METAL
-
CASTING MARKET, BY MATERIAL TYPE, 2022-2030 (USD MILLION) 178\r\nTABLE 242
-
AUSTRALIA & NEW ZEALAND: METAL CASTING MARKET, BY MATERIAL TYPE, 2022-2030 (KILO
-
TONS) 179\r\nTABLE 243 AUSTRALIA & NEW ZEALAND: METAL CASTING MARKET,
-
BY PROCESS TYPE, 2022-2030 (USD MILLION) 179\r\nTABLE 244 AUSTRALIA &
-
NEW ZEALAND: METAL CASTING MARKET, BY PROCESS TYPE, 2022-2030 (KILO TONS) 180\r\nTABLE
-
AUSTRALIA & NEW ZEALAND: METAL CASTING MARKET, BY END-USE INDUSTRY, 2022-2030
-
(USD MILLION) 180\r\nTABLE 246 AUSTRALIA & NEW ZEALAND: METAL CASTING
-
MARKET, BY END-USE INDUSTRY, 2022-2030 (KILO TONS) 181\r\nTABLE 247 AUSTRALIA
-
& NEW ZEALAND: METAL CASTING MARKET, BY AUTOMOTIVE & TRANSPORTATION, 2022-2030
-
(USD MILLION) 181\r\nTABLE 248 AUSTRALIA & NEW ZEALAND: METAL CASTING
-
MARKET, BY AUTOMOTIVE & TRANSPORTATION, 2022-2030 (KILO TONS) 182\r\nTABLE
-
AUSTRALIA & NEW ZEALAND: METAL CASTING MARKET, BY EQUIPMENT & MACHINE,
-
2030 (USD MILLION) 182\r\nTABLE 250 AUSTRALIA & NEW ZEALAND: METAL
-
CASTING MARKET, BY EQUIPMENT & MACHINE, 2022-2030 (KILO TONS) 183\r\nTABLE
-
REST OF ASIA-PACIFIC: METAL CASTING MARKET, BY MATERIAL TYPE, 2022-2030 (USD
-
MILLION) 183\r\nTABLE 252 REST OF ASIA-PACIFIC: METAL CASTING MARKET, BY
-
MATERIAL TYPE, 2022-2030 (KILO TONS) 184\r\nTABLE 253 REST OF ASIA-PACIFIC:
-
METAL CASTING MARKET, BY PROCESS TYPE, 2022-2030 (USD MILLION) 184\r\nTABLE
-
REST OF ASIA-PACIFIC: METAL CASTING MARKET, BY PROCESS TYPE, 2022-2030 (KILO
-
TONS) 185\r\nTABLE 255 REST OF ASIA-PACIFIC: METAL CASTING MARKET, BY END-USE
-
INDUSTRY, 2022-2030 (USD MILLION) 185\r\nTABLE 256 REST OF ASIA-PACIFIC:
-
METAL CASTING MARKET, BY END-USE INDUSTRY, 2022-2030 (KILO TONS) 186\r\nTABLE
-
REST OF ASIA-PACIFIC: METAL CASTING MARKET, BY AUTOMOTIVE & TRANSPORTATION,
-
2030 (USD MILLION) 186\r\nTABLE 258 REST OF ASIA-PACIFIC: METAL CASTING
-
MARKET, BY AUTOMOTIVE & TRANSPORTATION, 2022-2030 (KILO TONS) 187\r\nTABLE
-
REST OF ASIA-PACIFIC: METAL CASTING MARKET, BY EQUIPMENT & MACHINE, 2022-2030
-
(USD MILLION) 187\r\nTABLE 260 REST OF ASIA-PACIFIC: METAL CASTING MARKET,
-
BY EQUIPMENT & MACHINE, 2022-2030 (KILO TONS) 188\r\nTABLE 261 LATIN
-
AMERICA: METAL CASTING MARKET, BY COUNTRY, 2022-2030 (USD MILLION) 189\r\nTABLE
-
LATIN AMERICA: METAL CASTING MARKET, BY COUNTRY, 2022-2030 (KILO TONS) 190\r\nTABLE
-
LATIN AMERICA: METAL CASTING MARKET, BY MATERIAL TYPE, 2022-2030 (USD MILLION)
-
\r\nTABLE 264 LATIN AMERICA: METAL CASTING MARKET, BY MATERIAL TYPE, 2022-2030
-
(KILO TONS) 191\r\nTABLE 265 LATIN AMERICA: METAL CASTING MARKET, BY PROCESS
-
TYPE, 2022-2030 (USD MILLION) 191\r\nTABLE 266 LATIN AMERICA: METAL CASTING
-
MARKET, BY PROCESS TYPE, 2022-2030 (KILO TONS) 192\r\nTABLE 267 LATIN AMERICA:
-
METAL CASTING MARKET, BY END-USE INDUSTRY, 2022-2030 (USD MILLION) 192\r\nTABLE
-
LATIN AMERICA: METAL CASTING MARKET, BY END-USE INDUSTRY, 2022-2030 (KILO TONS)
-
\r\nTABLE 269 LATIN AMERICA: METAL CASTING MARKET, BY AUTOMOTIVE &
-
TRANSPORTATION, 2022-2030 (USD MILLION) 193\r\nTABLE 270 LATIN AMERICA: METAL
-
CASTING MARKET, BY AUTOMOTIVE & TRANSPORTATION, 2022-2030 (KILO TONS) 194\r\nTABLE
-
LATIN AMERICA: METAL CASTING MARKET, BY EQUIPMENT & MACHINE, 2022-2030 (USD
-
MILLION) 194\r\nTABLE 272 LATIN AMERICA: METAL CASTING MARKET, BY EQUIPMENT
-
& MACHINE, 2022-2030 (KILO TONS) 195\r\nTABLE 273 BRAZIL: METAL CASTING
-
MARKET, BY MATERIAL TYPE, 2022-2030 (USD MILLION) 195\r\nTABLE 274 BRAZIL:
-
METAL CASTING MARKET, BY MATERIAL TYPE, 2022-2030 (KILO TONS) 196\r\nTABLE
-
BRAZIL: METAL CASTING MARKET, BY PROCESS TYPE, 2022-2030 (USD MILLION) 196\r\nTABLE
-
BRAZIL: METAL CASTING MARKET, BY PROCESS TYPE, 2022-2030 (KILO TONS) 197\r\nTABLE
-
BRAZIL: METAL CASTING MARKET, BY END-USE INDUSTRY, 2022-2030 (USD MILLION) 197\r\nTABLE
-
BRAZIL: METAL CASTING MARKET, BY END-USE INDUSTRY, 2022-2030 (KILO TONS) 198\r\nTABLE
-
BRAZIL: METAL CASTING MARKET, BY AUTOMOTIVE & TRANSPORTATION, 2022-2030
-
(USD MILLION) 198\r\nTABLE 280 BRAZIL: METAL CASTING MARKET, BY AUTOMOTIVE
-
& TRANSPORTATION, 2022-2030 (KILO TONS) 199\r\nTABLE 281 BRAZIL: METAL
-
CASTING MARKET, BY EQUIPMENT & MACHINE, 2022-2030 (USD MILLION) 199\r\nTABLE
-
BRAZIL: METAL CASTING MARKET, BY EQUIPMENT & MACHINE, 2022-2030 (KILO TONS)
-
\r\nTABLE 283 MEXICO: METAL CASTING MARKET, BY MATERIAL TYPE, 2022-2030
-
(USD MILLION) 200\r\nTABLE 284 MEXICO: METAL CASTING MARKET, BY MATERIAL
-
TYPE, 2022-2030 (KILO TONS) 201\r\nTABLE 285 MEXICO: METAL CASTING MARKET,
-
BY PROCESS TYPE, 2022-2030 (USD MILLION) 201\r\nTABLE 286 MEXICO: METAL CASTING
-
MARKET, BY PROCESS TYPE, 2022-2030 (KILO TONS) 202\r\nTABLE 287 MEXICO: METAL
-
CASTING MARKET, BY END-USE INDUSTRY, 2022-2030 (USD MILLION) 202\r\nTABLE
-
MEXICO: METAL CASTING MARKET, BY END-USE INDUSTRY, 2022-2030 (KILO TONS) 203\r\nTABLE
-
MEXICO: METAL CASTING MARKET, BY AUTOMOTIVE & TRANSPORTATION, 2022-2030
-
(USD MILLION) 203\r\nTABLE 290 MEXICO: METAL CASTING MARKET, BY AUTOMOTIVE
-
& TRANSPORTATION, 2022-2030 (KILO TONS) 204\r\nTABLE 291 MEXICO: METAL
-
CASTING MARKET, BY EQUIPMENT & MACHINE, 2022-2030 (USD MILLION) 204\r\nTABLE
-
MEXICO: METAL CASTING MARKET, BY EQUIPMENT & MACHINE, 2022-2030 (KILO TONS)
-
\r\nTABLE 293 ARGENTINA: METAL CASTING MARKET, BY MATERIAL TYPE, 2022-2030
-
(USD MILLION) 205\r\nTABLE 294 ARGENTINA: METAL CASTING MARKET, BY MATERIAL
-
TYPE, 2022-2030 (KILO TONS) 206\r\nTABLE 295 ARGENTINA: METAL CASTING MARKET,
-
BY PROCESS TYPE, 2022-2030 (USD MILLION) 206\r\nTABLE 296 ARGENTINA: METAL
-
CASTING MARKET, BY PROCESS TYPE, 2022-2030 (KILO TONS) 207\r\nTABLE 297 ARGENTINA:
-
METAL CASTING MARKET, BY END-USE INDUSTRY, 2022-2030 (USD MILLION) 207\r\nTABLE
-
ARGENTINA: METAL CASTING MARKET, BY END-USE INDUSTRY, 2022-2030 (KILO TONS)
-
\r\nTABLE 299 ARGENTINA: METAL CASTING MARKET, BY AUTOMOTIVE & TRANSPORTATION,
-
2030 (USD MILLION) 208\r\nTABLE 300 ARGENTINA: METAL CASTING MARKET,
-
BY AUTOMOTIVE & TRANSPORTATION, 2022-2030 (KILO TONS) 209\r\nTABLE 301
-
ARGENTINA: METAL CASTING MARKET, BY EQUIPMENT & MACHINE, 2022-2030 (USD MILLION)
-
\r\nTABLE 302 ARGENTINA: METAL CASTING MARKET, BY EQUIPMENT & MACHINE,
-
2030 (KILO TONS) 210\r\nTABLE 303 REST OF LATIN AMERICA: METAL CASTING
-
MARKET, BY MATERIAL TYPE, 2022-2030 (USD MILLION) 210\r\nTABLE 304 REST OF
-
LATIN AMERICA: METAL CASTING MARKET, BY MATERIAL TYPE, 2022-2030 (KILO TONS) 211\r\nTABLE
-
REST OF LATIN AMERICA: METAL CASTING MARKET, BY PROCESS TYPE, 2022-2030 (USD
-
MILLION) 211\r\nTABLE 306 REST OF LATIN AMERICA: METAL CASTING MARKET, BY
-
PROCESS TYPE, 2022-2030 (KILO TONS) 212\r\nTABLE 307 REST OF LATIN AMERICA:
-
METAL CASTING MARKET, BY END-USE INDUSTRY, 2022-2030 (USD MILLION) 212\r\nTABLE
-
REST OF LATIN AMERICA: METAL CASTING MARKET, BY END-USE INDUSTRY, 2022-2030
-
(KILO TONS) 213\r\nTABLE 309 REST OF LATIN AMERICA: METAL CASTING MARKET,
-
BY AUTOMOTIVE & TRANSPORTATION, 2022-2030 (USD MILLION) 213\r\nTABLE
-
REST OF LATIN AMERICA: METAL CASTING MARKET, BY AUTOMOTIVE & TRANSPORTATION,
-
2030 (KILO TONS) 214\r\nTABLE 311 REST OF LATIN AMERICA: METAL CASTING
-
MARKET, BY EQUIPMENT & MACHINE, 2022-2030 (USD MILLION) 214\r\nTABLE
-
REST OF LATIN AMERICA: METAL CASTING MARKET, BY EQUIPMENT & MACHINE, 2022-2030
-
(KILO TONS) 215\r\nTABLE 313 MIDDLE EAST & AFRICA: METAL CASTING MARKET,
-
BY COUNTRY, 2022-2030 (USD MILLION) 216\r\nTABLE 314 MIDDLE EAST & AFRICA:
-
METAL CASTING MARKET, BY COUNTRY, 2022-2030 (KILO TONS) 217\r\nTABLE 315
-
MIDDLE EAST & AFRICA: METAL CASTING MARKET, BY MATERIAL TYPE, 2022-2030 (USD
-
MILLION) 217\r\nTABLE 316 MIDDLE EAST & AFRICA: METAL CASTING MARKET,
-
BY MATERIAL TYPE, 2022-2030 (KILO TONS) 218\r\nTABLE 317 MIDDLE EAST &
-
AFRICA: METAL CASTING MARKET, BY PROCESS TYPE, 2022-2030 (USD MILLION) 218\r\nTABLE
-
MIDDLE EAST & AFRICA: METAL CASTING MARKET, BY PROCESS TYPE, 2022-2030 (KILO
-
TONS) 219\r\nTABLE 319 MIDDLE EAST & AFRICA: METAL CASTING MARKET, BY
-
END-USE INDUSTRY, 2022-2030 (USD MILLION) 219\r\nTABLE 320 MIDDLE EAST &
-
AFRICA: METAL CASTING MARKET, BY END-USE INDUSTRY, 2022-2030 (KILO TONS) 220\r\nTABLE
-
MIDDLE EAST & AFRICA: METAL CASTING MARKET, BY AUTOMOTIVE & TRANSPORTATION,
-
2030 (USD MILLION) 220\r\nTABLE 322 MIDDLE EAST & AFRICA: METAL
-
CASTING MARKET, BY AUTOMOTIVE & TRANSPORTATION, 2022-2030 (KILO TONS) 221\r\nTABLE
-
MIDDLE EAST & AFRICA: METAL CASTING MARKET, BY EQUIPMENT & MACHINE,
-
2030 (USD MILLION) 221\r\nTABLE 324 MIDDLE EAST & AFRICA: METAL
-
CASTING MARKET, BY EQUIPMENT & MACHINE, 2022-2030 (KILO TONS) 222\r\nTABLE
-
GCC COUNTRIES: METAL CASTING MARKET, BY MATERIAL TYPE, 2022-2030 (USD MILLION)
-
\r\nTABLE 326 GCC COUNTRIES: METAL CASTING MARKET, BY MATERIAL TYPE, 2022-2030
-
(KILO TONS) 223\r\nTABLE 327 GCC COUNTRIES: METAL CASTING MARKET, BY PROCESS
-
TYPE, 2022-2030 (USD MILLION) 223\r\nTABLE 328 GCC COUNTRIES: METAL CASTING
-
MARKET, BY PROCESS TYPE, 2022-2030 (KILO TONS) 224\r\nTABLE 329 GCC COUNTRIES:
-
METAL CASTING MARKET, BY END-USE INDUSTRY, 2022-2030 (USD MILLION) 224\r\nTABLE
-
GCC COUNTRIES: METAL CASTING MARKET, BY END-USE INDUSTRY, 2022-2030 (KILO TONS)
-
\r\nTABLE 331 GCC COUNTRIES: METAL CASTING MARKET, BY AUTOMOTIVE &
-
TRANSPORTATION, 2022-2030 (USD MILLION) 225\r\nTABLE 332 GCC COUNTRIES: METAL
-
CASTING MARKET, BY AUTOMOTIVE & TRANSPORTATION, 2022-2030 (KILO TONS) 226\r\nTABLE
-
GCC COUNTRIES: METAL CASTING MARKET, BY EQUIPMENT & MACHINE, 2022-2030 (USD
-
MILLION) 226\r\nTABLE 334 GCC COUNTRIES: METAL CASTING MARKET, BY EQUIPMENT
-
& MACHINE, 2022-2030 (KILO TONS) 227\r\nTABLE 335 SOUTH AFRICA: METAL
-
CASTING MARKET, BY MATERIAL TYPE, 2022-2030 (USD MILLION) 227\r\nTABLE 336
-
SOUTH AFRICA: METAL CASTING MARKET, BY MATERIAL TYPE, 2022-2030 (KILO TONS) 228\r\nTABLE
-
SOUTH AFRICA: METAL CASTING MARKET, BY PROCESS TYPE, 2022-2030 (USD MILLION)
-
\r\nTABLE 338 SOUTH AFRICA: METAL CASTING MARKET, BY PROCESS TYPE, 2022-2030
-
(KILO TONS) 229\r\nTABLE 339 SOUTH AFRICA: METAL CASTING MARKET, BY END-USE
-
INDUSTRY, 2022-2030 (USD MILLION) 229\r\nTABLE 340 SOUTH AFRICA: METAL CASTING
-
MARKET, BY END-USE INDUSTRY, 2022-2030 (KILO TONS) 230\r\nTABLE 341 SOUTH
-
AFRICA: METAL CASTING MARKET, BY AUTOMOTIVE & TRANSPORTATION, 2022-2030 (USD
-
MILLION) 230\r\nTABLE 342 SOUTH AFRICA: METAL CASTING MARKET, BY AUTOMOTIVE
-
& TRANSPORTATION, 2022-2030 (KILO TONS) 231\r\nTABLE 343 SOUTH AFRICA:
-
METAL CASTING MARKET, BY EQUIPMENT & MACHINE, 2022-2030 (USD MILLION) 231\r\nTABLE
-
SOUTH AFRICA: METAL CASTING MARKET, BY EQUIPMENT & MACHINE, 2022-2030 (KILO
-
TONS) 232\r\nTABLE 345 TURKEY: METAL CASTING MARKET, BY MATERIAL TYPE, 2022-2030
-
(USD MILLION) 232\r\nTABLE 346 TURKEY: METAL CASTING MARKET, BY MATERIAL
-
TYPE, 2022-2030 (KILO TONS) 233\r\nTABLE 347 TURKEY: METAL CASTING MARKET,
-
BY PROCESS TYPE, 2022-2030 (USD MILLION) 233\r\nTABLE 348 TURKEY: METAL CASTING
-
MARKET, BY PROCESS TYPE, 2022-2030 (KILO TONS) 234\r\nTABLE 349 TURKEY: METAL
-
CASTING MARKET, BY END-USE INDUSTRY, 2022-2030 (USD MILLION) 234\r\nTABLE
-
TURKEY: METAL CASTING MARKET, BY END-USE INDUSTRY, 2022-2030 (KILO TONS) 235\r\nTABLE
-
TURKEY: METAL CASTING MARKET, BY AUTOMOTIVE & TRANSPORTATION, 2022-2030
-
(USD MILLION) 235\r\nTABLE 352 TURKEY: METAL CASTING MARKET, BY AUTOMOTIVE
-
& TRANSPORTATION, 2022-2030 (KILO TONS) 236\r\nTABLE 353 TURKEY: METAL
-
CASTING MARKET, BY EQUIPMENT & MACHINE, 2022-2030 (USD MILLION) 236\r\nTABLE
-
TURKEY: METAL CASTING MARKET, BY EQUIPMENT & MACHINE, 2022-2030 (KILO TONS)
-
\r\nTABLE 355 REST OF THE MIDDLE EAST & AFRICA: METAL CASTING MARKET,
-
BY MATERIAL TYPE, 2022-2030 (USD MILLION) 237\r\nTABLE 356 REST OF THE MIDDLE
-
EAST & AFRICA: METAL CASTING MARKET, BY MATERIAL TYPE, 2022-2030 (KILO TONS)
-
\r\nTABLE 357 REST OF THE MIDDLE EAST & AFRICA: METAL CASTING MARKET,
-
BY PROCESS TYPE, 2022-2030 (USD MILLION) 238\r\nTABLE 358 REST OF THE MIDDLE
-
EAST & AFRICA: METAL CASTING MARKET, BY PROCESS TYPE, 2022-2030 (KILO TONS)
-
\r\nTABLE 359 REST OF THE MIDDLE EAST & AFRICA: METAL CASTING MARKET,
-
BY END-USE INDUSTRY, 2022-2030 (USD MILLION) 239\r\nTABLE 360 REST OF THE
-
MIDDLE EAST & AFRICA: METAL CASTING MARKET, BY END-USE INDUSTRY, 2022-2030 (KILO
-
TONS) 240\r\nTABLE 361 REST OF THE MIDDLE EAST & AFRICA: METAL CASTING
-
MARKET, BY AUTOMOTIVE & TRANSPORTATION,\r\n2022-2030 (USD MILLION) 240\r\nTABLE
-
REST OF THE MIDDLE EAST & AFRICA: METAL CASTING MARKET, BY AUTOMOTIVE &
-
TRANSPORTATION,\r\n2022-2030 (KILO TONS) 241\r\nTABLE 363 REST OF
-
THE MIDDLE EAST & AFRICA: METAL CASTING MARKET, BY EQUIPMENT & MACHINE,
-
2030 (USD MILLION) 241\r\nTABLE 364 REST OF THE MIDDLE EAST & AFRICA:
-
METAL CASTING MARKET, BY EQUIPMENT & MACHINE, 2022-2030 (KILO TONS) 242\r\nTABLE
-
KEY DEVELOPMENTS 244\r\nTABLE 366 ENDURANCE TECHNOLOGIES LIMITED: PRODUCTS
-
OFFERED 248\r\nTABLE 367 ENDURANCE TECHNOLOGIES LIMITED: KEY DEVELOPMENTS
-
\r\nTABLE 368 GF CASTING SOLUTIONS AG: PRODUCTS OFFERED 251\r\nTABLE
-
GF CASTING SOLUTIONS AG: KEY DEVELOPMENTS 252\r\nTABLE 370 RYOBI LIMITED:
-
PRODUCTS OFFERED 255\r\nTABLE 371 RYOBI LIMITED: KEY DEVELOPMENTS 256\r\nTABLE
-
DYNACAST: PRODUCTS OFFERED 257\r\nTABLE 373 DYNACAST: KEY DEVELOPMENTS
-
\r\nTABLE 374 PRECISION CASTPARTS CORP: PRODUCTS OFFERED 261\r\nTABLE
-
GIBBS: PRODUCTS OFFERED 263\r\nTABLE 376 ALCAST TECHNOLOGIES: PRODUCTS
-
OFFERED 266\r\nTABLE 377 AHRESTY WILMINGTON CORPORATION: PRODUCTS OFFERED
-
\r\nTABLE 378 FORCEBEYOND: PRODUCTS OFFERED 270\r\nTABLE 379 RELIANCE
-
FOUNDRY CO. LTD: PRODUCTS OFFERED 273\r\n \r\nLIST OF FIGURES\r\nFIGURE
-
MARKET SYNOPSIS 22\r\nFIGURE 2 MARKET ATTRACTIVENESS ANALYSIS: GLOBAL METAL
-
CASTING MARKET, 2020 23\r\nFIGURE 3 GLOBAL METAL CASTING MARKET ANALYSIS
-
BY MATERIAL TYPE 24\r\nFIGURE 4 GLOBAL METAL CASTING MARKET ANALYSIS BY PROCESS
-
TYPE 25\r\nFIGURE 5 GLOBAL METAL CASTING MARKET ANALYSIS BY END USE INDUSTRY
-
\r\nFIGURE 6 GLOBAL METAL CASTING MARKET ANALYSIS BY REGION 27\r\nFIGURE
-
GLOBAL METAL CASTING MARKET: MARKET STRUCTURE 29\r\nFIGURE 8 RESEARCH PROCESS
-
OF MRFR 30\r\nFIGURE 9 MARKET DYNAMICS OVERVIEW 36\r\nFIGURE 10 DRIVERS
-
IMPACT ANALYSIS 38\r\nFIGURE 11 RESTRAINTS IMPACT ANALYSIS 39\r\nFIGURE
-
GLOBAL ELECTRIC PASSENGER CAR STOCK, 2015–2020 41\r\nFIGURE 13 SUPPLY
-
CHAIN ANALYSIS FOR GLOBAL METAL CASTING MARKET 43\r\nFIGURE 14 PORTER'S FIVE
-
FORCES ANALYSIS OF THE GLOBAL METAL CASTING MARKET 45\r\nFIGURE 15 GLOBAL
-
METAL CASTING MARKET, BY MATERIAL TYPE, 2019 TO 2030 (USD MILLION) 49\r\nFIGURE
-
GLOBAL METAL CASTING MARKET, BY MATERIAL TYPE, 2019 TO 2030 (KILO TONS) 50\r\nFIGURE
-
GLOBAL METAL CASTING MARKET, BY PROCESS TYPE, 2019 TO 2030 (USD MILLION) 60\r\nFIGURE
-
GLOBAL METAL CASTING MARKET, BY PROCESS TYPE, 2019 TO 2030 (KILO TONS) 61\r\nFIGURE
-
GLOBAL METAL CASTING MARKET, BY END-USE INDUSTRY, 2019 TO 2030 (USD MILLION)
-
\r\nFIGURE 20 GLOBAL METAL CASTING MARKET, BY END-USE INDUSTRY, 2019 TO
-
(KILO TONS) 71\r\nFIGURE 21 GLOBAL METAL CASTING MARKET, BY REGION,
-
2030 (USD MILLION) 91\r\nFIGURE 22 GLOBAL METAL CASTING MARKET, BY REGION,
-
2030 (KILO TONS) 92\r\nFIGURE 23 NORTH AMERICA: METAL CASTING MARKET
-
SHARE, BY COUNTRY, 2020 (% SHARE) 94\r\nFIGURE 24 EUROPE: METAL CASTING MARKET
-
SHARE, BY COUNTRY, 2020 (% SHARE) 110\r\nFIGURE 25 ASIA-PACIFIC: METAL CASTING
-
MARKET SHARE, BY COUNTRY, 2020 (% SHARE) 152\r\nFIGURE 26 LATIN AMERICA:
-
METAL CASTING MARKET SHARE, BY COUNTRY, 2020 (% SHARE) 189\r\nFIGURE 27 MIDDLE
-
EAST & AFRICA: METAL CASTING MARKET SHARE, BY COUNTRY, 2020 (% SHARE) 216\r\nFIGURE
-
COMPETITIVE BENCHMARKING 245\r\nFIGURE 29 ENDURANCE TECHNOLOGIES LIMITED:
-
FINANCIAL OVERVIEW SNAPSHOT 247\r\nFIGURE 30 ENDURANCE TECHNOLOGIES LIMITED:
-
SWOT ANALYSIS 249\r\nFIGURE 31 GF CASTING SOLUTIONS AG: FINANCIAL OVERVIEW
-
SNAPSHOT 250\r\nFIGURE 32 GF CASTING SOLUTIONS AG: SWOT ANALYSIS 253\r\nFIGURE
-
RYOBI LIMITED: FINANCIAL OVERVIEW SNAPSHOT 255\r\nFIGURE 34 RYOBI LIMITED:
-
SWOT ANALYSIS 256\r\nFIGURE 35 DYNACAST: SWOT ANALYSIS 259\r\nFIGURE
-
PRECISION CASTPARTS CORP: SWOT ANALYSIS 262\r\nFIGURE 37 GIBBS: SWOT ANALYSIS
-
\r\nFIGURE 38 ALCAST TECHNOLOGIES: SWOT ANALYSIS 267\r\nFIGURE
-
AHRESTY WILMINGTON CORPORATION: SWOT ANALYSIS 269\r\nFIGURE 40 FORCEBEYOND:
-
SWOT ANALYSIS 272\r\nFIGURE 41 RELIANCE FOUNDRY CO. LTD: SWOT ANALYSIS 274\r\n1
-
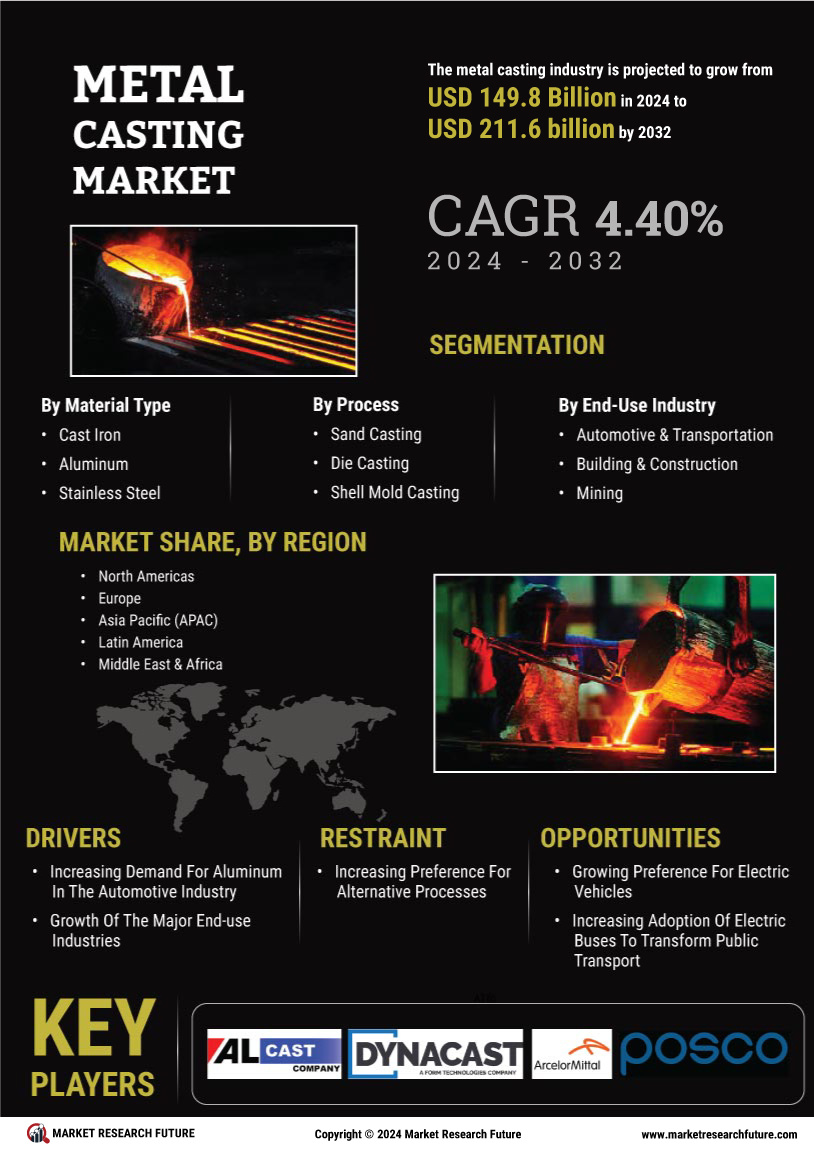
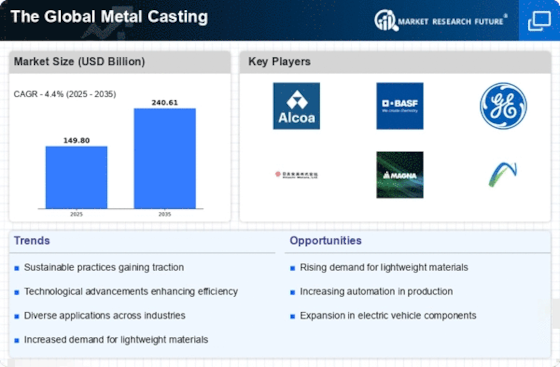
EXECUTIVE SUMMARY\r\nThe global metal casting market is projected to register
-
healthy growth during the forecast period, 2022-2030. The market was valued at USD
-
,52,817.33 million in 2020 and is projected to register a CAGR of 7.8% to reach
-
USD 5,19,103.59 million by the end of 2030. In terms of volume, the market was sized
-
at 1,01,430.00 kilo tons in 2020 and is likely to exhibit a CAGR of 6.5% to reach
-
,85,431.66 kilotons by the end of 2030. A prominent factor driving the growth of
-
the global market is the rising demand for aluminum and magnesium in the manufacturing
-
of cast products in the automotive and building and construction industries. Aluminum
-
offers superior properties such as high strength to weight ratio, lightweight, corrosion
-
resistance, ductility, recyclability, and electrical and thermal conductivity, driving
-
the demand for aluminum in the automotive industry for manufacturing lightweight
-
automotive components. With the rising concern of global warming on account of the
-
increasing emissions from automobiles, the need for light-weighting is growing rapidly.
-
This is expected to boost the demand for aluminum in the automotive industry and,
-
hence, favor the global market's growth in the years to follow. Likewise, increasing
-
use of stainless steel and cast iron in the building and construction industry in
-
various applications, including a stiff frame, roofing, purlins, ceilings, cladding,
-
railway tracks, and underground pipelines, are projected to propel the market growth
-
during the review period. Furthermore, the increasing adoption of electric vehicles
-
and electric buses to transform urban public transport is projected to create lucrative
-
opportunities for players operating in the global metal casting market.\r\nHowever,
-
due to the high cost associated with the manufacturing of die-cast products, the
-
preference for the alternative manufacturing process and metal extrusion is growing.
-
This is expected to be a key factor restraining the growth of the global market
-
during the review period.\r\nAccording to MRFR analysis, the global metal
-
casting market has been segmented based on material type, process, end use industry,
-
and region. Based on material type, the global market has been divided into cast
-
iron, aluminum, stainless steel, zinc, magnesium, carbon steel, high steel alloy
-
steel, and others. The cast iron segment accounted for the largest share of 51.07%
-
in 2020 due to their growing applications in the automotive sector. The segment
-
was valued at USD 129,113.70 million in 2020; it is expected to register a CAGR
-
of 7.4% to reach USD 256,131.49 million by the end of 2030. In terms of volume,
-
the segment was sized at 52,568.30 kilo tons in 2020 and is projected to exhibit
-
a CAGR of 6.1% to reach 92,951.97 kilo tons by the end of 2030.\r\nBy process
-
type, the global metal casting market has been classified into sand casting, die
-
casting, shell mold casting, gravity casting, vacuum casting, investment casting,
-
others. The sand casting segment dominated the global metal casting market with
-
a share of 49.35% by value in 2020 due to their growth across the region, especially
-
across the Asia-Pacific region. The segment was valued at USD 124,756.86 million
-
in 2020; it is expected to register a CAGR of 8.0% to reach USD 262,745.74 million
-
by the end of 2030. In terms of volume, the segment was sized at 51,862.31 kilo
-
tons in 2020 and is projected to exhibit a CAGR of 6.8% to reach 97,362.37 kilo
-
tons by the end of 2030.\r\nBY end use industry, the global metal casting
-
market has been classified into automotive & transportation, building &
-
construction, mining, equipment & machine, consumer goods, and others. The automotive
-
& transportation segment dominated the global metal casting market with a share
-
of 40.98% by value in 2020 due to their wide range of application in automotive
-
sector.\r\nThe market in Asia-Pacific held the largest share of 56.63% in
-
The dominance of the regional market is mainly attributed to the significant
-
growth of major end-use industries including automotive and building and construction
-
in the region. China is expected to be the leading market in the region in terms
-
of consumption, owing to the large automotive base in the country as well as low
-
energy cost and availability of skilled labors. The Asia-Pacific market is projected
-
to register the highest CAGR of 8.2% to reach USD 305,171.55 billion by the end
-
of 2030.\r\n.\r\nFIGURE 1 MARKET SYNOPSIS\r\nSource: MRFR Analysis\r\n \r\n1.1
-
MARKET ATTRACTIVENESS ANALYSIS\r\nFIGURE 2 MARKET ATTRACTIVENESS ANALYSIS:
-
GLOBAL METAL CASTING MARKET, 2020\r\nSource: MRFR Analysis\r\n \r\n1.1.1
-
GLOBAL METAL CASTING MARKET, BY MATERIAL TYPE\r\nFIGURE 3 GLOBAL METAL CASTING
-
MARKET ANALYSIS BY MATERIAL TYPE\r\nSource: MRFR Analysis\r\n \r\n1.1.2
-
GLOBAL METAL CASTING MARKET, BY PROCESS TYPE\r\nFIGURE 4 GLOBAL METAL CASTING
-
MARKET ANALYSIS BY PROCESS TYPE\r\nSource: MRFR Analysis\r\n \r\n1.1.3
-
GLOBAL METAL CASTING MARKET, BY END USE INDUSTRY\r\nFIGURE 5 GLOBAL METAL
-
CASTING MARKET ANALYSIS BY END USE INDUSTRY\r\nSource: MRFR Analysis\r\n \r\n1.1.4
-
GLOBAL METAL CASTING MARKET, BY REGION\r\nFIGURE 6 GLOBAL METAL CASTING MARKET
-
ANALYSIS BY REGION\r\nSource: MRFR Analysis\r\n2 MARKET INTRODUCTION\r\n2.1
-
DEFINITION\r\nMetal casting is a manufacturing process wherein the molten
-
or liquid metal is poured into a mold made of sand, metal, or ceramics to form geometrically
-
complex parts or components. Metal cast products are majorly used in industry sectors,
-
including automotive, building and construction, mining, and heavy equipment, wherein
-
the automotive industry is the major consumer. The major types of metals used in
-
metal casting include grey iron, ductile iron, aluminum, stainless steel, magnesium,
-
zinc, and copper alloy.\r\n2.2 SCOPE OF THE STUDY\r\n To provide
-
a detailed analysis of the market structure along with the forecast for the next
-
six years of various segments of the global metal casting market\r\n To
-
provide insights about factors affecting the market growth\r\n To analyze
-
the global metal casting market based on various tools, such as supply chain analysis
-
and Porter’s Five Force analysis\r\n To provide historical and forecast
-
revenue of the market segments with respect to regions and their respective key
-
countries\r\n To provide country-level analysis of the market with respect
-
to the current market size and future prospective\r\n To provide country-level
-
analysis of the market for segments by material type, process type, end use, and
-
region\r\n To provide strategic profiling of key players in the market,
-
comprehensively analyzing their core competencies, and drawing a competitive landscape
-
for the market\r\n To track and analyze competitive developments, such as
-
joint ventures, strategic alliances, mergers and acquisitions, new product developments,
-
and research and developments in the global metal casting market\r\n \r\n2.3
-
MARKET STRUCTURE\r\nFIGURE 7 GLOBAL METAL CASTING MARKET: MARKET STRUCTURE\r\nSource:
-
MRFR Analysis\r\n3 RESEARCH METHODOLOGY\r\n3.1 RESEARCH PROCESS\r\nMarket
-
Research Future research is conducted by industry experts who offer insight into
-
industry structure, market segmentation, technology assessment, competitive landscape
-
(CL), penetration, as well as on emerging trends. Besides primary interviews (~80%)
-
and secondary research (~20%), their analysis is based on their years of professional
-
expertise in their respective industries. Our analysts also predict where the market
-
will be headed in the next five to ten years by analyzing historical trends and
-
current market positions. Furthermore, the varying trends of segments & categories
-
geographically presented are studied and are estimated based on primary & secondary
-
research.\r\nFIGURE 8 RESEARCH PROCESS OF MRFR\r\nSource: MRFR Analysis\r\n3.2
-
PRIMARY RESEARCH\r\nExtensive primary research was conducted to gain a more
-
in-depth insight into the market and industry performance. In this particular report,
-
we have conducted primary surveys (interviews) with the key level executives (VP,
-
CEO’s, Marketing Director, Business Development Manager and many more) of
-
the major players who are active in the market. In addition to analyzing the current
-
and historical trends, our analysts predict where the market is headed over the
-
next five to ten years.\r\n \r\n3.3 SECONDARY RESEARCH\r\nSecondary
-
research was mainly used to collect and identify information useful for the extensive,
-
technical, market-oriented, and commercial study of the global metal casting market.
-
It was also used to obtain key information about major players, market classification,
-
and segmentation according to the industry trends, geographical markets, & developments
-
related to the market and technology perspectives. For this study, analysts have
-
gathered information from various credible sources, such as annual reports, SEC
-
filings, journals, white papers, corporate presentations, company websites, an international
-
organization of chemical manufacturers, some paid databases, and many others.\r\n3.4
-
MARKET SIZE ESTIMATION\r\nBoth top-down and bottom-up approaches were used
-
to estimate and validate the size of the market and to estimate the size of various
-
other dependent submarkets of the overall metal casting market. The key players
-
in the market were identified through secondary research, and their market contributions
-
in the respective geographies were determined through primary and secondary research.
-
This entire procedure included the study of the annual and financial reports of
-
top market players and extensive interviews for key insights with industry leaders
-
such as CEOs, VPs, directors, and marketing executives. All percentage shares, splits,
-
and breakdowns were determined using secondary sources and verified through primary
-
sources. All the possible parameters that affect the market have been covered in
-
this research study have been accounted for, viewed in extensive detail, verified
-
through primary research, and analyzed to get the final quantitative and qualitative
-
data. This data has been consolidated and added with detailed inputs and analysis
-
from market research future and has been presented in this report. The following
-
process employed for the purpose of this study\r\n3.5 TOP-DOWN AND BOTTOM-UP
-
APPROACH\r\nSource: MRFR Analysis\r\n3.6 FORECAST MODEL\r\nSource:
-
MRFR Analysis\r\n \r\n3.7 LIST OF ASSUMPTIONS & LIMITATIONS\r\nTABLE
-
LIST OF ASSUMPTIONS & LIMITATIONS\r\nParameter Assumption & Limitations\r\nCurrency
-
value All the forecasts are done with the revenue and volume calculated under the
-
standard assumption that the globally accepted currency - the US Dollar's value
-
remains constant over the next five years.\r\nExchange rates and currency
-
For conversion of various currencies to USD, average historical exchange rates were
-
used according to the year specified. For all historical and current exchange rates
-
required for calculations & currency conversions - OANDA - website was used.\r\nConversion\r\nNiche
-
market segments For niche market segments where accurate data of the respective
-
timeline was not available, the data was calculated using trend line analysis. In
-
some instances, where mathematical and statistical models could not be applied to
-
arrive at the number, generalization of specific related trends to that particular
-
market was done\r\nQualitative analysis The qualitative analysis done from
-
the quantitative data arrived at is solely based on the understanding of the market
-
and its trends by the team of experts involved in making this report.\r\nAverage
-
Selling Prices (ASP) The ASPs, wherever applied, are calculated using all kinds
-
of suitable statistical and mathematical methods and considering external qualitative
-
factors affecting the prices. All the calculations interconnected between the tables
-
are done considering the finalized ASPs.\r\nSource: MRFR Analysis\r\n4
-
MARKET DYNAMICS\r\n4.1 INTRODUCTION\r\nThe growth of the global metal
-
casting market is driven by the increasing demand for metals such as aluminum and
-
magnesium in the major end-use industries such as automotive, aerospace & defense,
-
and building & construction, primarily automotive. The increasing automobile
-
production on account of the increasing demand for electric and hybrid vehicles
-
is driving the growth of the automotive industry and, thus, metal casting. With
-
the increase in residential and non-residential construction activities, the demand
-
for metals such as steel and aluminum is likely to increase in the construction
-
industry. The increasing adoption of electric vehicles and electric buses to transform
-
urban public transport is projected to create lucrative opportunities for the players
-
operating in the global metal casting market. Furthermore, the increasing use of
-
D printed patterns and molds in the metal casting process is one of the prominent
-
trends noticed in the market. However, the increasing preference for alternative
-
processes is likely to hamper the global market growth.\r\nFIGURE 9 MARKET
-
DYNAMICS OVERVIEW\r\nSource: MRFR Analysis\r\n4.2 DRIVERS\r\n4.2.1
-
INCREASING DEMAND FOR ALUMINUM IN THE AUTOMOTIVE INDUSTRY\r\nThe growth of
-
the global metal casting market is driven by the increasing demand for metals such
-
as aluminum and magnesium in the major end-use industries such as automotive, aerospace
-
& defense, and building & construction, primarily automotive. The demand
-
for aluminum is growing at a significant rate owing to its superior properties such
-
as high strength to weight ratio, lightweight, ductility, corrosion resistance,
-
recyclability, and electrical and thermal conductivity. Aluminum is widely used
-
in manufacturing engine and powertrain castings and body structures, back trunks,
-
doors, shock towers, cross members, bumpers, and body extrusions of cars.\r\nThe
-
increasing use of aluminum in automobiles on account of the surge in demand for
-
lightweight and fuel-efficient vehicles to reduce carbon emissions is expected to
-
boost the global market growth during the forecast period. Aluminum is also used
-
to manufacture other parts of automobile components such as heat exchangers, wheels,
-
heads, blocks, and hoods. It helps reduce carbon emissions and boost fuel economy,
-
thus enhancing vehicle performance. The increasing automobile production in the
-
developing economies on account of increased spending coupled with rising per capita
-
disposable income of consumers is driving the growth of the automotive industry,
-
which is likely to fuel the demand for aluminum.\r\nAdditionally, increasing
-
environmental regulations and emission targets set by the regulatory authorities
-
such as the European Union (EU) and US Environmental Protection Agency (EPA) to
-
curb carbon emissions have increased the production of lightweight, hybrid, and
-
electric vehicles, which has fueled the demand for aluminum at a significant rate.
-
As of 2019, according to the European Aluminium, a European car on average uses
-
around 179 kg of aluminum. This is expected to increase to 198.8 kg by 2025. In
-
the US, the average aluminum content in cars is expected to increase from 180 kg
-
in 2016 to around 235 kg in 2025.\r\nThe key automobile manufacturers such
-
as Nissan, Hyundai, Volkswagen AG, Kia, and Tesla are focusing on manufacturing
-
electric and plug-in vehicles to meet the emission standards. For instance, in November
-
, Nissan will deliver exciting, electrified vehicles and several technological
-
innovations to empower society and build a smart ecosystem with integrated mobility.
-
Also, the company plans to expand its business globally with a vision to become
-
carbon neutral across the life cycle of its innovative product by the end of 2050.
-
Thus, the increasing production and sale of automobiles are driving the growth of
-
the automotive industry. The industry's growth is expected to fuel the demand for
-
different metals, particularly aluminum, which is expected to fuel the growth of
-
the global metal casting market during the review period.\r\n4.2.2 GROWTH
-
OF THE MAJOR END-USE INDUSTRIES\r\nThe growth of the major end-use industries
-
such as automotive, building & construction, aerospace & defense, and electrical
-
& electronics is driving the demand for metals, and thus metal casting. Although
-
the demand for aluminum is increasing substantially in the automotive industry,
-
the demand for magnesium is also likely to increase in the coming years due to its
-
light weighting property. Also, with the development of advanced high-strength steel,
-
the demand for steel is also growing in the automotive industry. Hence, the increasing
-
use of metals in the automotive industry to manufacture different automobile components
-
is likely to boost the growth of the global metal casting market.\r\nWith
-
the increase in residential and non-residential construction activities, the demand
-
for metals such as steel and aluminum is likely to increase in the construction
-
industry. Steel is primarily used due to its strength, versatility, and durability
-
in applications such as stiff frame, roofing, purlins, ceilings, cladding, heating
-
& cooling equipment, shelving, stairs for buildings, and rebar, plates, railway
-
tracks, and underground pipelines. On the other hand, aluminum finds application
-
in windows, roofing, cladding, curtain walling & structural glazing, prefabricated
-
buildings, shop fittings, and partitions. The expanding construction industry in
-
developing nations such as India, China, Thailand, and Indonesia due to rising residential
-
construction coupled with population growth and increasing per capita disposable
-
income is expected to fuel the demand for metals and, consequently, metal casting.
-
Increasing investments by governments in commercial construction for infrastructure
-
development in various countries such as Thailand, Indonesia, and Malaysia are also
-
likely to drive the demand for steel and aluminum, which is expected to propel the
-
growth of the metal casting market in the coming years. In terms of revenue, the
-
global market is estimated to be USD 4.5 trillion in 2020 and is expected to reach
-
USD 15.2 trillion over the forthcoming year.\r\nThe global aerospace and
-
defense industry is witnessing healthy growth on account of increasing aircraft
-
production and higher defense spending, mainly in the UAE, Saudi Arabia, India,
-
China, and Russia. China is the second-largest and fastest-growing civil aerospace
-
and aviation service across the globe. Although aluminum is widely used in the manufacturing
-
of aircraft components, the usage of stainless steel has recently increased due
-
to its properties such as high strength, corrosion resistance, and temperature resistance.\r\nFurthermore,
-
the electrical and electronics industry with increased spending on consumer electronics
-
is expected to witness significant growth during the review period. A variety of
-
metals such as aluminum, copper, and nickel are widely used in the industry, which
-
is expected to boost the demand for metal casting.\r\nThus, the growth of
-
the aforementioned end-use industries is projected to boost the demand for metals
-
and fuel the growth of the global metal casting market during the forecast period.\r\nFIGURE
-
DRIVERS IMPACT ANALYSIS\r\nSource: MRFR Analysis\r\n4.3 RESTRAINTS\r\n4.3.1
-
INCREASING PREFERENCE FOR ALTERNATIVE PROCESSES\r\nAmong various processes
-
used in metal casting, die casting is one of the most widely used methods for manufacturing
-
metal products. The die casting process is energy-intensive and can be cost-effective
-
only when there is significant volume production of die-cast components. However,
-
the process involves huge capital costs for tools, dies, and energy consumed during
-
the process. The costs associated with the dies and tools can be compensated by
-
manufacturing at least 5,000–10,000 castings per year.\r\nThe most
-
energy-intensive process in die casting is the melting and holding of the metal,
-
which accounts for approximately 55% of the overall energy cost. In 2019, the energy
-
cost of manufacturing automotive die casting was around USD 0.17/lb. In addition,
-
the high cost of tools and dies limits high volume production. Also, using this
-
process may result in internal porosity, unintentional surface voids, and other
-
imperfections. This has resulted in shifting preference towards metal extruded products,
-
which offer stiffness similar to metal-cast products but with higher ductility and
-
low tooling cost. Also, the metal extrusion process is more effective for manufacturing
-
long and straight metal parts such as L-shapes, T-shapes, tubes, and rectangular
-
shapes than the metal casting process.\r\nFurthermore, HPDC (high pressure
-
die casting) process is a type of die costing process which are also used for die
-
casting. It requires some disciplines and competencies to run the HPDC design and
-
production, such as multidisciplinary R&D activities for automation, metallurgy,
-
heat transfer, furnace, machine design, and construction.\r\nMoreover, growing
-
innovation and increasing investments in die casting technologies by various market
-
players to set up manufacturing plants in Asia. Major automobile companies and OEMs
-
are focusing on design, die casting, and automotive production owing to the low
-
labor and production costs in Asia can hamper the market growth.\r\nThus,
-
the growing preference for die casting is expected to restrain the global market
-
growth during the review period.\r\nFIGURE 11 RESTRAINTS IMPACT ANALYSIS\r\nSource:
-
MRFR Analysis\r\n4.4 OPPORTUNITIES\r\n4.4.1 GROWING PREFERENCE FOR
-
ELECTRIC VEHICLES\r\nAluminum is extensively used in the manufacturing of
-
components used in electric vehicles, such as battery housings, E-drivers, inverters,
-
brake components, and charging stations. Besides, the automobile components made
-
using metals such as aluminum, magnesium, and advanced high strength steel are being
-
preferred for application in electric vehicles owing to their lightweight, which
-
enhances the battery performance for the long run and thus, increases the driving
-
range. This range can be defined as the theoretical maximum distance drivable in
-
hours with optimal driving and recharging.\r\nThe growing electromobility
-
in developing economies, especially in India and South-East Asia, with the rising
-
production and sale of electric vehicles, is likely to fuel the demand for lightweight
-
metals such as aluminum and magnesium at a significant rate in the coming years.
-
The increasing government support to increase the production of electric vehicles
-
in South-East Asia is likely to add to the market growth in the coming years. For
-
instance, in June 2018, the Government of Thailand signed a letter of intent with
-
the Japan External Trade Organization (Jetro) to encourage the manufacturing of
-
electric vehicles in Thailand. Also, FOMM (Asia) Co., Ltd, a Japanese manufacturer
-
of four-seater electric vehicles, has planned to manufacture its first four-seat
-
compact electric vehicle in Thailand. Moreover, in India, the limit of the adjusted-for-curb-weight
-
corporate average fuel efficiency of carbon dioxide per kilometer is reduced from
-
g to 113 g, applicable by 2022. Automobile manufacturers such as Maruti and
-
Honda are focusing on increasing the production of hybrid vehicles. Also, in March
-
, the Indian government approved Faster Adoption and Manufacturing of Electric
-
Vehicles in India Phase II scheme to promote the manufacturing of electric vehicles
-
in India and proposed to grant incentives to the manufacturers and also provide
-
subsidies of up to USD 1.27 billion to the buyers. In Malaysia, around 5,403 electric
-
vehicles and 46,981 plug-in hybrid vehicles were registered as of 31 March 2019.
-
In the same line, in December 2020, the Greek state investment and trade promotion
-
agency had signed an agreement with German manufacturer Next.e.GO Mobile SE, to
-
establish an electric vehicle full-scale manufacturing facility in Greece.\r\nAdditionally,
-
the proposed investment in electric vehicles by the automotive giants such as Volkswagen
-
and BMW are likely to drive the demand for lightweight metals. For instance, in
-
, Volkswagen proposed to invest around USD 24 billion in the manufacturing of
-
zero-emission vehicles by 2030 and roll out 80 new EV models across its multi-brand
-
group by 2025 and offer an electric version to each of its 300 group models by 2030.
-
Also, BMW proposed to roll around 12 battery-powered models by 2025. Thus, the growing
-
electromobility across the globe is expected to create lucrative opportunities for
-
the players operating in the global metal casting market during the review period.\r\n \r\nFIGURE
-
GLOBAL ELECTRIC PASSENGER CAR STOCK, 2015–2020\r\nSource: IEA Organisation
-
and MRFR Analysis\r\n4.4.2 INCREASING ADOPTION OF ELECTRIC BUSES TO TRANSFORM
-
PUBLIC TRANSPORT\r\nMoreover, increasing adoption of electric buses primarily
-
in Europe, the US, and China to transform public transport is likely to create lucrative
-
opportunities for the market players. According to the China Bus Statistics Information
-
Union, around 55,658 new energy buses were sold in the first three quarters of 2018.
-
The electric bus market in Europe is likely to grow significantly due to the increasing
-
demand in the region to reduce carbon emissions. The European Commission approved
-
around USD 78.36 million in 2018 to promote the purchase of electric buses in Germany
-
and further proposed to provide an additional USD 341 million in March 2020. Also,
-
in 2018, VDL Bus & Coach supplied 100 electric buses to Connexxion for the Amstelland
-
Meerlanden concession in Amsterdam, Europe, making it the world's largest electric
-
bus fleet. In addition, VDL Bus & Coach will supply 102 Citeas to Oslo South
-
in 2021, making it Europe's largest electric bus fleet. Furthermore, roughly 10%
-
of the Dutch fleet will be electrified by 2020.\r\nSome of the key developments
-
noticed in the European Electric Bus market include the supply of around 100 electric
-
buses by the Netherland-based bus manufacturers, VDL Bus & Coach to Connexxion
-
(part of Transdev) for the Amstelland Meerlanden concession. Also, the company won
-
the contract for the supply of 55 units of electric buses to Rotterdam public transport
-
operator RET. And More than 160 electric buses have struck the streets of Groningen-Drenthe,
-
a new concession in Europe, in 2019. The public transportation company Qbuzz will
-
acquire a huge number of vehicles from three manufacturers: Ebusco will provide
-
e-buses, VDL will provide 43 zero-emission vehicles, and Heuliez Bus will provide
-
another 59. These 162 buses will join the 10 VDL e-buses that are already in operation.\r\nThus,
-
the growing adoption of electric buses for public transport, mainly in the developed
-
markets, is also expected to create growth opportunities for the players in the
-
global market.\r\n \r\n4.4.3 INCREASING FDI IN THE ELECTRICAL
-
AND ELECTRONICS INDUSTRY IN EMERGING ECONOMIES\r\nWith the increased spending
-
on consumer electronics and growing digitalization in emerging economies such as
-
India, China, and South-East Asian nations such as Thailand, Vietnam, Singapore,
-
and Indonesia, the electronic manufacturers from developed nations are investing
-
heavily in developing nations. In 2020, FDI from the US accounted for USD 244.9
-
billion to USD 6.15 trillion by the end of 2020, of which the investments in the
-
manufacturing sector was 20%.\r\nIn 2017, an electronics manufacturer New
-
Kinpo Group (Taiwan Province of China), opened a plant in the Philippines by investing
-
around USD 31.5 million and is further planning to invest around USD 31 million
-
to increase the production of electronic components. Also, in 2020, Kobelco Aluminum
-
Products & Extrusions Inc. had announced the expansion of its manufacturing
-
plant with an investment of USD 42 million. The company’s Bowling Green plant
-
will add a melting furnace and extrusion press at its manufacturing site along with
-
jobs. Kobelco makes aluminum extrusion bumpers and frame components for automobiles.\r\nThus,
-
with the increasing investments in emerging markets by international electronic
-
manufacturers, the demand for aluminum and steel will increase, which in turn is
-
likely to exhibit significant growth opportunities for the players engaged in the
-
metal casting process.\r\n4.5 TRENDS\r\n4.5.1 3D PRINTING TECHNIQUE
-
IS GAINING TRACTION IN THE TRADITIONAL METAL CASTING PROCESS\r\nWith certain
-
constraints associated with the metal casting process, primarily the high cost of
-
making mold and the complex manufacturing process, a flexible and efficient casting
-
process has increased. As a result of this, the players involved in the foundry
-
are adopting 3D printing techniques with the traditional metal casting process,
-
eliminating the need to make molds, reducing process steps, and thus making the
-
process more efficient and cost-effective. 3D printing technique enables printing
-
of patterns without making molds and facilitates greater design freedom. The 3D
-
printed casting patterns, sand cores, and molds are being used widely and gaining
-
greater traction.\r\nThe 3D printing technique can be used with any existing
-
casting methods, including die casting, investment casting, and sand casting. Typically,
-
a sand casting process embroils an object from molten metal using sand as a mold.
-
After which, the casting design frequently requires cores to be positioned into
-
the mold to make the interior contours of the casting. The process can be shortened
-
by using sand molds and cores directly from 3D CAD (computer-aided design) files.\r\n3D
-
printing technique with casting methods is ideal for highly complex and low-volume
-
casting jobs. Stereolithography, fused deposition modeling, digital light process,
-
multi-jet fusion, polyjet, direct metal laser sintering, and electron beam melting
-
are various types of 3D printing technology. Some commonly used 3D printing technologies
-
include Selective Laser Melting (SLM), Direct Metal Laser Sintering (DMLS), and
-
Binder Jetting.\r\n5 MARKET FACTOR ANALYSIS\r\n5.1 SUPPLY CHAIN ANALYSIS\r\nThe
-
supply chain analysis enables the reader to comprehend the steps and stakeholders
-
involved in producing and distributing metal casting. The metal casting supply chain
-
includes raw materials & suppliers, producers, distribution & sales channels,
-
and end use.\r\nFIGURE 13 SUPPLY CHAIN ANALYSIS FOR GLOBAL METAL CASTING
-
MARKET\r\nSource: MRFR Analysis\r\n5.1.1 RAW MATERIAL SUPPLIERS\r\nRaw
-
material procurement is the key to an optimized supply chain; hence, manufacturers
-
maintain an effective supplier–manufacturer relationship through collaborations.
-
The primary raw materials required in metal casting manufacturing include aluminum,
-
steel, zinc, magnesium, and their respective alloys. Some of the leading aluminum
-
suppliers include Dynacast, Al-Hindalco Industries Limited, Ryobi Limited, and PHB
-
Corp, and zinc and its alloys include PHB Corp, Belmont Metals, and Zibo Deyuan
-
Metal Material Co., Ltd.\r\n5.1.2 METAL CASTING PRODUCERS\r\nThe global
-
metal casting market comprises a significant number of tier-1, tier-2, and small
-
unorganized players. Some key metal casting manufacturers include Alcast Technologies,
-
Dynacast, ArcelorMittal, POSCO, and Reliance Foundry Co. Ltd. The players operating
-
in the global market are emphasizing business expansion and product launches to
-
meet the growing demand for metals in various end-use industries, including automotive,
-
building & construction, and electrical & electronics.\r\n5.1.3 DISTRIBUTION
-
& SALES CHANNEL\r\nThe distribution channel comprises entities involved
-
in the process, such as distributors, wholesalers, retailers, and value-added resellers
-
(VARs) to make the final product available in the market for end-users. The major
-
manufacturers operating in the global metal casting market partner with various
-
distributors across regions to ensure a continuous supply of their metal-casted
-
products worldwide. Additionally, with the growing awareness regarding e-commerce,
-
the manufacturers are selling their products through e-commerce platforms such as
-
Alibaba (China), Amazon (US), and IndiaMART InterMESH Ltd (India).\r\n5.1.4
-
END USE INDUSTRY\r\nThe growth of the global metal casting market is driven
-
by the increasing demand for metals in major end-use industries such as automotive,
-
building & construction, mining, equipment & machine, aerospace & defense,
-
and electrical & electronics. The expanding automotive industry on account of
-
the increased manufacturing of electric and hybrid vehicles is the primary factor
-
driving the growth of the global metal casting market. The use of metal-casted products
-
in end-use industries differs from industry to industry. For instance, in the automotive
-
industry, aluminum is used widely, and in the construction industry, steel is being
-
widely preferred owing to its specific properties. The building and construction
-
industry is also one of the major consumers of metal-cast products on account of
-
rising residential construction coupled with the increased requirement of modern
-
architecture and smart buildings.\r\n \r\n5.2 PORTER'S FIVE FORCES
-
ANALYSIS\r\nMichael Porter's Five Forces model offers a framework to study
-
the global metal casting market. Business managers, trying to gain a competitive
-
edge for their brands over peers in the market, can utilize this model to comprehend
-
better the industry in which the firm operates. The components of each of the forces
-
and the degree of impact of each component in the context of the global metal casting
-
market have been broken down and analyzed.\r\nFIGURE 14 PORTER'S FIVE FORCES
-
ANALYSIS OF THE GLOBAL METAL CASTING MARKET\r\nSource: MRFR Analysis\r\n5.2.1
-
THREAT OF NEW ENTRANTS\r\nThe global metal casting market is expected to
-
witness a moderate threat of new entrants during the review period. Although the
-
metal casting process is complex and capital intensive, with the introduction of
-
D printing techniques in the metal casting process, the manufacturing cost of metal-cast
-
products is expected to decline as the 3D printing process eliminates the need of
-
making molds and thus, makes the manufacturing process efficient and cost-effective.
-
Besides, the increasing demand for metals in major end-use industries such as automotive,
-
building & construction, aerospace & defense, and electrical & electronics
-
is likely to incentivize the entry of new players in the global metal casting market.\r\n \r\n5.2.2
-
BARGAINING POWER OF SUPPLIERS\r\nThe bargaining power of suppliers is expected
-
to be moderate, as the market is fragmented with organized and unorganized players,
-
and the switching cost to the buyers is also low. However, with the introduction
-
of the 3D printing technique, the players have shifted to 3D printed patterns and
-
molds for producing metal-cast products, which require high capital investment initially
-
but reduce the overall cost of manufacturing casted products. Thus, the players
-
that use 3D printed patterns and molds offer customized casted products at a competitive
-
cost and thus, possess high bargaining power in the market over players using traditional
-
casting processes.\r\n5.2.3 THREAT OF SUBSTITUTES\r\nThe threat of
-
substitutes in the global metal casting market is expected to be moderate. Due to
-
certain limitations associated with the metal casting process, such as high capital
-
requirement (cost of tools, dies, and energy consumed during the process), complicated
-
process, internal porosity, unintentional surface voids, and other imperfections,
-
the end users are shifting towards products manufactured using the metal extrusion
-
process. The products manufactured through this process offer stiffness similar
-
to the products manufactured through metal casting but with higher flexibility and
-
involve low tooling cost. Also, the metal extrusion process is more effective for
-
manufacturing long and straight metal parts such as L-shapes, T-shapes, tubes, and
-
rectangular shapes than the metal casting process.\r\n5.2.4 BARGAINING POWER
-
OF BUYERS\r\nThe bargaining power of buyers is expected to be moderate as
-
there are numerous choices available for the buyers wherein they can switch easily.
-
However, some players provide customized products made using 3D printed patterns
-
and molds at a competitive cost as compared to other players producing casted products
-
using the traditional method and thus, are likely to have more bargaining power
-
over buyers.\r\n5.2.5 INTENSITY OF RIVALRY\r\nThe degree of competition
-
among the existing players in the global market is expected to be moderate. With
-
the increasing demand for metals in major end-use industries globally, the players
-
are likely to expand their production capacities and business presence. Also, the
-
increasing use of 3D printed patterns and molds by the players to manufacture casted
-
products is expected to increase the rivalry among the market players.\r\n5.3
-
PRICING OVERVIEW, 2019-2021 (USD/TONS)\r\nTABLE 2 PRICING OVERVIEW, BY REGION\r\nRegion
-
2020 2021\r\nNorth America 2,615.98 2,636.36 2,666.80\r\nEurope
-
,695.36 2,716.35 2,747.70\r\nAsia-Pacific 2,378.54 2,397.03 2,424.67\r\nLatin
-
America 2,466.55 2,485.82 2,514.56\r\nMiddle East & Africa 2,518.74 2,538.48
-
,567.91\r\nSource: MRFR Analysis\r\n5.4 IMPACT OF COVID 19 OUTBREAK
-
ON GLOBAL METAL CASTING MARKET\r\n5.4.1 OVERVIEW\r\nThe outbreak has
-
significantly impacted the chemicals & materials supply chains, international
-
trade, and manufacturing operations across the world. The production of metal casting
-
got declined amidst the COVID-19 pandemic as the market players had to shut production
-
facilities or operate the facilities below the optimal production capacities to
-
avoid the spread of the novel coronavirus. Additionally, the lack of availability
-
of raw materials owing to supply disruptions due to border and trade restrictions
-
have impacted the production of metal casting. However, some large market players
-
have continued operations at their production facilities. Furthermore, the declining
-
prices of raw materials and low demand from the end-use industries have resulted
-
in surplus stocks and, thus, reduced production.\r\n5.4.2 QUALITATIVE ANALYSIS
-
ON CHANGES IN SUPPLY CHAIN\r\nThe primary raw materials used to manufacture
-
metal casting are aluminum, steel, zinc, and magnesium. The outbreak caused a huge
-
impact on the supply of raw materials as the majority of its raw material is used
-
in automotive components. The automotive industry was worst hit by the global COVID
-
crisis, which affected the price margins of raw material as well as end products.
-
Thus, the outbreak has resulted in the disruption of the supply-demand of raw materials.\r\nCOVID-19
-
has impacted on the global sales of metal casting. The construction industry, which
-
constitutes the highest share of the global metal casting market, has come to a
-
halt across the globe, which has had a major impact on the market. The manufacturers
-
are unable to run down their products to the application industries due to a reduction
-
in logistics. The manufacturers are providing products to local areas. With the
-
ease of lockdown across many regions, the companies are coming up with more secure
-
and hygienic ways to deliver products across various regions. On the other hand,
-
the suppliers are back to business, and distribution channels have re-opened.\r\nThe
-
sales & distribution channel comprises distributors, retailers, wholesalers,
-
and e-commerce merchants that have signed long-term agreements with the manufacturer
-
to assure the availability of the final product at different locations as and when
-
required.\r\nAutomotive and transportation, mining, equipment and machine,
-
consumer goods applications are the key consumers of metal casting. The operations
-
of these end-use industries have come to a halt due to the global lockdown and government
-
policies to reduce the spread of this virus. Gradually, resuming operations across
-
the globe to balance the economic output will result in an increased demand for
-
metal casting.\r\n5.4.3 QUALITATIVE ANALYSIS ON CHANGE IN DEMAND FOR METAL
-
CASTING INDUSTRY DUE TO COVID-19\r\nWith the rapid, continuous spread of
-
the novel coronavirus worldwide, the construction activities in both residential
-
and commercial spaces are taking extreme measures in the form of closures to halt
-
the spread of novel coronavirus. Most constructors plan on halting production in
-
North America to slow the spread of the virus. China witnessed an over 60% drop
-
in the construction market in December 2020. As a result, Chinese construction manufacturers
-
have petitioned the government to stimulate the market through subsidies, tax breaks,
-
and temporary reductions in regulations on emissions.\r\nOwing to the unprecedented
-
health and economic crisis, the construction supply chain is particularly hit hard.
-
The two major production hubs, China and India, have been severely affected, causing
-
significant disruptions on the supply side. Furthermore, a collapse in demand has
-
led to brands and retailers breaking contracts, canceling orders, delaying shipments,
-
and demanding discounts from suppliers. Moreover, many producers shifted their focus
-
on the production of other fast revenue-generating products, which led to the decline
-
in the demand for metal casting.\r\n5.4.4 MAJOR GOVERNMENT POLICIES TO COUNTER
-
THE PANDEMIC\r\nThe world has experienced more than 406 million COVID-19
-
cases and more than 5.79 million deaths and finds itself in the middle of the strong
-
second wave of SARS-CoV-2. Several countries across the globe continue to be hit
-
by the sharp decline in global oil prices. Federal and provincial governments have
-
implemented a range of measures to mitigate the spread of the virus, including travel
-
restrictions, social distancing, declarations of states of emergency, and closures
-
of non-essential businesses in some provinces.\r\nIn December 2021, WHO declared
-
the omicron variant a high concern. Countries across North America Europe, and Asia-Pacific
-
have reported a continuously rising number of omicron variant cases. A recent surge
-
in new cases has prompted a tightening of restrictions in several countries.\r\n5.4.5
-
KEY POLICY RESPONSES AS OF DECEMBER 2020\r\n5.4.5.1 FISCAL POLICIES\r\n
-
USD 20 billion (0.9% of GDP) to the health system to support increased testing,
-
vaccine development, medical supplies, mitigation efforts, and greater support for
-
Indigenous communities\r\n around USD 249 billion (11.6% of GDP) in direct
-
aid to households and firms, including wage subsidies, payments to workers without
-
sick leave and access to employment insurance, an increase in existing GST tax credits
-
and child-care benefits, and a new distinctions-based Indigenous Community Support
-
Fund\r\n around USD 85 billion (3.9% of GDP) in liquidity support through
-
tax deferrals.\r\n \r\n6 GLOBAL METAL CASTING MARKET,\r\nBY
-
MATERIAL TYPE\r\n6.1 OVERVIEW\r\nOn the basis of material type, the
-
global metal casting market has been segmented into cast iron, aluminium, stainless
-
steel, zinc, magnesium, carbon steel, high steel alloy steel, and others. The cast
-
iron segment accounted for the largest share of the global metal casting market
-
in 2020 and is expected to register a CAGR of 7.38% to reach USD 256,131.49 million
-
by the end of 2030. Aluminum was the fastest-growing segment in 2020 and is expected
-
to register a CAGR of 8.80% during the review period.\r\nFIGURE 15 GLOBAL
-
METAL CASTING MARKET, BY MATERIAL TYPE, 2019 TO 2030 (USD MILLION)\r\nSource:
-
Indiana Cast Metal Association (INCMA), American Foundry Society (AFS), The North
-
American Die Casting Association, NON-FERROUS FOUNDERS’ SOCIETY, Aluminium
-
Casters’ Association of India, Casting Industry Suppliers Association, International
-
Trade Centre, World Trade Centre, Government Websites, Press Releases, Journals,
-
Annual Reports, Whitepapers, Company Websites, and MRFR Analysis\r\n \r\n6.1.1
-
METAL CASTING: MARKET ESTIMATES & FORECAST BY MATERIAL TYPE, 2022-2030\r\nTABLE
-
METAL CASTING MARKET ESTIMATES & FORECAST, BY MATERIAL TYPE, 2022-2030 (USD
-
MILLION)\r\nMaterial Type 2019 2020 2021 2030 CAGR (2022-2030)\r\nCast
-
Iron 139,030.35 129,113.70 134,919.01 256,131.49 7.38%\r\nAluminium 60,447.14
-
,906.72 60,276.52 128,761.02 8.80%\r\nStainless Steel 28,014.49 26,331.81
-
,847.90 58,759.24 8.65%\r\nZinc 9,512.47 8,883.66 9,335.34 18,642.28 7.99%\r\nMagnesium
-
,778.60 6,301.94 6,592.47 12,640.41 7.50%\r\nCarbon Steel 4,284.78 3,938.66
-
,073.15 6,978.76 6.17%\r\nHigh Steel Alloy 6,898.42 6,390.24 6,660.56 12,341.69
-
%\r\nOthers 16,349.48 14,950.59 15,377.85 24,848.69 5.48%\r\nTotal
-
,315.72 252,817.33 265,082.81 519,103.59 7.75%\r\nSource: Indiana Cast
-
Metal Association (INCMA), American Foundry Society (AFS), The North American Die
-
Casting Association, NON-FERROUS FOUNDERS’ SOCIETY, Aluminium Casters’
-
Association of India, Casting Industry Suppliers Association, International Trade
-
Centre, World Trade Centre, Government Websites, Press Releases, Journals, Annual
-
Reports, Whitepapers, Company Websites, and MRFR Analysis\r\nThe cast iron
-
segment accounted for the largest market share of 51.07% in 2020, with a market
-
value of USD 129,113.7 million; it is expected to register a CAGR of 7.38% during
-
the forecast period. The aluminium segment accounted for the second largest market
-
share in 2020, valued at USD 56,906.7 million; it is projected to register the highest
-
CAGR of 8.80%.\r\nFIGURE 16 GLOBAL METAL CASTING MARKET, BY MATERIAL TYPE,
-
TO 2030 (KILO TONS)\r\nSource: Indiana Cast Metal Association (INCMA),
-
American Foundry Society (AFS), The North American Die Casting Association, NON-FERROUS
-
FOUNDERS’ SOCIETY, Aluminium Casters’ Association of India, Casting
-
Industry Suppliers Association, International Trade Centre, World Trade Centre,
-
Government Websites, Press Releases, Journals, Annual Reports, Whitepapers, Company
-
Websites, and MRFR Analysis\r\n \r\n6.1.2 METAL CASTING: MARKET
-
ESTIMATES & FORECAST BY MATERIAL TYPE, 2022-2030\r\nTABLE 4 METAL CASTING
-
MARKET ESTIMATES & FORECAST, BY MATERIAL TYPE, 2022-2030 (KILO TONS)\r\nMaterial
-
Type 2019 2020 2021 2030 CAGR (2022-2030)\r\nCast Iron 57,026.84 52,568.30
-
,324.07 92,951.97 6.15%\r\nAluminium 24,305.91 22,713.27 23,791.94 45,806.33
-
%\r\nStainless Steel 10,705.71 9,988.69 10,447.22 19,873.33 7.41%\r\nZinc
-
,732.59 3,460.10 3,595.77 6,471.69 6.75%\r\nMagnesium 2,640.80 2,436.94
-
,521.03 4,356.14 6.27%\r\nCarbon Steel 1,738.15 1,585.82 1,621.69 2,502.17
-
%\r\nHigh Steel Alloy 2,796.35 2,571.14 2,650.17 4,424.62 5.86%\r\nOthers
-
,726.67 6,105.74 6,210.76 9,045.40 4.27%\r\nTotal 109,673.03 101,430.00
-
,162.62 185,431.66 6.50%\r\nSource: Indiana Cast Metal Association (INCMA),
-
American Foundry Society (AFS), The North American Die Casting Association, NON-FERROUS
-
FOUNDERS’ SOCIETY, Aluminium Casters’ Association of India, Casting
-
Industry Suppliers Association, International Trade Centre, World Trade Centre,
-
Government Websites, Press Releases, Journals, Annual Reports, Whitepapers, Company
-
Websites, and MRFR Analysis\r\nThe cast iron segment dominated the market
-
with a share of 51.83%, accounting for 52,568.30 kilo tons in 2020; it is projected
-
to exhibit a CAGR of 6.15%. The aluminium segment was the second-largest with a
-
share of 22.39% in 2020, sized at 22,713.27 kilo tons; it is projected to exhibit
-
the highest CAGR of 7.55%.\r\n \r\n6.2 CAST IRON\r\nCast
-
iron is a ferrous alloy that contains more than 2% carbon. Cast iron is majorly
-
used in transportation and industrial machines & equipment. Cast iron, based
-
on type, can be categorized as gray iron, white iron, ductile iron, malleable iron,
-
and compacted graphite iron. It is being used in various applications, including
-
engine blocks, manifolds, gas burners, enclosures, housings, railroad brake shoes,
-
hydraulic components, automobile door hinges, sprockets, connecting rods, and farm
-
& construction machinery. It possesses superior properties such as hardness,
-
flexibility, elasticity, tensile strength, malleability, and fatigue strength.\r\n6.2.1
-
CAST IRON: MARKET ESTIMATES & FORECAST BY REGION,2022-2030\r\nTABLE 5
-
CAST IRON MARKET ESTIMATES & FORECAST, BY REGION, 2022-2030 (USD MILLION)\r\nRegion
-
2020 2021 2030 CAGR (2022-2030)\r\nNorth America 19,245.30 17,780.88
-
,484.49 33,449.03 6.81%\r\nEurope 23,933.45 22,049.63 22,856.28 40,224.91
-
%\r\nAsia-Pacific 78,383.63 73,070.78 76,646.93 150,487.62 7.78%\r\nLatin
-
America 7,727.71 7,164.71 7,474.51 13,978.06 7.20%\r\nMiddle East & Africa
-
,740.26 9,047.70 9,456.79 17,991.87 7.41%\r\nTotal 139,030.35 129,113.70
-
,919.01 256,131.49 7.38%\r\nSource: Indiana Cast Metal Association (INCMA),
-
American Foundry Society (AFS), The North American Die Casting Association, NON-FERROUS
-
FOUNDERS’ SOCIETY, Aluminium Casters’ Association of India, Casting
-
Industry Suppliers Association, International Trade Centre, World Trade Centre,
-
Government Websites, Press Releases, Journals, Annual Reports, Whitepapers, Company
-
Websites, and MRFR Analysis\r\nAsia-Pacific accounted for the largest market
-
share of 56.59% in 2020, with a market value of USD 73,070.8 million; it is expected
-
to register the highest CAGR of 7.78% during the forecast period. Europe accounted
-
for the second largest market share in 2020, valued at USD 22,049.6 million; it
-
is projected to exhibit a CAGR of 6.48%.\r\nTABLE 6 CAST IRON MARKET ESTIMATES
-
& FORECAST, BY REGION, 2022-2030 (KILO TONS)\r\nRegion 2019 2020 2021
-
CAGR (2022-2030)\r\nNorth America 7,462.67 6,842.30 7,032.67 11,445.68
-
%\r\nEurope 9,015.01 8,242.04 8,446.88 13,368.15 5.23%\r\nAsia-Pacific
-
,442.64 30,938.78 32,086.63 56,666.22 6.52%\r\nLatin America 3,181.12 2,926.84
-
,018.83 5,076.61 5.95%\r\nMiddle East & Africa 3,925.40 3,618.35 3,739.05
-
,395.30 6.15%\r\nTotal 57,026.84 52,568.30 54,324.07 92,951.97 6.15%\r\nSource:
-
Indiana Cast Metal Association (INCMA), American Foundry Society (AFS), The North
-
American Die Casting Association, NON-FERROUS FOUNDERS’ SOCIETY, Aluminium
-
Casters’ Association of India, Casting Industry Suppliers Association, International
-
Trade Centre, World Trade Centre, Government Websites, Press Releases, Journals,
-
Annual Reports, Whitepapers, Company Websites, and MRFR Analysis\r\nAsia-Pacific
-
dominated the market with a share of 58.85%, accounting for 30,938.78 kilo tons
-
in 2020; it is expected to register the highest CAGR of 6.52% from 2021 to 2030.
-
Europe was the second-largest with a share of 15.68% in 2020, sized at 8,242.04
-
kilo tons; it is projected to exhibit a CAGR of 5.23%.\r\n6.3 ALUMINIUM\r\nThe
-
aluminum segment accounted for the second-largest market share and is expected to
-
exhibit the highest CAGR of 8.80% during the forecast period. This is attributed
-
to its lightweight, relatively low cost, durability, recyclability, surface finishing
-
options, versatility, and corrosion-resistant property. Aluminum casting is formed
-
by pouring molten metal into molds. Die casting, permanent mold casting, and sand
-
casting molding methods are commonly used to manufacture aluminum-casted products.
-
It is the most preferred metal for rapid production and high dimensional stability
-
with thin walls. Aluminum is used in numerous applications, including transmissions,
-
power grid lines, aircraft, heat exchangers, cooking utensils, beverage cans, welding
-
wires, brazing rods, pressure vessels, marine frames, and construction equipment.
-
The global demand for aluminum is increasing at a significant rate, primarily in
-
the automotive industry, which has resulted in increased production of aluminum
-
in the recent past.\r\n6.3.1 ALUMINIUM: MARKET ESTIMATES & FORECAST BY
-
REGION,2022-2030\r\nTABLE 7 ALUMINIUM MARKET ESTIMATES & FORECAST, BY
-
REGION, 2022-2030 (USD MILLION)\r\nRegion 2019 2020 2021 2030 CAGR (2022-2030)\r\nNorth
-
America 7,906.35 7,407.81 7,808.79 15,945.55 8.26%\r\nEurope 10,310.21 9,626.23
-
,111.41 19,968.55 7.85%\r\nAsia-Pacific 34,594.79 32,688.17 34,750.64 76,680.56
-
%\r\nLatin America 3,519.39 3,306.92 3,496.06 7,343.44 8.60%\r\nMiddle
-
East & Africa 4,116.39 3,877.59 4,109.62 8,822.91 8.86%\r\nTotal 60,447.14
-
,906.72 60,276.52 128,761.02 8.80%\r\nSource: Indiana Cast Metal Association
-
(INCMA), American Foundry Society (AFS), The North American Die Casting Association,
-
NON-FERROUS FOUNDERS’ SOCIETY, Aluminium Casters’ Association of India,
-
Casting Industry Suppliers Association, International Trade Centre, World Trade
-
Centre, Government Websites, Press Releases, Journals, Annual Reports, Whitepapers,
-
Company Websites, and MRFR Analysis\r\nAsia-Pacific accounted for the largest
-
market share of 57.44% in 2020, with a market value of USD 32,688.2 million; it
-
is expected to register the highest CAGR of 9.19% during the forecast period. Europe
-
accounted for the second largest market share in 2020, valued at USD 9,626.2 million;
-
it is projected to exhibit a CAGR of 7.85%.\r\nTABLE 8 ALUMINIUM MARKET ESTIMATES
-
& FORECAST, BY REGION, 2022-2030 (KILO TONS)\r\nRegion 2019 2020 2021
-
CAGR (2022-2030)\r\nNorth America 3,002.56 2,791.80 2,909.67 5,343.73
-
%\r\nEurope 3,802.90 3,523.51 3,659.22 6,498.45 6.59%\r\nAsia-Pacific
-
,457.70 13,556.96 14,249.62 28,282.14 7.91%\r\nLatin America 1,418.08 1,322.30
-
,382.11 2,610.66 7.32%\r\nMiddle East & Africa 1,624.67 1,518.70 1,591.31
-
,071.36 7.58%\r\nTotal 24,305.91 22,713.27 23,791.94 45,806.33 7.55%\r\nSource:
-
Indiana Cast Metal Association (INCMA), American Foundry Society (AFS), The North
-
American Die Casting Association, NON-FERROUS FOUNDERS’ SOCIETY, Aluminium
-
Casters’ Association of India, Casting Industry Suppliers Association, International
-
Trade Centre, World Trade Centre, Government Websites, Press Releases, Journals,
-
Annual Reports, Whitepapers, Company Websites, and MRFR Analysis\r\nAsia-Pacific
-
dominated the market with a share of 59.69%, accounting for 13,556.96 kilo tons
-
in 2020; it is expected to register the highest CAGR of 7.91% from 2021 to 2030.
-
Europe was the second-largest with a share of 15.51% in 2020, sized at 3,523.51
-
kilo tons; it is projected to exhibit a CAGR of 6.59%.\r\n6.4 STAINLESS STEEL\r\nStainless
-
steel is a metal alloy made of steel mixed with chromium, nickel, molybdenum, silicon,
-
aluminum, and carbon. Based on type, stainless steel can be categorized as austenitic
-
stainless steel, ferritic stainless steel, and martensitic stainless steel. Stainless
-
steel is used in various industries, including building & construction, automotive
-
& transportation, consumer goods, and healthcare, owing to its superior properties
-
such as high strength, corrosion resistance, low maintenance, and recyclability.
-
The major demand for steel is mainly in the building and construction industry.\r\n6.4.1
-
STAINLESS STEEL: MARKET ESTIMATES & FORECAST BY REGION,2022-2030\r\nTABLE
-
STAINLESS STEEL MARKET ESTIMATES & FORECAST, BY REGION, 2022-2030 (USD MILLION)\r\nRegion
-
2020 2021 2030 CAGR (2022-2030)\r\nNorth America 3,838.75 3,590.94 3,779.37
-
,618.87 8.10%\r\nEurope 4,813.29 4,479.19 4,689.67 9,008.54 7.52%\r\nAsia-Pacific
-
,982.39 15,082.87 16,015.26 35,009.72 9.08%\r\nLatin America 1,550.98 1,456.70
-
,539.36 3,221.54 8.55%\r\nMiddle East & Africa 1,829.09 1,722.11 1,824.24
-
,900.56 8.81%\r\nTotal 28,014.49 26,331.81 27,847.90 58,759.24 8.65%\r\nSource:
-
Indiana Cast Metal Association (INCMA), American Foundry Society (AFS), The North
-
American Die Casting Association, NON-FERROUS FOUNDERS’ SOCIETY, Aluminium
-
Casters’ Association of India, Casting Industry Suppliers Association, International
-
Trade Centre, World Trade Centre, Government Websites, Press Releases, Journals,
-
Annual Reports, Whitepapers, Company Websites, and MRFR Analysis\r\nAsia-Pacific
-
accounted for the largest market share of 57.28% in 2020, with a market value of
-
USD 15,082.9 million ; it is expected to register the highest CAGR of 9.08% during
-
the forecast period. Europe accounted for the second largest market share in 2020,
-
valued at USD 4,479.2 million; it is projected to exhibit a CAGR of 7.52%.\r\nTABLE
-
STAINLESS STEEL MARKET ESTIMATES & FORECAST, BY REGION, 2022-2030 (KILO TONS)\r\nRegion
-
2020 2021 2030 CAGR (2022-2030)\r\nNorth America 1,386.41 1,287.03 1,339.26
-
,428.18 6.83%\r\nEurope 1,688.68 1,559.47 1,614.28 2,788.58 6.26%\r\nAsia-Pacific
-
,349.84 5,946.89 6,243.25 12,276.27 7.80%\r\nLatin America 594.61 554.20
-
1,089.61 7.28%\r\nMiddle East & Africa 686.17 641.09 671.41 1,290.69
-
%\r\nTotal 10,705.71 9,988.69 10,447.22 19,873.33 7.41%\r\nSource:
-
Indiana Cast Metal Association (INCMA), American Foundry Society (AFS), The North
-
American Die Casting Association, NON-FERROUS FOUNDERS’ SOCIETY, Aluminium
-
Casters’ Association of India, Casting Industry Suppliers Association, International
-
Trade Centre, World Trade Centre, Government Websites, Press Releases, Journals,
-
Annual Reports, Whitepapers, Company Websites, and MRFR Analysis\r\nAsia-Pacific
-
dominated the market with a share of 59.54%, accounting for 5,946.89 kilo tons in
-
; it is expected to register the highest CAGR of 7.80% from 2021 to 2030. Europe
-
was the second-largest with a share of 15.61% in 2020, sized at 1,559.47 kilo tons;
-
it is projected to exhibit a CAGR of 6.26%.\r\n6.5 ZINC\r\nZinc possesses
-
superior strength, durability, aesthetic features, excellent finishing capabilities,
-
rigidity, and economical castability. No other metal offers the combined features
-
of toughness and strength, and its performance also exceeds those of cast aluminum
-
and magnesium. In addition, greenhouse emissions are minimized with zinc die casting
-
alloys, and the production rate is much faster than aluminum and magnesium. Zinc
-
and its alloys are used in the production of die-cast parts such as gear shifters,
-
braking systems, engine mounting components, steering systems, turbocharger systems,
-
and consumer electronics.\r\n6.5.1 ZINC: MARKET ESTIMATES & FORECAST
-
BY REGION,2022-2030\r\nTABLE 11 ZINC MARKET ESTIMATES & FORECAST, BY
-
REGION, 2022-2030 (USD MILLION)\r\nRegion 2019 2020 2021 2030 CAGR (2022-2030)\r\nNorth
-
America 1,169.90 1,087.81 1,138.10 2,181.44 7.50%\r\nEurope 1,832.43 1,698.37
-
,771.11 3,290.66 7.13%\r\nAsia-Pacific 5,042.46 4,727.32 4,986.80 10,304.79
-
%\r\nLatin America 569.42 531.16 557.52 1,101.69 7.86%\r\nMiddle
-
East & Africa 898.25 839.00 881.80 1,763.71 8.01%\r\nTotal 9,512.47 8,883.66
-
,335.34 18,642.28 7.99%\r\nSource: Indiana Cast Metal Association (INCMA),
-
American Foundry Society (AFS), The North American Die Casting Association, NON-FERROUS
-
FOUNDERS’ SOCIETY, Aluminium Casters’ Association of India, Casting
-
Industry Suppliers Association, International Trade Centre, World Trade Centre,
-
Government Websites, Press Releases, Journals, Annual Reports, Whitepapers, Company
-
Websites, and MRFR Analysis\r\nAsia-Pacific accounted for the largest market
-
share of 53.21% in 2020, with a market value of USD 4,727.3 million; it is expected
-
to register the highest CAGR of 8.40% during the forecast period. Europe accounted
-
for the second largest market share in 2020, valued at USD 1,698.4 million; it is
-
projected to exhibit a CAGR of 7.13%.\r\nTABLE 12 ZINC MARKET ESTIMATES &
-
FORECAST, BY REGION, 2022-2030 (KILO TONS)\r\nRegion 2019 2020 2021 2030
-
CAGR (2022-2030)\r\nNorth America 435.28 401.65 415.47 716.23 6.24%\r\nEurope
-
608.81 627.71 1,048.79 5.87%\r\nAsia-Pacific 2,063.06 1,919.42 2,001.92
-
,721.09 7.13%\r\nLatin America 224.89 208.18 216.04 383.88 6.60%\r\nMiddle
-
East & Africa 347.44 322.04 334.62 601.69 6.74%\r\nTotal 3,732.59 3,460.10
-
,595.77 6,471.69 6.75%\r\nSource: Indiana Cast Metal Association (INCMA),
-
American Foundry Society (AFS), The North American Die Casting Association, NON-FERROUS
-
FOUNDERS’ SOCIETY, Aluminium Casters’ Association of India, Casting
-
Industry Suppliers Association, International Trade Centre, World Trade Centre,
-
Government Websites, Press Releases, Journals, Annual Reports, Whitepapers, Company
-
Websites, and MRFR Analysis\r\nAsia-Pacific dominated the market with a share
-
of 55.47%, accounting for 1,919.42 kilo tons in 2020; it is expected to register
-
the highest CAGR of 7.13% from 2021 to 2030. Europe was the second-largest with
-
a share of 17.60% in 2020, sized at 608.81 kilo tons; it is projected to exhibit
-
a CAGR of 5.87%.\r\n6.6 MAGNESIUM\r\nMagnesium is the lightest of
-
all structural materials; it is 75% lighter than steel and 33% lighter than aluminum
-
and is widely used for engineering applications. It possesses superior properties
-
such as excellent heat dissipation, damping, impact resistance, high strength to
-
weight ratio, easy castability, excellent dimensional stability, and 100% recyclability.
-
Magnesium is used to manufacture steering brackets, transmission, steering wheels,
-
gear covers, aircraft & missile components, ladders, portable consumer electronics,
-
and machines. The demand for magnesium is high in the automotive & transportation,
-
and aerospace & defense industries due to its lightweight as compared to aluminum.\r\n6.6.1
-
MAGNESIUM: MARKET ESTIMATES & FORECAST BY REGION,2022-2030\r\nTABLE 13
-
MAGNESIUM MARKET ESTIMATES & FORECAST, BY REGION, 2022-2030 (USD MILLION)\r\nRegion
-
2020 2021 2030 CAGR (2022-2030)\r\nNorth America 827.06 765.04 796.27
-
,456.98 6.94%\r\nEurope 1,347.99 1,244.50 1,292.75 2,319.66 6.71%\r\nAsia-Pacific
-
,497.55 3,263.70 3,426.83 6,790.20 7.89%\r\nLatin America 463.90 431.08
-
860.89 7.45%\r\nMiddle East & Africa 642.09 597.61 625.87 1,212.69
-
%\r\nTotal 6,778.60 6,301.94 6,592.47 12,640.41 7.50%\r\nSource:
-
Indiana Cast Metal Association (INCMA), American Foundry Society (AFS), The North
-
American Die Casting Association, NON-FERROUS FOUNDERS’ SOCIETY, Aluminium
-
Casters’ Association of India, Casting Industry Suppliers Association, International
-
Trade Centre, World Trade Centre, Government Websites, Press Releases, Journals,
-
Annual Reports, Whitepapers, Company Websites, and MRFR Analysis\r\nAsia-Pacific
-
accounted for the largest market share of 51.79% in 2020, with a market value of
-
USD 3,263.7 million; it is expected to register the highest CAGR of 7.89% during
-
the forecast period. Europe accounted for the second largest market share in 2020,
-
valued at USD 1,244.5 million; it is projected to exhibit a CAGR of 6.71%.\r\nTABLE
-
MAGNESIUM MARKET ESTIMATES & FORECAST, BY REGION, 2022-2030 (KILO TONS)\r\nRegion
-
2020 2021 2030 CAGR (2022-2030)\r\nNorth America 305.84 280.75 288.91
-
5.69%\r\nEurope 483.98 443.41 455.39 734.81 5.46%\r\nAsia-Pacific
-
,422.12 1,316.94 1,367.15 2,436.66 6.63%\r\nLatin America 181.92 167.76
-
297.88 6.19%\r\nMiddle East & Africa 246.94 228.07 236.15 411.34
-
%\r\nTotal 2,640.80 2,436.94 2,521.03 4,356.14 6.27%\r\nSource:
-
Indiana Cast Metal Association (INCMA), American Foundry Society (AFS), The North
-
American Die Casting Association, NON-FERROUS FOUNDERS’ SOCIETY, Aluminium
-
Casters’ Association of India, Casting Industry Suppliers Association, International
-
Trade Centre, World Trade Centre, Government Websites, Press Releases, Journals,
-
Annual Reports, Whitepapers, Company Websites, and MRFR Analysis\r\nAsia-Pacific
-
dominated the market with a share of 54.04%, accounting for 1,316.94 kilo tons in
-
; it is expected to register the highest CAGR of 6.63% from 2021 to 2030. Europe
-
was the second-largest with a share of 18.20% in 2020, sized at 443.41 kilo tons;
-
it is projected to exhibit a CAGR of 5.46%.\r\n6.7 CARBON STEEL\r\nCarbon
-
steel is a steel alloy in which carbon serves as the primary alloying element. Cast
-
alloy steels have been developed to operate under conditions requiring higher pressures,
-
wear resistance, and higher strength with increased toughness and hardenability.
-
The mechanical properties of carbon steel are determined by the percentage of carbon
-
present and the higher the percentage of steel. Carbon steels are found in various
-
applications, including automotive, construction, military, and defense applications.\r\n6.7.1
-
CARBON STEEL: MARKET ESTIMATES & FORECAST BY REGION,2022-2030\r\nTABLE
-
CARBON STEEL MARKET ESTIMATES & FORECAST, BY REGION, 2022-2030 (USD MILLION)\r\nRegion
-
2020 2021 2030 CAGR (2022-2030)\r\nNorth America 681.73 625.19 645.05
-
,085.13 5.95%\r\nEurope 844.63 772.12 794.08 1,294.60 5.58%\r\nAsia-Pacific
-
,175.16 2,004.55 2,078.18 3,633.19 6.40%\r\nLatin America 230.91 211.90
-
368.98 5.98%\r\nMiddle East & Africa 352.34 324.90 337.08 596.87
-
%\r\nTotal 4,284.78 3,938.66 4,073.15 6,978.76 6.17%\r\nSource:
-
Indiana Cast Metal Association (INCMA), American Foundry Society (AFS), The North
-
American Die Casting Association, NON-FERROUS FOUNDERS’ SOCIETY, Aluminium
-
Casters’ Association of India, Casting Industry Suppliers Association, International
-
Trade Centre, World Trade Centre, Government Websites, Press Releases, Journals,
-
Annual Reports, Whitepapers, Company Websites, and MRFR Analysis\r\nAsia-Pacific
-
accounted for the largest market share of 50.89% in 2020, with a market value of
-
USD 2,004.5 million; it is expected to register a CAGR of 6.40% during the forecast
-
period. Europe accounted for the second largest market share in 2020, valued at
-
USD 772.1 million; it is projected to exhibit a CAGR of 5.58%. However, Middle East
-
& Africa is expected to register the highest CAGR of 6.40%.\r\nTABLE
-
CARBON STEEL MARKET ESTIMATES & FORECAST, BY REGION, 2022-2030 (KILO TONS)\r\nRegion
-
2020 2021 2030 CAGR (2022-2030)\r\nNorth America 263.01 239.36 244.17
-
4.71%\r\nEurope 316.43 287.05 291.88 427.90 4.34%\r\nAsia-Pacific
-
844.25 865.39 1,360.85 5.16%\r\nLatin America 94.26 85.84 87.61 132.84
-
%\r\nMiddle East & Africa 141.31 129.31 132.64 211.15 5.30%\r\nTotal
-
,738.15 1,585.82 1,621.69 2,502.17 4.94%\r\nSource: Indiana Cast Metal Association
-
(INCMA), American Foundry Society (AFS), The North American Die Casting Association,
-
NON-FERROUS FOUNDERS’ SOCIETY, Aluminium Casters’ Association of India,
-
Casting Industry Suppliers Association, International Trade Centre, World Trade
-
Centre, Government Websites, Press Releases, Journals, Annual Reports, Whitepapers,
-
Company Websites, and MRFR Analysis\r\nAsia-Pacific dominated the market
-
with a share of 53.24%, accounting for 844.25 kilo tons in 2020 and is projected
-
to register a CAGR of 5.16%. Europe was the second-largest with a share of 18.10%
-
in 2020, sized at 287.05 kilo tons; it is projected to exhibit a CAGR of 4.34%.
-
However, Middle East & Africa is expected to register the highest CAGR of 5.30%.\r\n6.8
-
HIGH STEEL ALLOY\r\nHigh-alloy steels are defined by a high percentage of
-
alloying elements. Stainless steel, which contains at least 12% chromium, is the
-
most common high-alloy steel. There are three types of stainless steel: martensitic,
-
ferritic, and austenitic. Martensitic steels have the least amount of chromium,
-
a high hardenability, and are commonly used for cutlery. Ferritic steels have a
-
chromium content ranging from 12 to 27 percent and are commonly used in automobiles
-
and industrial equipment. Austenitic steels, which contain high levels of nickel,
-
carbon, manganese, or nitrogen, are frequently used to store corrosive liquids as
-
well as mining, chemical, or pharmacy equipment.\r\n6.8.1 HIGH STEEL ALLOY:
-
MARKET ESTIMATES & FORECAST BY REGION,2022-2030\r\nTABLE 17 HIGH STEEL
-
ALLOY MARKET ESTIMATES & FORECAST, BY REGION, 2022-2030 (USD MILLION)\r\nRegion
-
2020 2021 2030 CAGR (2022-2030)\r\nNorth America 939.73 866.45 898.89
-
,595.48 6.58%\r\nEurope 1,186.96 1,091.49 1,129.30 1,952.70 6.27%\r\nAsia-Pacific
-
,768.11 3,501.94 3,661.97 6,982.25 7.43%\r\nLatin America 459.45 425.48
-
820.09 7.07%\r\nMiddle East & Africa 544.19 504.87 527.05 991.18
-
%\r\nTotal 6,898.42 6,390.24 6,660.56 12,341.69 7.09%\r\nSource:
-
Indiana Cast Metal Association (INCMA), American Foundry Society (AFS), The North
-
American Die Casting Association, NON-FERROUS FOUNDERS’ SOCIETY, Aluminium
-
Casters’ Association of India, Casting Industry Suppliers Association, International
-
Trade Centre, World Trade Centre, Government Websites, Press Releases, Journals,
-
Annual Reports, Whitepapers, Company Websites, and MRFR Analysis\r\nAsia-Pacific
-
accounted for the largest market share of 54.80% in 2020, with a market value of
-
USD 3,501.9 million; it is expected to register the highest CAGR of 7.43% during
-
the forecast period. Europe accounted for the second largest market share in 2020,
-
valued at USD 1,091.5 million; it is projected to exhibit a CAGR of 6.27%.\r\nTABLE
-
HIGH STEEL ALLOY MARKET ESTIMATES & FORECAST, BY REGION, 2022-2030 (KILO
-
TONS)\r\nRegion 2019 2020 2021 2030 CAGR (2022-2030)\r\nNorth America
-
329.90 338.38 540.18 5.33%\r\nEurope 442.17 403.50 412.75 641.79 5.03%\r\nAsia-Pacific
-
,589.64 1,466.11 1,515.79 2,599.56 6.18%\r\nLatin America 186.95 171.81
-
294.41 5.82%\r\nMiddle East & Africa 217.05 199.83 206.24 348.69
-
%\r\nTotal 2,796.35 2,571.14 2,650.17 4,424.62 5.86%\r\nSource:
-
Indiana Cast Metal Association (INCMA), American Foundry Society (AFS), The North
-
American Die Casting Association, NON-FERROUS FOUNDERS’ SOCIETY, Aluminium
-
Casters’ Association of India, Casting Industry Suppliers Association, International
-
Trade Centre, World Trade Centre, Government Websites, Press Releases, Journals,
-
Annual Reports, Whitepapers, Company Websites, and MRFR Analysis\r\nAsia-Pacific
-
dominated the market with a share of 57.02%, accounting for 1,466.11 kilo tons in
-
; it is expected to register the highest CAGR of 6.18% from 2021 to 2030. Europe
-
was the second-largest with a share of 15.69% in 2020, sized at 403.50 kilo tons;
-
it is projected to exhibit a CAGR of 5.03%.\r\n6.9 OTHERS\r\nThe others
-
segment includes copper, titanium, nickel, tin, and silver. It was valued at USD
-
,950.59 million in 2020 and is expected to register 5.48% CAGR during the review
-
period.\r\n6.9.1 OTHERS: MARKET ESTIMATES & FORECAST BY REGION,2022-2030\r\nTABLE
-
OTHERS MARKET ESTIMATES & FORECAST, BY REGION, 2022-2030 (USD MILLION)\r\nRegion
-
2020 2021 2030 CAGR (2022-2030)\r\nNorth America 2,448.19 2,227.47 2,279.60
-
,518.95 4.94%\r\nEurope 2,282.46 2,068.22 2,107.92 3,132.07 4.50%\r\nAsia-Pacific
-
,632.50 8,843.40 9,132.21 15,283.22 5.89%\r\nLatin America 934.76 853.27
-
1,391.96 5.28%\r\nMiddle East & Africa 1,051.57 958.24 982.04
-
,522.49 4.99%\r\nTotal 16,349.48 14,950.59 15,377.85 24,848.69 5.48%\r\nSource:
-
Indiana Cast Metal Association (INCMA), American Foundry Society (AFS), The North
-
American Die Casting Association, NON-FERROUS FOUNDERS’ SOCIETY, Aluminium
-
Casters’ Association of India, Casting Industry Suppliers Association, International
-
Trade Centre, World Trade Centre, Government Websites, Press Releases, Journals,
-
Annual Reports, Whitepapers, Company Websites, and MRFR Analysis\r\nAsia-Pacific
-
accounted for the largest market share of 59.15% in 2020, with a market value of
-
USD 8,843.4 million; it is expected to register the highest CAGR of 5.89% during
-
the forecast period. Europe accounted for the second largest market share in 2020,
-
valued at USD 2,068.2 million; it is projected to exhibit a CAGR of 4.50%.\r\nTABLE
-
OTHERS MARKET ESTIMATES & FORECAST, BY REGION, 2022-2030 (KILO TONS)\r\nRegion
-
2020 2021 2030 CAGR (2022-2030)\r\nNorth America 949.28 857.12 867.27
-
,204.07 3.71%\r\nEurope 859.87 773.20 779.13 1,041.02 3.27%\r\nAsia-Pacific
-
,109.30 3,743.97 3,822.59 5,754.17 4.65%\r\nLatin America 384.61 348.39
-
505.23 4.04%\r\nMiddle East & Africa 423.61 383.06 388.11 540.91
-
%\r\nTotal 6,726.67 6,105.74 6,210.76 9,045.40 4.27%\r\nSource:
-
Indiana Cast Metal Association (INCMA), American Foundry Society (AFS), The North
-
American Die Casting Association, NON-FERROUS FOUNDERS’ SOCIETY, Aluminium
-
Casters’ Association of India, Casting Industry Suppliers Association, International
-
Trade Centre, World Trade Centre, Government Websites, Press Releases, Journals,
-
Annual Reports, Whitepapers, Company Websites, and MRFR Analysis\r\nAsia-Pacific
-
dominated the market with a share of 61.32%, accounting for 3,743.97 kilo tons in
-
; it is expected to register the highest CAGR of 4.65% from 2021 to 2030. Europe
-
was the second-largest with a share of 12.66% in 2020, sized at 773.20 kilo tons;
-
it is projected to exhibit a CAGR of 3.27%.\r\n7 GLOBAL METAL CASTING MARKET,\r\nBY
-
PROCESS TYPE\r\n7.1 OVERVIEW\r\nBased on process type, the global
-
metal casting market is segmented into sand casting, die casting, shell mold casting,
-
gravity casting, vacuum casting, investment casting, and others. Among these, the
-
sand casting segment accounted for the largest share of the market and was valued
-
at USD 124,756.86 million in 2020. This is mainly attributed to the widespread use
-
of the process in the manufacturing of automotive components and some of the industrial
-
machine tools. The die casting process was the second-most used process for metal
-
casting. The segment is expected to register the highest CAGR of 8.44% during the
-
forecast period.\r\nFIGURE 17 GLOBAL METAL CASTING MARKET, BY PROCESS TYPE,
-
TO 2030 (USD MILLION)\r\nSource: Indiana Cast Metal Association (INCMA),
-
American Foundry Society (AFS), The North American Die Casting Association, NON-FERROUS
-
FOUNDERS’ SOCIETY, Aluminium Casters’ Association of India, Casting
-
Industry Suppliers Association, International Trade Centre, World Trade Centre,
-
Government Websites, Press Releases, Journals, Annual Reports, Whitepapers, Company
-
Websites, and MRFR Analysis\r\n \r\n7.1.1 METAL CASTING: MARKET
-
ESTIMATES & FORECAST BY PROCESS TYPE, 2022-2030\r\nTABLE 21 METAL CASTING
-
MARKET ESTIMATES & FORECAST, BY PROCESS TYPE, 2022-2030 (USD MILLION)\r\nProcess
-
Type 2019 2020 2021 2030 CAGR (2022-2030)\r\nSand Casting 133,541.02 124,756.86
-
,145.73 262,745.74 8.03%\r\nDie Casting 63,292.37 59,366.70 62,655.33
-
,886.38 8.44%\r\nShell Mold Casting 20,147.60 18,670.13 19,467.11 36,206.26
-
%\r\nGravity Casting 15,982.60 14,564.19 14,925.96 23,136.82 4.99%\r\nVacuum
-
Casting 9,333.01 8,537.38 8,784.57 14,262.60 5.53%\r\nInvestment Casting
-
,575.93 14,484.25 15,155.79 29,127.68 7.53%\r\nOthers 13,443.19 12,437.82
-
,948.33 23,738.11 6.97%\r\nTotal 271,315.72 252,817.33 265,082.81 519,103.59
-
%\r\nSource: Indiana Cast Metal Association (INCMA), American Foundry
-
Society (AFS), The North American Die Casting Association, NON-FERROUS FOUNDERS’
-
SOCIETY, Aluminium Casters’ Association of India, Casting Industry Suppliers
-
Association, International Trade Centre, World Trade Centre, Government Websites,
-
Press Releases, Journals, Annual Reports, Whitepapers, Company Websites, and MRFR
-
Analysis\r\nThe sand casting segment accounted for the largest market share
-
of 49.35% in 2020, with a market value of USD 124,756.9 million; it is expected
-
to register a CAGR of 8.03% during the forecast period. The die casting segment
-
accounted for the second largest market share in 2020, valued at USD 59,366.7 million;
-
it is projected to register the highest CAGR of 8.44%.\r\nFIGURE 18 GLOBAL
-
METAL CASTING MARKET, BY PROCESS TYPE, 2019 TO 2030 (KILO TONS)\r\nSource:
-
Indiana Cast Metal Association (INCMA), American Foundry Society (AFS), The North
-
American Die Casting Association, NON-FERROUS FOUNDERS’ SOCIETY, Aluminium
-
Casters’ Association of India, Casting Industry Suppliers Association, International
-
Trade Centre, World Trade Centre, Government Websites, Press Releases, Journals,
-
Annual Reports, Whitepapers, Company Websites, and MRFR Analysis\r\n \r\n7.1.2
-
METAL CASTING: MARKET ESTIMATES & FORECAST BY PROCESS TYPE, 2022-2030\r\nTABLE
-
METAL CASTING MARKET ESTIMATES & FORECAST, BY PROCESS TYPE, 2022-2030 (KILO
-
TONS)\r\nProcess Type 2019 2020 2021 2030 CAGR (2022-2030)\r\nSand
-
Casting 55,926.51 51,862.31 53,915.25 97,362.37 6.79%\r\nDie Casting 25,422.30
-
,669.45 24,704.18 46,158.29 7.19%\r\nShell Mold Casting 8,264.65 7,602.02
-
,838.80 13,140.08 5.91%\r\nGravity Casting 6,238.18 5,642.78 5,719.16 7,993.61
-
%\r\nVacuum Casting 3,565.67 3,237.63 3,294.52 4,821.27 4.32%\r\nInvestment
-
Casting 6,126.37 5,654.85 5,851.48 10,134.94 6.29%\r\nOthers 4,129.37 3,760.95
-
,839.23 5,821.09 4.73%\r\nTotal 109,673.03 101,430.00 105,162.62 185,431.66
-
%\r\nSource: Indiana Cast Metal Association (INCMA), American Foundry
-
Society (AFS), The North American Die Casting Association, NON-FERROUS FOUNDERS’
-
SOCIETY, Aluminium Casters’ Association of India, Casting Industry Suppliers
-
Association, International Trade Centre, World Trade Centre, Government Websites,
-
Press Releases, Journals, Annual Reports, Whitepapers, Company Websites, and MRFR
-
Analysis\r\nThe sand casting segment dominated the market with a share of
-
%, accounting for 51,862.31 kilo tons in 2020; it is projected to exhibit a
-
CAGR of 6.79%. The die casting segment was the second-largest with a share of 23.34%
-
in 2020, sized at 23,669.45 kilo tons; it is projected to exhibit the highest CAGR
-
of 7.19%.\r\n \r\n7.2 SAND CASTING\r\nSand casting is
-
the most widely used metal casting process, wherein molten metal is poured into
-
a sand mold (molds are generally provided with a cavity of the shape to be made)
-
and then allowed to solidify inside the mold. This is a comparatively low-cost process
-
and is mainly used to manufacture various industrial components, including engine
-
blocks, impellers, manifolds, support beams, cylinder heads, machine tool bases,
-
pump housings, and valves. By this manufacturing process, components of all shapes
-
can be manufactured.\r\n7.2.1 SAND CASTING: MARKET ESTIMATES & FORECAST
-
BY REGION,2022-2030\r\nTABLE 23 SAND CASTING MARKET ESTIMATES & FORECAST,
-
BY REGION, 2022-2030 (USD MILLION)\r\nRegion 2019 2020 2021 2030 CAGR (2022-2030)\r\nNorth
-
America 18,350.72 17,055.13 17,835.44 34,048.73 7.45%\r\nEurope 23,485.21
-
,762.56 22,690.08 42,085.60 7.11%\r\nAsia-Pacific 74,682.30 70,043.31 73,917.89
-
,287.28 8.44%\r\nLatin America 7,593.13 7,083.36 7,435.26 14,699.60 7.87%\r\nMiddle
-
East & Africa 9,429.65 8,812.50 9,267.06 18,624.53 8.06%\r\nTotal 133,541.02
-
,756.86 131,145.73 262,745.74 8.03%\r\nSource: Indiana Cast Metal Association
-
(INCMA), American Foundry Society (AFS), The North American Die Casting Association,
-
NON-FERROUS FOUNDERS’ SOCIETY, Aluminium Casters’ Association of India,
-
Casting Industry Suppliers Association, International Trade Centre, World Trade
-
Centre, Government Websites, Press Releases, Journals, Annual Reports, Whitepapers,
-
Company Websites, and MRFR Analysis\r\nAsia-Pacific accounted for the largest
-
market share of 56.14% in 2020, with a market value of USD 70,043.3 million; it
-
is expected to register the highest CAGR of 8.44% during the forecast period. Europe
-
accounted for the second largest market share in 2020, valued at USD 21,762.6 million;
-
it is projected to exhibit a CAGR of 7.11%.\r\nTABLE 24 SAND CASTING MARKET
-
ESTIMATES & FORECAST, BY REGION, 2022-2030 (KILO TONS)\r\nRegion 2019
-
2021 2030 CAGR (2022-2030)\r\nNorth America 7,268.59 6,703.95 6,931.45
-
,901.09 6.19%\r\nEurope 9,035.95 8,309.24 8,565.34 14,286.42 5.85%\r\nAsia-Pacific
-
,548.98 30,294.96 31,609.89 58,961.99 7.17%\r\nLatin America 3,191.88 2,954.86
-
,066.55 5,451.70 6.60%\r\nMiddle East & Africa 3,881.11 3,599.30 3,742.02
-
,761.17 6.79%\r\nTotal 55,926.51 51,862.31 53,915.25 97,362.37 6.79%\r\nSource:
-
Indiana Cast Metal Association (INCMA), American Foundry Society (AFS), The North
-
American Die Casting Association, NON-FERROUS FOUNDERS’ SOCIETY, Aluminium
-
Casters’ Association of India, Casting Industry Suppliers Association, International
-
Trade Centre, World Trade Centre, Government Websites, Press Releases, Journals,
-
Annual Reports, Whitepapers, Company Websites, and MRFR Analysis\r\nAsia-Pacific
-
dominated the market with a share of 58.41%, accounting for 30,294.96 kilo tons
-
in 2020; it is expected to register the highest CAGR of 7.17% from 2021 to 2030.
-
Europe was the second-largest with a share of 16.02% in 2020, sized at 8,309.24
-
kilo tons; it is projected to exhibit a CAGR of 5.85%.\r\n7.3 DIE CASTING\r\nThe
-
die casting segment held the second-largest market share of 23.48% in 2020 and is
-
projected to be the fastest-growing process segment during the forecast period,
-
owing to the widening scope of application of the process in manufacturing automotive
-
components. In this process, molten metal is forced under high pressure into reusable
-
metal dies to obtain the desired product. Some of the key benefits offered are that
-
it helps in manufacturing accurately dimensioned, sharply defined, smooth, or textured
-
surface metal parts. However, this process is primarily suitable for non-ferrous
-
metals such as aluminum, magnesium, and zinc.\r\n7.3.1 DIE CASTING: MARKET
-
ESTIMATES & FORECAST BY REGION,2022-2030\r\nTABLE 25 DIE CASTING MARKET
-
ESTIMATES & FORECAST, BY REGION, 2022-2030 (USD MILLION)\r\nRegion 2019
-
2021 2030 CAGR (2022-2030)\r\nNorth America 8,665.86 8,087.93 8,493.22
-
,803.66 7.88%\r\nEurope 10,870.55 10,113.28 10,585.89 20,310.82 7.51%\r\nAsia-Pacific
-
,542.77 33,465.32 35,453.30 76,004.08 8.84%\r\nLatin America 3,632.58 3,402.24
-
,585.39 7,333.33 8.28%\r\nMiddle East & Africa 4,580.61 4,297.93 4,537.53
-
,434.48 8.47%\r\nTotal 63,292.37 59,366.70 62,655.33 129,886.38 8.44%\r\nSource:
-
Indiana Cast Metal Association (INCMA), American Foundry Society (AFS), The North
-
American Die Casting Association, NON-FERROUS FOUNDERS’ SOCIETY, Aluminium
-
Casters’ Association of India, Casting Industry Suppliers Association, International
-
Trade Centre, World Trade Centre, Government Websites, Press Releases, Journals,
-
Annual Reports, Whitepapers, Company Websites, and MRFR Analysis\r\nAsia-Pacific
-
accounted for the largest market share of 56.37% in 2020, with a market value of
-
USD 33,465.3 million; it is expected to register the highest CAGR of 8.84% during
-
the forecast period. Europe accounted for the second largest market share in 2020,
-
valued at USD 10,113.3 million; it is projected to exhibit a CAGR of 7.51%.\r\nTABLE
-
DIE CASTING MARKET ESTIMATES & FORECAST, BY REGION, 2022-2030 (KILO TONS)\r\nRegion
-
2020 2021 2030 CAGR (2022-2030)\r\nNorth America 3,291.13 3,048.24 3,164.82
-
,631.50 6.61%\r\nEurope 4,010.94 3,703.03 3,832.21 6,611.86 6.25%\r\nAsia-Pacific
-
,848.12 13,873.95 14,532.23 28,022.83 7.57%\r\nLatin America 1,464.04 1,360.73
-
,417.75 2,607.55 7.00%\r\nMiddle East & Africa 1,808.07 1,683.49 1,757.17
-
,284.54 7.20%\r\nTotal 25,422.30 23,669.45 24,704.18 46,158.29 7.19%\r\nSource:
-
Indiana Cast Metal Association (INCMA), American Foundry Society (AFS), The North
-
American Die Casting Association, NON-FERROUS FOUNDERS’ SOCIETY, Aluminium
-
Casters’ Association of India, Casting Industry Suppliers Association, International
-
Trade Centre, World Trade Centre, Government Websites, Press Releases, Journals,
-
Annual Reports, Whitepapers, Company Websites, and MRFR Analysis\r\nAsia-Pacific
-
dominated the market with a share of 58.62%, accounting for 13,873.95 kilo tons
-
in 2020; it is expected to register the highest CAGR of 7.57% from 2021 to 2030.
-
Europe was the second-largest with a share of 15.64% in 2020, sized at 3,703.03
-
kilo tons; it is projected to exhibit a CAGR of 6.25%.\r\n7.4 SHELL MOLD
-
CASTING\r\nShell mold casting is similar to sand casting, wherein the molten
-
metal is poured into an expendable mold, which is a thin hardened shell of sand
-
and a thermosetting resin binder, backed up by some other material. This process
-
is mainly suitable for steel castings less than 20 pounds, and the applications
-
include cylinder heads, bushings, gears, camshafts, connecting rods, and valve bodies.\r\n7.4.1
-
SHELL MOLD CASTING: MARKET ESTIMATES & FORECAST BY REGION,2022-2030\r\nTABLE
-
SHELL MOLD CASTING MARKET ESTIMATES & FORECAST, BY REGION, 2022-2030 (USD
-
MILLION)\r\nRegion 2019 2020 2021 2030 CAGR (2022-2030)\r\nNorth America
-
,656.85 2,448.82 2,539.58 4,492.19 6.54%\r\nEurope 3,452.68 3,173.60 3,282.08
-
,651.31 6.22%\r\nAsia-Pacific 11,328.86 10,537.63 11,028.68 21,202.96 7.53%\r\nLatin
-
America 1,211.14 1,121.16 1,167.81 2,152.00 7.03%\r\nMiddle East & Africa
-
,498.07 1,388.93 1,448.97 2,707.81 7.19%\r\nTotal 20,147.60 18,670.13 19,467.11
-
,206.26 7.14%\r\nSource: Indiana Cast Metal Association (INCMA), American
-
Foundry Society (AFS), The North American Die Casting Association, NON-FERROUS FOUNDERS’
-
SOCIETY, Aluminium Casters’ Association of India, Casting Industry Suppliers
-
Association, International Trade Centre, World Trade Centre, Government Websites,
-
Press Releases, Journals, Annual Reports, Whitepapers, Company Websites, and MRFR
-
Analysis\r\nAsia-Pacific accounted for the largest market share of 56.44%
-
in 2020, with a market value of USD 10,537.6 million; it is expected to register
-
the highest CAGR of 7.53% during the forecast period. Europe accounted for the second
-
largest market share in 2020, valued at USD 3,173.6 million; it is projected to
-
exhibit a CAGR of 6.22%.\r\nTABLE 28 SHELL MOLD CASTING MARKET ESTIMATES
-
& FORECAST, BY REGION, 2022-2030 (KILO TONS)\r\nRegion 2019 2020 2021
-
CAGR (2022-2030)\r\nNorth America 1,030.13 942.23 966.11 1,536.98 5.29%\r\nEurope
-
,300.62 1,186.37 1,213.04 1,878.28 4.98%\r\nAsia-Pacific 4,831.49 4,459.86
-
,614.99 7,980.54 6.27%\r\nLatin America 498.56 458.00 471.65 781.58 5.77%\r\nMiddle
-
East & Africa 603.85 555.57 573.01 962.70 5.93%\r\nTotal 8,264.65 7,602.02
-
,838.80 13,140.08 5.91%\r\nSource: Indiana Cast Metal Association (INCMA),
-
American Foundry Society (AFS), The North American Die Casting Association, NON-FERROUS
-
FOUNDERS’ SOCIETY, Aluminium Casters’ Association of India, Casting
-
Industry Suppliers Association, International Trade Centre, World Trade Centre,
-
Government Websites, Press Releases, Journals, Annual Reports, Whitepapers, Company
-
Websites, and MRFR Analysis\r\nAsia-Pacific dominated the market with a share
-
of 58.67%, accounting for 4,459.86 kilo tons in 2020; it is expected to register
-
the highest CAGR of 6.27% from 2021 to 2030. Europe was the second-largest with
-
a share of 15.61% in 2020, sized at 1,186.37 kilo tons; it is projected to exhibit
-
a CAGR of 4.98%.\r\n7.5 GRAVITY CASTING\r\nGravity casting sometimes
-
referred to as permanent mold, is mainly used in manufacturing non-ferrous alloy
-
parts using aluminum, zinc, and copper-base alloys. The key advantages of the process
-
are dimensional accuracy, enhanced mechanical properties, and a smoother cast surface
-
finish than sand casting. In addition, gravity casting also provides faster production
-
time compared to other processes. Various parts and components manufactured using
-
the process include flanges, actuator bodies, manifolds, electrical fittings, and
-
compressor parts.\r\n7.5.1 GRAVITY CASTING: MARKET ESTIMATES & FORECAST
-
BY REGION,2022-2030\r\nTABLE 29 GRAVITY CASTING MARKET ESTIMATES & FORECAST,
-
BY REGION, 2022-2030 (USD MILLION)\r\nRegion 2019 2020 2021 2030 CAGR (2022-2030)\r\nNorth
-
America 2,124.10 1,922.77 1,957.31 2,842.73 4.23%\r\nEurope 2,666.31 2,410.09
-
,449.86 3,516.22 4.10%\r\nAsia-Pacific 9,201.08 8,420.32 8,666.34 13,964.39
-
%\r\nLatin America 946.27 861.43 881.98 1,357.88 4.91%\r\nMiddle
-
East & Africa 1,044.84 949.59 970.46 1,455.60 4.61%\r\nTotal 15,982.60
-
,560.78 14,918.96 23,078.15 4.97%\r\nSource: Indiana Cast Metal Association
-
(INCMA), American Foundry Society (AFS), The North American Die Casting Association,
-
NON-FERROUS FOUNDERS’ SOCIETY, Aluminium Casters’ Association of India,
-
Casting Industry Suppliers Association, International Trade Centre, World Trade
-
Centre, Government Websites, Press Releases, Journals, Annual Reports, Whitepapers,
-
Company Websites, and MRFR Analysis\r\nAsia-Pacific accounted for the largest
-
market share of 57.82% in 2020, with a market value of USD 8,420.32 million; it
-
is expected to register the highest CAGR of 5.44% during the forecast period. Europe
-
accounted for the second largest market share in 2020, valued at USD 2,410.1 million;
-
it is projected to exhibit a CAGR of 4.10%.\r\nTABLE 30 GRAVITY CASTING MARKET
-
ESTIMATES & FORECAST, BY REGION, 2022-2030 (KILO TONS)\r\nRegion 2019
-
2021 2030 CAGR (2022-2030)\r\nNorth America 782.58 703.01 707.55 924.26
-
%\r\nEurope 953.13 854.95 859.21 1,108.80 2.87%\r\nAsia-Pacific
-
,731.42 3,388.85 3,448.54 4,998.92 4.21%\r\nLatin America 370.52 334.74
-
469.30 3.68%\r\nMiddle East & Africa 400.53 361.23 364.99 492.34
-
%\r\nTotal 6,238.18 5,641.41 5,716.38 7,972.67 3.77%\r\nSource:
-
Indiana Cast Metal Association (INCMA), American Foundry Society (AFS), The North
-
American Die Casting Association, NON-FERROUS FOUNDERS’ SOCIETY, Aluminium
-
Casters’ Association of India, Casting Industry Suppliers Association, International
-
Trade Centre, World Trade Centre, Government Websites, Press Releases, Journals,
-
Annual Reports, Whitepapers, Company Websites, and MRFR Analysis\r\nAsia-Pacific
-
dominated the market with a share of 60.06%, accounting for 3,388.85 kilo tons in
-
; it is expected to register the highest CAGR of 4.21% from 2021 to 2030. Europe
-
was the second-largest with a share of 15.15% in 2020, sized at 854.95 kilo tons;
-
it is projected to exhibit a CAGR of 2.87%.\r\n7.6 VACUUM CASTING\r\nVacuum
-
casting is a flexible and reliable process wherein the sand mold with no moisture
-
or binders is employed. The process is commonly used in generating prototypes and
-
industrial parts. Ideal applications for vacuum casting include the production of
-
casting small components such as plastic prototype parts and prosthetic and medical
-
devices, and decorative objects, including wall plaques, delicate jewelry, and short-run
-
custom ornaments.\r\n7.6.1 VACUUM CASTING: MARKET ESTIMATES & FORECAST
-
BY REGION,2022-2030\r\nTABLE 31 VACUUM CASTING MARKET ESTIMATES & FORECAST,
-
BY REGION, 2022-2030 (USD MILLION)\r\nRegion 2019 2020 2021 2030 CAGR (2022-2030)\r\nNorth
-
America 1,317.99 1,199.90 1,228.76 1,910.11 5.02%\r\nEurope 1,593.09 1,445.71
-
,475.65 2,221.44 4.65%\r\nAsia-Pacific 5,217.89 4,790.82 4,947.79 8,298.75
-
%\r\nLatin America 594.76 544.32 560.39 917.86 5.64%\r\nMiddle
-
East & Africa 609.28 556.63 571.99 914.43 5.35%\r\nTotal 9,333.01 8,537.38
-
,784.57 14,262.60 5.53%\r\nSource: Indiana Cast Metal Association (INCMA),
-
American Foundry Society (AFS), The North American Die Casting Association, NON-FERROUS
-
FOUNDERS’ SOCIETY, Aluminium Casters’ Association of India, Casting
-
Industry Suppliers Association, International Trade Centre, World Trade Centre,
-
Government Websites, Press Releases, Journals, Annual Reports, Whitepapers, Company
-
Websites, and MRFR Analysis\r\nAsia-Pacific accounted for the largest market
-
share of 56.12% in 2020, with a market value of USD 4,790.8 million; it is expected
-
to register the highest CAGR of 5.91% during the forecast period. Europe accounted
-
for the second largest market share in 2020, valued at USD 1,445.7 million; it is
-
projected to exhibit a CAGR of 4.65%.\r\nTABLE 32 VACUUM CASTING MARKET ESTIMATES
-
& FORECAST, BY REGION, 2022-2030 (KILO TONS)\r\nRegion 2019 2020 2021
-
CAGR (2022-2030)\r\nNorth America 476.03 430.07 435.44 608.80 3.79%\r\nEurope
-
502.86 507.46 686.88 3.42%\r\nAsia-Pacific 2,074.59 1,890.32 1,930.24
-
,912.46 4.68%\r\nLatin America 227.89 206.97 210.67 310.27 4.40%\r\nMiddle
-
East & Africa 228.77 207.41 210.71 302.86 4.11%\r\nTotal 3,565.67 3,237.63
-
,294.52 4,821.27 4.32%\r\nSource: Indiana Cast Metal Association (INCMA),
-
American Foundry Society (AFS), The North American Die Casting Association, NON-FERROUS
-
FOUNDERS’ SOCIETY, Aluminium Casters’ Association of India, Casting
-
Industry Suppliers Association, International Trade Centre, World Trade Centre,
-
Government Websites, Press Releases, Journals, Annual Reports, Whitepapers, Company
-
Websites, and MRFR Analysis\r\nAsia-Pacific dominated the market with a share
-
of 58.39%, accounting for 1,890.32 kilo tons in 2020; it is expected to register
-
the highest CAGR of 4.68% from 2021 to 2030. Europe was the second-largest with
-
a share of 15.53% in 2020, sized at 502.86 kilo tons; it is projected to exhibit
-
a CAGR of 3.42%.\r\n7.7 INVESTMENT CASTING\r\nInvestment casting,
-
also known as precision casting or lost-wax casting, is a manufacturing process
-
that involves shaping a disposable ceramic mold with a wax pattern. Investment casting
-
is used in fine detail and is excellent as cast surface finishes. They can also
-
be cast with thin walls and complex internal passageways. It is used in casting
-
metals such as aluminum, bronze, magnesium, carbon steel, and stainless steel.\r\n7.7.1
-
INVESTMENT CASTING: MARKET ESTIMATES & FORECAST BY REGION,2022-2030\r\nTABLE
-
INVESTMENT CASTING MARKET ESTIMATES & FORECAST, BY REGION, 2022-2030 (USD
-
MILLION)\r\nRegion 2019 2020 2021 2030 CAGR (2022-2030)\r\nNorth America
-
,087.09 1,931.11 2,010.48 3,687.89 6.97%\r\nEurope 2,701.96 2,493.32 2,588.75
-
,624.93 6.66%\r\nAsia-Pacific 8,710.77 8,129.59 8,537.21 16,940.02 7.91%\r\nLatin
-
America 880.82 817.97 854.73 1,622.58 7.38%\r\nMiddle East & Africa 1,195.29
-
,112.26 1,164.62 2,252.25 7.60%\r\nTotal 15,575.93 14,484.25 15,155.79 29,127.68
-
%\r\nSource: Indiana Cast Metal Association (INCMA), American Foundry
-
Society (AFS), The North American Die Casting Association, NON-FERROUS FOUNDERS’
-
SOCIETY, Aluminium Casters’ Association of India, Casting Industry Suppliers
-
Association, International Trade Centre, World Trade Centre, Government Websites,
-
Press Releases, Journals, Annual Reports, Whitepapers, Company Websites, and MRFR
-
Analysis\r\nAsia-Pacific accounted for the largest market share of 56.13%
-
in 2020, with a market value of USD 8,129.6 million; it is expected to register
-
the highest CAGR of 7.91% during the forecast period. Europe accounted for the second
-
largest market share in 2020, valued at USD 2,493.3 million; it is projected to
-
exhibit a CAGR of 6.66%.\r\nTABLE 34 INVESTMENT CASTING MARKET ESTIMATES
-
& FORECAST, BY REGION, 2022-2030 (KILO TONS)\r\nRegion 2019 2020 2021
-
CAGR (2022-2030)\r\nNorth America 776.65 713.13 734.05 1,211.01 5.72%\r\nEurope
-
894.23 917.95 1,474.76 5.41%\r\nAsia-Pacific 3,563.87 3,300.79 3,427.17
-
,116.83 6.65%\r\nLatin America 347.31 320.06 330.66 564.47 6.12%\r\nMiddle
-
East & Africa 462.03 426.64 441.66 767.87 6.34%\r\nTotal 6,126.37 5,654.85
-
,851.48 10,134.94 6.29%\r\nSource: Indiana Cast Metal Association (INCMA),
-
American Foundry Society (AFS), The North American Die Casting Association, NON-FERROUS
-
FOUNDERS’ SOCIETY, Aluminium Casters’ Association of India, Casting
-
Industry Suppliers Association, International Trade Centre, World Trade Centre,
-
Government Websites, Press Releases, Journals, Annual Reports, Whitepapers, Company
-
Websites, and MRFR Analysis\r\nAsia-Pacific dominated the market with a share
-
of 58.37%, accounting for 3,300.79 kilo tons in 2020; it is expected to register
-
the highest CAGR of 6.65% from 2021 to 2030. Europe was the second-largest with
-
a share of 15.81% in 2020, sized at 894.23 kilo tons; it is projected to exhibit
-
a CAGR of 5.41%.\r\n7.8 OTHERS\r\nThe others segment includes plaster
-
mold casting and centrifugal casting.\r\n7.8.1 OTHERS: MARKET ESTIMATES &
-
FORECAST BY REGION,2022-2030\r\nTABLE 35 OTHERS MARKET ESTIMATES & FORECAST,
-
BY REGION, 2022-2030 (USD MILLION)\r\nRegion 2019 2020 2021 2030 CAGR (2022-2030)\r\nNorth
-
America 1,854.40 1,705.95 1,765.78 3,066.12 6.32%\r\nEurope 1,781.63 1,631.20
-
,680.22 2,781.35 5.76%\r\nAsia-Pacific 8,392.92 7,795.74 8,147.60 15,474.06
-
%\r\nLatin America 597.82 550.74 570.86 1,003.40 6.47%\r\nMiddle
-
East & Africa 816.43 754.18 783.87 1,413.18 6.77%\r\nTotal 13,443.19
-
,441.23 12,955.33 23,796.79 6.99%\r\nSource: Indiana Cast Metal Association
-
(INCMA), American Foundry Society (AFS), The North American Die Casting Association,
-
NON-FERROUS FOUNDERS’ SOCIETY, Aluminium Casters’ Association of India,
-
Casting Industry Suppliers Association, International Trade Centre, World Trade
-
Centre, Government Websites, Press Releases, Journals, Annual Reports, Whitepapers,
-
Company Websites, and MRFR Analysis\r\nAsia-Pacific accounted for the largest
-
market share of 62.68% in 2020, with a market value of USD 7,795.74 million; it
-
is expected to register the highest CAGR of 7.39% during the forecast period. Europe
-
accounted for the second largest market share in 2020, valued at USD 1,631.2 million;
-
it is projected to exhibit a CAGR of 5.76%.\r\nTABLE 36 OTHERS MARKET ESTIMATES
-
& FORECAST, BY REGION, 2022-2030 (KILO TONS)\r\nRegion 2019 2020 2021
-
CAGR (2022-2030)\r\nNorth America 540.51 489.28 496.38 709.29 4.05%\r\nEurope
-
390.33 392.04 502.49 2.80%\r\nAsia-Pacific 2,758.97 2,524.59 2,589.29
-
,103.38 5.25%\r\nLatin America 166.24 149.96 151.57 206.27 3.48%\r\nMiddle
-
East & Africa 228.24 206.80 209.96 299.66 4.03%\r\nTotal 4,129.37 3,762.32
-
,842.01 5,842.03 4.77%\r\nSource: Indiana Cast Metal Association (INCMA),
-
American Foundry Society (AFS), The North American Die Casting Association, NON-FERROUS
-
FOUNDERS’ SOCIETY, Aluminium Casters’ Association of India, Casting
-
Industry Suppliers Association, International Trade Centre, World Trade Centre,
-
Government Websites, Press Releases, Journals, Annual Reports, Whitepapers, Company
-
Websites, and MRFR Analysis\r\nAsia-Pacific dominated the market with a share
-
of 67.14%, accounting for 2,524.59 kilo tons in 2020; it is expected to register
-
the highest CAGR of 5.30% from 2021 to 2030. Europe was the second-largest with
-
a share of 10.37% in 2020, sized at 390.33 kilo tons; it is projected to exhibit
-
a CAGR of 2.80%.\r\n8 GLOBAL METAL CASTING MARKET,\r\nBY END-USE INDUSTRY\r\n8.1
-
OVERVIEW\r\nBased on the end-use industry, the global metal casting market
-
has been segmented into automotive & transportation, building & construction,
-
mining, equipment & machine, consumer goods, and others. The automotive &
-
transportation segment accounted for the largest market share of 40.98% in 2020
-
and expected to reach USD 220,707.06 million by the end of 2030. The increasing
-
demand for metal cast components in the automotive industry is likely to favor the
-
growth of the segment during the forecast period. The building & construction
-
industry is the second-largest consumer of metal casting products, and the segment
-
was valued at USD 44,684.61 million in 2020.\r\nFIGURE 19 GLOBAL METAL CASTING
-
MARKET, BY END-USE INDUSTRY, 2019 TO 2030 (USD MILLION)\r\nSource: Indiana
-
Cast Metal Association (INCMA), American Foundry Society (AFS), The North American
-
Die Casting Association, NON-FERROUS FOUNDERS’ SOCIETY, Aluminium Casters’
-
Association of India, Casting Industry Suppliers Association, International Trade
-
Centre, World Trade Centre, Government Websites, Press Releases, Journals, Annual
-
Reports, Whitepapers, Company Websites, and MRFR Analysis\r\n \r\n8.1.1
-
METAL CASTING: MARKET ESTIMATES & FORECAST BY END-USE INDUSTRY, 2022-2030\r\nTABLE
-
METAL CASTING MARKET ESTIMATES & FORECAST, BY END-USE INDUSTRY, 2022-2030
-
(USD MILLION)\r\nEnd-use Industry 2019 2020 2021 2030 CAGR (2022-2030)\r\nAutomotive
-
& Transportation 110,759.08 103,597.18 109,031.74 220,707.06 8.15%\r\nBuilding
-
& Construction 48,005.05 44,684.61 46,802.77 90,778.41 7.64%\r\nMining
-
,680.52 26,553.97 27,662.80 51,005.82 7.03%\r\nEquipment & Machine
-
,330.34 36,661.85 38,454.21 75,545.73 7.79%\r\nConsumer Goods 29,123.58
-
,064.83 28,301.30 54,075.74 7.46%\r\nOthers 15,417.15 14,254.89 14,830.00
-
,990.82 6.88%\r\nTotal 271,315.72 252,817.33 265,082.81 519,103.59 7.75%\r\nSource:
-
Indiana Cast Metal Association (INCMA), American Foundry Society (AFS), The North
-
American Die Casting Association, NON-FERROUS FOUNDERS’ SOCIETY, Aluminium
-
Casters’ Association of India, Casting Industry Suppliers Association, International
-
Trade Centre, World Trade Centre, Government Websites, Press Releases, Journals,
-
Annual Reports, Whitepapers, Company Websites, and MRFR Analysis\r\nThe automotive
-
& transportation segment accounted for the largest market share of 40.98% in
-
, with a market value of USD 103,597.2 million; it is expected to register the
-
highest CAGR of 8.15% during the forecast period. The building & construction
-
segment accounted for the second largest market share in 2020, valued at USD 44,684.6
-
million; it is projected to exhibit a CAGR of 7.64%.\r\nFIGURE 20 GLOBAL
-
METAL CASTING MARKET, BY END-USE INDUSTRY, 2019 TO 2030 (KILO TONS)\r\nSource:
-
Indiana Cast Metal Association (INCMA), American Foundry Society (AFS), The North
-
American Die Casting Association, NON-FERROUS FOUNDERS’ SOCIETY, Aluminium
-
Casters’ Association of India, Casting Industry Suppliers Association, International
-
Trade Centre, World Trade Centre, Government Websites, Press Releases, Journals,
-
Annual Reports, Whitepapers, Company Websites, and MRFR Analysis\r\n \r\n8.1.2
-
METAL CASTING: MARKET ESTIMATES & FORECAST BY END-USE INDUSTRY, 2022-2030\r\nTABLE
-
METAL CASTING MARKET ESTIMATES & FORECAST, BY END-USE INDUSTRY, 2022-2030
-
(KILO TONS)\r\nEnd-use Industry 2019 2020 2021 2030 CAGR (2022-2030)\r\nAutomotive
-
& Transportation 45,431.53 42,180.18 43,901.71 80,098.67 6.91%\r\nBuilding
-
& Construction 19,513.83 18,029.96 18,675.64 32,648.03 6.40%\r\nMining
-
,365.06 10,444.43 10,759.89 17,877.47 5.80%\r\nEquipment & Machine
-
,780.61 14,601.41 15,145.87 26,819.93 6.55%\r\nConsumer Goods 11,485.55
-
,594.92 10,956.44 18,869.88 6.23%\r\nOthers 6,096.45 5,579.09 5,723.08
-
,117.68 5.31%\r\nTotal 109,673.03 101,430.00 105,162.62 185,431.66 6.50%\r\nSource:
-
Indiana Cast Metal Association (INCMA), American Foundry Society (AFS), The North
-
American Die Casting Association, NON-FERROUS FOUNDERS’ SOCIETY, Aluminium
-
Casters’ Association of India, Casting Industry Suppliers Association, International
-
Trade Centre, World Trade Centre, Government Websites, Press Releases, Journals,
-
Annual Reports, Whitepapers, Company Websites, and MRFR Analysis\r\nThe automotive
-
& transportation segment dominated the market with a share of 41.59%, accounting
-
for 42,180.18 kilo tons in 2020; it is expected to register the highest CAGR of
-
% from 2021 to 2030. The building & construction segment was the second-largest
-
with a share of 17.78% in 2020, sized at 18,029.96 kilo tons; it is projected to
-
exhibit a CAGR of 6.40%.\r\n \r\n8.2 AUTOMOTIVE & TRANSPORTATION\r\nIn
-
the automotive & transportation industry, various complex-shaped and large components
-
are manufactured using metal casting. Various automotive components, including structural
-
components (front-end carriers, body & structure, door frame, seat frames, and
-
tank frame), engine parts (cylinder heads, engine brackets, engine blocks), and
-
transmission components (shafts, housings, chassis, and carriers) are manufactured
-
using metal casting. Iron, aluminum, stainless steel, and zinc are the majorly used
-
metals for casting these components/products. With the increasing demand for aluminum
-
castings in the manufacturing of lightweight automobiles to increase fuel efficiency
-
and curb emissions is expected to be a key factor propelling the growth of the segment
-
in the coming years.\r\n8.2.1 AUTOMOTIVE & TRANSPORTATION: MARKET ESTIMATES
-
& FORECAST BY REGION,\r\n2022-2030\r\nTABLE 39 AUTOMOTIVE &
-
TRANSPORTATION MARKET ESTIMATES & FORECAST, BY REGION, 2022-2030\r\n(USD
-
MILLION)\r\nRegion 2019 2020 2021 2030 CAGR (2022-2030)\r\nNorth America
-
,575.89 14,491.89 15,171.24 29,235.55 7.56%\r\nEurope 18,834.70 17,475.80
-
,244.08 34,218.45 7.24%\r\nAsia-Pacific 62,484.27 58,668.05 61,981.68 129,774.55
-
%\r\nLatin America 6,210.67 5,800.14 6,095.00 12,166.14 7.98%\r\nMiddle
-
East & Africa 7,653.55 7,161.29 7,539.73 15,312.36 8.19%\r\nTotal 110,759.08
-
,597.18 109,031.74 220,707.06 8.15%\r\nSource: Indiana Cast Metal Association
-
(INCMA), American Foundry Society (AFS), The North American Die Casting Association,
-
NON-FERROUS FOUNDERS’ SOCIETY, Aluminium Casters’ Association of India,
-
Casting Industry Suppliers Association, International Trade Centre, World Trade
-
Centre, Government Websites, Press Releases, Journals, Annual Reports, Whitepapers,
-
Company Websites, and MRFR Analysis\r\nAsia-Pacific accounted for the largest
-
market share of 56.63% in 2020, with a market value of USD 58,668.0 million; it
-
is expected to register the highest CAGR of 8.56% during the forecast period. Europe
-
accounted for the second largest market share in 2020, valued at USD 17,475.8 million;
-
it is projected to exhibit a CAGR of 7.24%.\r\n \r\nTABLE 40
-
AUTOMOTIVE & TRANSPORTATION MARKET ESTIMATES & FORECAST, BY REGION, 2022-2030\r\n(KILO
-
TONS)\r\nRegion 2019 2020 2021 2030 CAGR (2022-2030)\r\nNorth America
-
,039.98 5,576.82 5,772.27 10,004.17 6.30%\r\nEurope 7,094.52 6,532.41 6,742.41
-
,371.95 5.98%\r\nAsia-Pacific 26,657.33 24,838.88 25,945.59 48,863.45 7.29%\r\nLatin
-
America 2,555.49 2,368.35 2,460.58 4,416.65 6.72%\r\nMiddle East & Africa
-
,084.20 2,863.72 2,980.85 5,442.45 6.92%\r\nTotal 45,431.53 42,180.18 43,901.71
-
,098.67 6.91%\r\nSource: Indiana Cast Metal Association (INCMA), American
-
Foundry Society (AFS), The North American Die Casting Association, NON-FERROUS FOUNDERS’
-
SOCIETY, Aluminium Casters’ Association of India, Casting Industry Suppliers
-
Association, International Trade Centre, World Trade Centre, Government Websites,
-
Press Releases, Journals, Annual Reports, Whitepapers, Company Websites, and MRFR
-
Analysis\r\nAsia-Pacific dominated the market with a share of 58.89%, accounting
-
for 24,838.88 kilo tons in 2020; it is expected to register the highest CAGR of
-
% from 2021 to 2030. Europe was the second-largest with a share of 15.49% in
-
, sized at 6,532.41 kilo tons; it is projected to exhibit a CAGR of 5.98%.\r\nTABLE
-
METAL CASTING MARKET ESTIMATES & FORECAST, BY AUTOMOTIVE & TRANSPORTATION,
-
2030 (USD MILLION)\r\nAutomotive & Transportation 2019 2020 2021
-
CAGR (2022-2030)\r\nGearbox 21,061.46 19,859.49 21,069.60 45,717.85
-
%\r\nWheels 11,880.72 11,171.68 11,820.00 25,059.32 8.71%\r\nEngine
-
Blocks 16,165.54 15,141.16 15,957.47 32,703.24 8.30%\r\nCylinder Head 26,001.63
-
,170.70 25,281.20 48,305.89 7.46%\r\nExhaust Manifold 7,284.32 6,782.61
-
,106.11 13,795.59 7.65%\r\nSeat Frame 8,855.19 8,271.48 8,693.68 17,384.65
-
%\r\nOthers 19,510.22 18,200.06 19,103.68 37,740.52 7.86%\r\nTotal
-
,759.08 103,597.18 109,031.74 220,707.06 8.15%\r\nSource: Indiana Cast
-
Metal Association (INCMA), American Foundry Society (AFS), The North American Die
-
Casting Association, NON-FERROUS FOUNDERS’ SOCIETY, Aluminium Casters’
-
Association of India, Casting Industry Suppliers Association, International Trade
-
Centre, World Trade Centre, Government Websites, Press Releases, Journals, Annual
-
Reports, Whitepapers, Company Websites, and MRFR Analysis\r\nThe cylinder
-
head segment accounted for the largest market share of 23.33% in 2020, with a market
-
value of USD 24,170.7 million; it is expected to register a CAGR of 7.46% during
-
the forecast period. The gearbox segment accounted for the second largest market
-
share in 2020, valued at USD 19,859.5 million; it is projected to register the highest
-
CAGR of 8.99%.\r\nTABLE 42 METAL CASTING MARKET ESTIMATES & FORECAST,
-
BY AUTOMOTIVE & TRANSPORTATION, 2022-2030 (KILO TONS)\r\nAutomotive &
-
Transportation 2019 2020 2021 2030 CAGR (2022-2030)\r\nGearbox 9,104.39 8,521.37
-
,940.51 17,484.05 7.74%\r\nWheels 4,962.88 4,632.28 4,846.90 9,262.35 7.46%\r\nEngine
-
Blocks 6,910.82 6,425.12 6,696.59 12,369.72 7.06%\r\nCylinder Head 10,999.24
-
,149.24 10,498.07 18,079.60 6.23%\r\nExhaust Manifold 3,022.69 2,793.73
-
,894.60 5,065.06 6.41%\r\nSeat Frame 3,632.70 3,368.19 3,500.94 6,309.93
-
%\r\nOthers 6,798.80 6,290.25 6,524.09 11,527.96 6.53%\r\nTotal
-
,431.53 42,180.18 43,901.71 80,098.67 6.91%\r\nSource: Indiana Cast Metal
-
Association (INCMA), American Foundry Society (AFS), The North American Die Casting
-
Association, NON-FERROUS FOUNDERS’ SOCIETY, Aluminium Casters’ Association
-
of India, Casting Industry Suppliers Association, International Trade Centre, World
-
Trade Centre, Government Websites, Press Releases, Journals, Annual Reports, Whitepapers,
-
Company Websites, and MRFR Analysis\r\nThe cylinder head segment dominated
-
the market with a share of 24.06%, accounting for 10,149.24 kilo tons in 2020; it
-
is projected to exhibit a CAGR of 6.23%. The Gearbox segment was the second-largest
-
with a share of 20.20% in 2020, sized at 8,521.37 kilo tons; it is projected to
-
exhibit the highest CAGR of 7.74%.\r\n8.2.2 GEARBOX\r\nTABLE 43 GEARBOX
-
MARKET ESTIMATES & FORECAST, BY REGION, 2022-2030 (USD MILLION)\r\nRegion
-
2020 2021 2030 CAGR (2022-2030)\r\nNorth America 2,783.02 2,611.38 2,756.87
-
,712.77 8.43%\r\nEurope 3,530.66 3,302.10 3,474.59 6,978.12 8.06%\r\nAsia-Pacific
-
,099.63 11,450.93 12,193.08 27,326.75 9.38%\r\nLatin America 1,226.18 1,153.89
-
,221.76 2,604.17 8.77%\r\nMiddle East & Africa 1,421.97 1,341.19 1,423.30
-
,096.04 9.02%\r\nTotal 21,061.46 19,859.49 21,069.60 45,717.85 8.99%\r\nSource:
-
Indiana Cast Metal Association (INCMA), American Foundry Society (AFS), The North
-
American Die Casting Association, NON-FERROUS FOUNDERS’ SOCIETY, Aluminium
-
Casters’ Association of India, Casting Industry Suppliers Association, International
-
Trade Centre, World Trade Centre, Government Websites, Press Releases, Journals,
-
Annual Reports, Whitepapers, Company Websites, and MRFR Analysis\r\nAsia-Pacific
-
accounted for the largest market share of 57.66% in 2020, with a market value of
-
USD 11,450.9 million; it is expected to register the highest CAGR of 9.38% during
-
the forecast period. Europe accounted for the second largest market share in 2020,
-
valued at USD 3,302.1 million; it is projected to exhibit a CAGR of 8.06%.\r\nTABLE
-
GEARBOX MARKET ESTIMATES & FORECAST, BY REGION, 2022-2030 (KILO TONS)\r\nRegion
-
2020 2021 2030 CAGR (2022-2030)\r\nNorth America 1,136.00 1,057.81 1,104.13
-
,057.76 7.16%\r\nEurope 1,399.94 1,299.31 1,351.71 2,441.17 6.79%\r\nAsia-Pacific
-
,434.05 5,103.60 5,373.02 10,831.40 8.10%\r\nLatin America 530.93 495.81
-
994.87 7.50%\r\nMiddle East & Africa 603.48 564.83 592.61 1,158.85
-
%\r\nTotal 9,104.39 8,521.37 8,940.51 17,484.05 7.74%\r\nSource:
-
Indiana Cast Metal Association (INCMA), American Foundry Society (AFS), The North
-
American Die Casting Association, NON-FERROUS FOUNDERS’ SOCIETY, Aluminium
-
Casters’ Association of India, Casting Industry Suppliers Association, International
-
Trade Centre, World Trade Centre, Government Websites, Press Releases, Journals,
-
Annual Reports, Whitepapers, Company Websites, and MRFR Analysis\r\nAsia-Pacific
-
dominated the market with a share of 59.89%, accounting for 5,103.60 kilo tons in
-
; it is expected to register the highest CAGR of 8.10% from 2021 to 2030. Europe
-
was the second-largest with a share of 15.25% in 2020, sized at 1,299.31 kilo tons;
-
it is projected to exhibit a CAGR of 6.79%.\r\n8.2.3 WHEELS\r\nTABLE
-
WHEELS MARKET ESTIMATES & FORECAST, BY REGION, 2022-2030 (USD MILLION)\r\nRegion
-
2020 2021 2030 CAGR (2022-2030)\r\nNorth America 1,787.33 1,671.55 1,758.91
-
,545.70 8.10%\r\nEurope 2,084.22 1,944.77 2,041.67 4,021.76 7.82%\r\nAsia-Pacific
-
,480.87 6,118.72 6,499.88 14,279.43 9.14%\r\nLatin America 670.06 629.18
-
1,391.16 8.55%\r\nMiddle East & Africa 858.23 807.46 854.80 1,821.27
-
%\r\nTotal 11,880.72 11,171.68 11,820.00 25,059.32 8.71%\r\nSource:
-
Indiana Cast Metal Association (INCMA), American Foundry Society (AFS), The North
-
American Die Casting Association, NON-FERROUS FOUNDERS’ SOCIETY, Aluminium
-
Casters’ Association of India, Casting Industry Suppliers Association, International
-
Trade Centre, World Trade Centre, Government Websites, Press Releases, Journals,
-
Annual Reports, Whitepapers, Company Websites, and MRFR Analysis\r\nAsia-Pacific
-
accounted for the largest market share of 54.77% in 2020, with a market value of
-
USD 6,118.7 million; it is expected to register the highest CAGR of 9.14% during
-
the forecast period. Europe accounted for the second largest market share in 2020,
-
valued at USD 1,944.8 million; it is projected to exhibit a CAGR of 7.82%.\r\n \r\nTABLE
-
WHEELS MARKET ESTIMATES & FORECAST, BY REGION, 2022-2030 (KILO TONS)\r\nRegion
-
2020 2021 2030 CAGR (2022-2030)\r\nNorth America 707.27 656.41 682.91
-
,238.13 6.83%\r\nEurope 801.06 741.76 769.90 1,363.82 6.56%\r\nAsia-Pacific
-
,820.79 2,642.91 2,775.86 5,485.33 7.86%\r\nLatin America 281.11 261.94
-
514.95 7.28%\r\nMiddle East & Africa 352.66 329.26 344.61 660.12
-
%\r\nTotal 4,962.88 4,632.28 4,846.90 9,262.35 7.46%\r\nSource:
-
Indiana Cast Metal Association (INCMA), American Foundry Society (AFS), The North
-
American Die Casting Association, NON-FERROUS FOUNDERS’ SOCIETY, Aluminium
-
Casters’ Association of India, Casting Industry Suppliers Association, International
-
Trade Centre, World Trade Centre, Government Websites, Press Releases, Journals,
-
Annual Reports, Whitepapers, Company Websites, and MRFR Analysis\r\nAsia-Pacific
-
dominated the market with a share of 57.05%, accounting for 2,642.91 kilo tons in
-
; it is expected to register the highest CAGR of 7.86% from 2021 to 2030. Europe
-
was the second-largest with a share of 16.01% in 2020, sized at 741.76 kilo tons;
-
it is projected to exhibit a CAGR of 6.56%.\r\n8.2.4 ENGINE BLOCKS\r\nTABLE
-
ENGINE BLOCKS MARKET ESTIMATES & FORECAST, BY REGION, 2022-2030 (USD MILLION)\r\nRegion
-
2020 2021 2030 CAGR (2022-2030)\r\nNorth America 2,236.32 2,083.43 2,183.96
-
,258.32 7.70%\r\nEurope 2,726.77 2,533.41 2,648.30 5,026.47 7.38%\r\nAsia-Pacific
-
,222.49 8,670.70 9,172.55 19,433.56 8.70%\r\nLatin America 862.66 806.81
-
1,716.90 8.14%\r\nMiddle East & Africa 1,117.29 1,046.82 1,103.60
-
,267.99 8.33%\r\nTotal 16,165.54 15,141.16 15,957.47 32,703.24 8.30%\r\nSource:
-
Indiana Cast Metal Association (INCMA), American Foundry Society (AFS), The North
-
American Die Casting Association, NON-FERROUS FOUNDERS’ SOCIETY, Aluminium
-
Casters’ Association of India, Casting Industry Suppliers Association, International
-
Trade Centre, World Trade Centre, Government Websites, Press Releases, Journals,
-
Annual Reports, Whitepapers, Company Websites, and MRFR Analysis\r\nAsia-Pacific
-
accounted for the largest market share of 57.27% in 2020, with a market value of
-
USD 8,670.7 million; it is expected to register the highest CAGR of 8.70% during
-
the forecast period. Europe accounted for the second largest market share in 2020,
-
valued at USD 2,533.4 million; it is projected to exhibit a CAGR of 7.38%.\r\n \r\nTABLE
-
ENGINE BLOCKS MARKET ESTIMATES & FORECAST, BY REGION, 2022-2030 (KILO TONS)\r\nRegion
-
2020 2021 2030 CAGR (2022-2030)\r\nNorth America 903.31 835.14 865.55
-
,517.85 6.44%\r\nEurope 1,069.81 986.36 1,019.42 1,739.95 6.12%\r\nAsia-Pacific
-
,098.79 3,824.25 3,999.93 7,622.69 7.43%\r\nLatin America 370.02 343.42
-
649.71 6.87%\r\nMiddle East & Africa 468.89 435.95 454.39 839.52
-
%\r\nTotal 6,910.82 6,425.12 6,696.59 12,369.72 7.06%\r\nSource:
-
Indiana Cast Metal Association (INCMA), American Foundry Society (AFS), The North
-
American Die Casting Association, NON-FERROUS FOUNDERS’ SOCIETY, Aluminium
-
Casters’ Association of India, Casting Industry Suppliers Association, International
-
Trade Centre, World Trade Centre, Government Websites, Press Releases, Journals,
-
Annual Reports, Whitepapers, Company Websites, and MRFR Analysis\r\nAsia-Pacific
-
dominated the market with a share of 59.52%, accounting for 3,824.25 kilo tons in
-
; it is expected to register the highest CAGR of 7.43% from 2021 to 2030. Europe
-
was the second-largest with a share of 15.35% in 2020, sized at 986.36 kilo tons;
-
it is projected to exhibit a CAGR of 6.12%.\r\n8.2.5 CYLINDER HEAD\r\nTABLE
-
CYLINDER HEAD BLOCKS MARKET ESTIMATES & FORECAST, BY REGION, 2022-2030 (USD
-
MILLION)\r\nRegion 2019 2020 2021 2030 CAGR (2022-2030)\r\nNorth America
-
,591.82 3,320.70 3,454.23 6,272.52 6.85%\r\nEurope 4,378.47 4,037.58 4,188.98
-
,416.32 6.55%\r\nAsia-Pacific 14,749.12 13,762.73 14,449.65 28,550.23 7.86%\r\nLatin
-
America 1,483.49 1,377.02 1,438.17 2,711.78 7.30%\r\nMiddle East & Africa
-
,798.73 1,672.68 1,750.17 3,355.04 7.50%\r\nTotal 26,001.63 24,170.70 25,281.20
-
,305.89 7.46%\r\nSource: Indiana Cast Metal Association (INCMA), American
-
Foundry Society (AFS), The North American Die Casting Association, NON-FERROUS FOUNDERS’
-
SOCIETY, Aluminium Casters’ Association of India, Casting Industry Suppliers
-
Association, International Trade Centre, World Trade Centre, Government Websites,
-
Press Releases, Journals, Annual Reports, Whitepapers, Company Websites, and MRFR
-
Analysis\r\nAsia-Pacific accounted for the largest market share of 56.94%
-
in 2020, with a market value of USD 13,762.7 million; it is expected to register
-
the highest CAGR of 7.86% during the forecast period. Europe accounted for the second
-
largest market share in 2020, valued at USD 4,037.6 million; it is projected to
-
exhibit a CAGR of 6.55%.\r\n \r\nTABLE 50 CYLINDER HEAD MARKET
-
ESTIMATES & FORECAST, BY REGION, 2022-2030 (KILO TONS)\r\nRegion 2019
-
2021 2030 CAGR (2022-2030)\r\nNorth America 1,435.88 1,317.38 1,354.87
-
,212.75 5.60%\r\nEurope 1,700.13 1,555.79 1,595.87 2,540.72 5.30%\r\nAsia-Pacific
-
,486.71 6,006.86 6,235.48 11,081.93 6.60%\r\nLatin America 629.13 579.52
-
1,014.63 6.04%\r\nMiddle East & Africa 747.39 689.69 713.45 1,229.57
-
%\r\nTotal 10,999.24 10,149.24 10,498.07 18,079.60 6.23%\r\nSource:
-
Indiana Cast Metal Association (INCMA), American Foundry Society (AFS), The North
-
American Die Casting Association, NON-FERROUS FOUNDERS’ SOCIETY, Aluminium
-
Casters’ Association of India, Casting Industry Suppliers Association, International
-
Trade Centre, World Trade Centre, Government Websites, Press Releases, Journals,
-
Annual Reports, Whitepapers, Company Websites, and MRFR Analysis\r\nAsia-Pacific
-
dominated the market with a share of 59.19%, accounting for 6,006.86 kilo tons in
-
; it is expected to register the highest CAGR of 6.60% from 2021 to 2030. Europe
-
was the second-largest with a share of 15.33% in 2020, sized at 1,555.79 kilo tons;
-
it is projected to exhibit a CAGR of 5.30%.\r\n8.2.6 EXHAUST MANIFOLD\r\nTABLE
-
EXHAUST MANIFOLD MARKET ESTIMATES & FORECAST, BY REGION, 2022-2030 (USD MILLION)\r\nRegion
-
2020 2021 2030 CAGR (2022-2030)\r\nNorth America 963.89 892.50 929.82
-
,713.50 7.03%\r\nEurope 1,223.05 1,129.55 1,173.72 2,108.77 6.73%\r\nAsia-Pacific
-
,259.82 3,981.49 4,187.19 8,405.45 8.05%\r\nLatin America 369.89 343.66
-
683.55 7.41%\r\nMiddle East & Africa 467.67 435.41 456.12 884.31
-
%\r\nTotal 7,284.32 6,782.61 7,106.11 13,795.59 7.65%\r\nSource:
-
Indiana Cast Metal Association (INCMA), American Foundry Society (AFS), The North
-
American Die Casting Association, NON-FERROUS FOUNDERS’ SOCIETY, Aluminium
-
Casters’ Association of India, Casting Industry Suppliers Association, International
-
Trade Centre, World Trade Centre, Government Websites, Press Releases, Journals,
-
Annual Reports, Whitepapers, Company Websites, and MRFR Analysis\r\nAsia-Pacific
-
accounted for the largest market share of 58.70% in 2020, with a market value of
-
USD 3,981.5 million; it is expected to register the highest CAGR of 8.05% during
-
the forecast period. Europe accounted for the second largest market share in 2020,
-
valued at USD 1,129.6 million; it is projected to exhibit a CAGR of 6.73%.\r\n \r\nTABLE
-
EXHAUST MANIFOLD MARKET ESTIMATES & FORECAST, BY REGION, 2022-2030 (KILO
-
TONS)\r\nRegion 2019 2020 2021 2030 CAGR (2022-2030)\r\nNorth America
-
346.92 357.34 592.26 5.77%\r\nEurope 465.38 426.52 438.18 707.93 5.47%\r\nAsia-Pacific
-
,835.39 1,702.42 1,770.16 3,196.26 6.79%\r\nLatin America 153.87 141.87
-
250.89 6.15%\r\nMiddle East & Africa 190.50 176.00 182.28 317.72
-
%\r\nTotal 3,022.69 2,793.73 2,894.60 5,065.06 6.41%\r\nSource:
-
Indiana Cast Metal Association (INCMA), American Foundry Society (AFS), The North
-
American Die Casting Association, NON-FERROUS FOUNDERS’ SOCIETY, Aluminium
-
Casters’ Association of India, Casting Industry Suppliers Association, International
-
Trade Centre, World Trade Centre, Government Websites, Press Releases, Journals,
-
Annual Reports, Whitepapers, Company Websites, and MRFR Analysis\r\nAsia-Pacific
-
dominated the market with a share of 60.94%, accounting for 1,702.42 kilo tons in
-
; it is expected to register the highest CAGR of 6.79% from 2021 to 2030. Europe
-
was the second-largest with a share of 15.27% in 2020, sized at 426.52 kilo tons;
-
it is projected to exhibit a CAGR of 5.47%.\r\n8.2.7 SEAT FRAME\r\nTABLE
-
SEAT FRAME MARKET ESTIMATES & FORECAST, BY REGION, 2022-2030 (USD MILLION)\r\nRegion
-
2020 2021 2030 CAGR (2022-2030)\r\nNorth America 1,167.18 1,084.48 1,133.78
-
,158.15 7.41%\r\nEurope 1,547.24 1,433.68 1,494.70 2,769.43 7.09%\r\nAsia-Pacific
-
,029.48 4,715.69 4,975.05 10,284.88 8.40%\r\nLatin America 499.14 465.58
-
964.70 7.85%\r\nMiddle East & Africa 612.15 572.05 601.50 1,207.49
-
%\r\nTotal 8,855.19 8,271.48 8,693.68 17,384.65 8.00%\r\nSource:
-
Indiana Cast Metal Association (INCMA), American Foundry Society (AFS), The North
-
American Die Casting Association, NON-FERROUS FOUNDERS’ SOCIETY, Aluminium
-
Casters’ Association of India, Casting Industry Suppliers Association, International
-
Trade Centre, World Trade Centre, Government Websites, Press Releases, Journals,
-
Annual Reports, Whitepapers, Company Websites, and MRFR Analysis\r\nAsia-Pacific
-
accounted for the largest market share of 57.01% in 2020, with a market value of
-
USD 4,715.7 million; it is expected to register the highest CAGR of 8.40% during
-
the forecast period. Europe accounted for the second largest market share in 2020,
-
valued at USD 1,433.7 million; it is projected to exhibit a CAGR of 7.09%.\r\n \r\nTABLE
-
SEAT FRAME MARKET ESTIMATES & FORECAST, BY REGION, 2022-2030 (KILO TONS)\r\nRegion
-
2020 2021 2030 CAGR (2022-2030)\r\nNorth America 452.60 417.33 431.37
-
6.16%\r\nEurope 582.85 535.95 552.43 920.44 5.84%\r\nAsia-Pacific
-
,145.24 1,996.10 2,082.11 3,871.69 7.14%\r\nLatin America 205.33 190.06
-
350.13 6.59%\r\nMiddle East & Africa 246.69 228.76 237.81 429.19
-
%\r\nTotal 3,632.70 3,368.19 3,500.94 6,309.93 6.76%\r\nSource:
-
Indiana Cast Metal Association (INCMA), American Foundry Society (AFS), The North
-
American Die Casting Association, NON-FERROUS FOUNDERS’ SOCIETY, Aluminium
-
Casters’ Association of India, Casting Industry Suppliers Association, International
-
Trade Centre, World Trade Centre, Government Websites, Press Releases, Journals,
-
Annual Reports, Whitepapers, Company Websites, and MRFR Analysis\r\nAsia-Pacific
-
dominated the market with a share of 59.26%, accounting for 1,996.10 kilo tons in
-
; it is expected to register the highest CAGR of 7.14% from 2021 to 2030. Europe
-
was the second-largest with a share of 15.91% in 2020, sized at 535.95 kilo tons;
-
it is projected to exhibit a CAGR of 5.84%.\r\n8.2.8 OTHERS\r\nTABLE
-
OTHERS MARKET ESTIMATES & FORECAST, BY REGION, 2022-2030 (USD MILLION)\r\nRegion
-
2020 2021 2030 CAGR (2022-2030)\r\nNorth America 3,046.32 2,827.86 2,953.67
-
,574.61 7.31%\r\nEurope 3,344.28 3,094.72 3,222.13 5,897.58 6.95%\r\nAsia-Pacific
-
,642.87 9,967.78 10,504.28 21,494.25 8.28%\r\nLatin America 1,099.25 1,024.01
-
,073.36 2,093.87 7.71%\r\nMiddle East & Africa 1,377.51 1,285.69 1,350.24
-
,680.21 7.92%\r\nTotal 19,510.22 18,200.06 19,103.68 37,740.52 7.86%\r\nSource:
-
Indiana Cast Metal Association (INCMA), American Foundry Society (AFS), The North
-
American Die Casting Association, NON-FERROUS FOUNDERS’ SOCIETY, Aluminium
-
Casters’ Association of India, Casting Industry Suppliers Association, International
-
Trade Centre, World Trade Centre, Government Websites, Press Releases, Journals,
-
Annual Reports, Whitepapers, Company Websites, and MRFR Analysis\r\nAsia-Pacific
-
accounted for the largest market share of 54.77% in 2020, with a market value of
-
USD 9,967.8 million; it is expected to register the highest CAGR of 8.28% during
-
the forecast period. Europe accounted for the second largest market share in 2020,
-
valued at USD 3,094.7 million; it is projected to exhibit a CAGR of 6.95%.\r\n \r\nTABLE
-
OTHERS MARKET ESTIMATES & FORECAST, BY REGION, 2022-2030 (KILO TONS)\r\nRegion
-
2020 2021 2030 CAGR (2022-2030)\r\nNorth America 1,027.38 945.83 976.10
-
,646.94 5.98%\r\nEurope 1,075.36 986.72 1,014.89 1,657.92 5.60%\r\nAsia-Pacific
-
,836.37 3,562.75 3,709.03 6,774.14 6.92%\r\nLatin America 385.10 355.73
-
641.47 6.36%\r\nMiddle East & Africa 474.59 439.23 455.70 807.50
-
%\r\nTotal 6,798.80 6,290.25 6,524.09 11,527.96 6.53%\r\nSource:
-
Indiana Cast Metal Association (INCMA), American Foundry Society (AFS), The North
-
American Die Casting Association, NON-FERROUS FOUNDERS’ SOCIETY, Aluminium
-
Casters’ Association of India, Casting Industry Suppliers Association, International
-
Trade Centre, World Trade Centre, Government Websites, Press Releases, Journals,
-
Annual Reports, Whitepapers, Company Websites, and MRFR Analysis\r\nAsia-Pacific
-
dominated the market with a share of 56.64%, accounting for 3,562.75 kilo tons in
-
; it is expected to register the highest CAGR of 6.92% from 2021 to 2030. Europe
-
was the second-largest with a share of 15.69% in 2020, sized at 986.72 kilo tons;
-
it is projected to exhibit a CAGR of 5.60%.\r\n8.3 BUILDING & CONSTRUCTION\r\nThe
-
building and construction applications of metal castings include exterior columns
-
of the covering, handrails, elevator panels, windows, doors, and other internal
-
and external decoration components. The heavy-duty construction castings include
-
maintenance hole covers, catch basins, fabricated grates, curb inlets, trench gates,
-
bridge drains, valve boxes, and access hatches. Significant growth of the construction
-
sector in Asia-Pacific and the Middle East & Africa is projected to boost demand
-
for metal casted products and thus favor the growth of the segment in the years
-
to follow.\r\n8.3.1 BUILDING & CONSTRUCTION: MARKET ESTIMATES & FORECAST
-
BY REGION,2022-2030\r\nTABLE 57 BUILDING & CONSTRUCTION MARKET ESTIMATES
-
& FORECAST, BY REGION, 2022-2030 (USD MILLION)\r\nRegion 2019 2020 2021
-
CAGR (2022-2030)\r\nNorth America 6,114.61 5,660.52 5,896.21 10,866.59
-
%\r\nEurope 8,007.69 7,392.60 7,678.91 13,773.76 6.71%\r\nAsia-Pacific
-
,627.67 25,812.32 27,136.06 54,382.87 8.03%\r\nLatin America 2,768.33 2,572.80
-
,690.52 5,144.28 7.47%\r\nMiddle East & Africa 3,486.75 3,246.36 3,401.06
-
,610.92 7.66%\r\nTotal 48,005.05 44,684.61 46,802.77 90,778.41 7.64%\r\nSource:
-
Indiana Cast Metal Association (INCMA), American Foundry Society (AFS), The North
-
American Die Casting Association, NON-FERROUS FOUNDERS’ SOCIETY, Aluminium
-
Casters’ Association of India, Casting Industry Suppliers Association, International
-
Trade Centre, World Trade Centre, Government Websites, Press Releases, Journals,
-
Annual Reports, Whitepapers, Company Websites, and MRFR Analysis\r\nAsia-Pacific
-
accounted for the largest market share of 57.77% in 2020, with a market value of
-
USD 25,812.3 million; it is expected to register the highest CAGR of 8.03% during
-
the forecast period. Europe accounted for the second largest market share in 2020,
-
valued at USD 7,392.6 million; it is projected to exhibit a CAGR of 6.71%.\r\nTABLE
-
BUILDING & CONSTRUCTION MARKET ESTIMATES & FORECAST, BY REGION, 2022-2030
-
(KILO TONS)\r\nRegion 2019 2020 2021 2030 CAGR (2022-2030)\r\nNorth
-
America 2,346.23 2,155.45 2,219.83 3,679.46 5.78%\r\nEurope 2,984.35 2,734.09
-
,807.84 4,529.08 5.46%\r\nAsia-Pacific 11,665.64 10,816.22 11,242.55 20,266.28
-
%\r\nLatin America 1,127.64 1,039.99 1,075.26 1,848.75 6.21%\r\nMiddle
-
East & Africa 1,389.97 1,284.22 1,330.16 2,324.46 6.40%\r\nTotal 19,513.83
-
,029.96 18,675.64 32,648.03 6.40%\r\nSource: Indiana Cast Metal Association
-
(INCMA), American Foundry Society (AFS), The North American Die Casting Association,
-
NON-FERROUS FOUNDERS’ SOCIETY, Aluminium Casters’ Association of India,
-
Casting Industry Suppliers Association, International Trade Centre, World Trade
-
Centre, Government Websites, Press Releases, Journals, Annual Reports, Whitepapers,
-
Company Websites, and MRFR Analysis\r\nAsia-Pacific dominated the market
-
with a share of 59.99%, accounting for 10,816.22 kilo tons in 2020; it is expected
-
to register the highest CAGR of 6.77% from 2021 to 2030. Europe was the second-largest
-
with a share of 15.16% in 2020, sized at 2,734.09 kilo tons; it is projected to
-
exhibit a CAGR of 5.46%.\r\n8.4 MINING\r\nThe mining industry requires
-
casting components with high strength for explosion protection and require to be
-
designed to last longer and work harder in mine operations. Some of the major metal
-
cast products in the mining industry are bowl & mantle liners, crusher hammers,
-
shovel bucket teeth, bucket lip, ball mill liners, impactor hammers, and jaw plates,
-
among others. Growing mining activities across the globe for the production of various
-
metals and coal are expected to favor the growth of the segment in the coming years.\r\n8.4.1
-
MINING: MARKET ESTIMATES & FORECAST BY REGION,2022-2030\r\nTABLE 59 MINING
-
MARKET ESTIMATES & FORECAST, BY REGION, 2022-2030 (USD MILLION)\r\nRegion
-
2020 2021 2030 CAGR (2022-2030)\r\nNorth America 4,258.11 3,925.69 4,072.22
-
,220.74 6.57%\r\nEurope 5,386.64 4,953.46 5,125.08 8,862.66 6.27%\r\nAsia-Pacific
-
,265.42 14,183.61 14,828.01 28,204.29 7.41%\r\nLatin America 1,671.69 1,546.52
-
,609.84 2,948.62 6.96%\r\nMiddle East & Africa 2,098.65 1,944.70 2,027.65
-
,769.51 7.13%\r\nTotal 28,680.52 26,553.97 27,662.80 51,005.82 7.03%\r\nSource:
-
Indiana Cast Metal Association (INCMA), American Foundry Society (AFS), The North
-
American Die Casting Association, NON-FERROUS FOUNDERS’ SOCIETY, Aluminium
-
Casters’ Association of India, Casting Industry Suppliers Association, International
-
Trade Centre, World Trade Centre, Government Websites, Press Releases, Journals,
-
Annual Reports, Whitepapers, Company Websites, and MRFR Analysis\r\nAsia-Pacific
-
accounted for the largest market share of 53.41% in 2020, with a market value of
-
USD 14,183.6 million; it is expected to register the highest CAGR of 7.41% during
-
the forecast period. Europe accounted for the second largest market share in 2020,
-
valued at USD 4,953.5 million; it is projected to exhibit a CAGR of 6.27%.\r\nTABLE
-
MINING MARKET ESTIMATES & FORECAST, BY REGION, 2022-2030 (KILO TONS)\r\nRegion
-
2020 2021 2030 CAGR (2022-2030)\r\nNorth America 1,600.53 1,464.33 1,501.83
-
,395.06 5.32%\r\nEurope 1,966.07 1,794.17 1,835.32 2,854.06 5.03%\r\nAsia-Pacific
-
,310.90 5,819.05 6,014.75 10,290.43 6.15%\r\nLatin America 667.13 612.46
-
1,038.17 5.70%\r\nMiddle East & Africa 820.43 754.42 777.67 1,299.74
-
%\r\nTotal 11,365.06 10,444.43 10,759.89 17,877.47 5.80%\r\nSource:
-
Indiana Cast Metal Association (INCMA), American Foundry Society (AFS), The North
-
American Die Casting Association, NON-FERROUS FOUNDERS’ SOCIETY, Aluminium
-
Casters’ Association of India, Casting Industry Suppliers Association, International
-
Trade Centre, World Trade Centre, Government Websites, Press Releases, Journals,
-
Annual Reports, Whitepapers, Company Websites, and MRFR Analysis\r\nAsia-Pacific
-
dominated the market with a share of 55.71%, accounting for 5,819.05 kilo tons in
-
; it is expected to register the highest CAGR of 6.15% from 2021 to 2030. Europe
-
was the second-largest with a share of 17.18% in 2020, sized at 1,794.17 kilo tons;
-
it is projected to exhibit a CAGR of 5.03%.\r\n8.5 EQUIPMENT & MACHINE\r\nThe
-
equipment and machine segment held a market share of 14.50% in 2020 and is projected
-
to be valued at USD 75,545.73 million by the end of 2030. The metal cast products
-
for the industry include housings, valves, housing cover, compressor rear frame,
-
impellers, spinners, hydraulic cylinder parts, cast iron supports for elevators,
-
agricultural machinery brackets, pump bodies, and machine tools.\r\n8.5.1
-
EQUIPMENT & MACHINE: MARKET ESTIMATES & FORECAST BY REGION,2022-2030\r\nTABLE
-
EQUIPMENT & MACHINE MARKET ESTIMATES & FORECAST, BY REGION, 2022-2030
-
(USD MILLION)\r\nRegion 2019 2020 2021 2030 CAGR (2022-2030)\r\nNorth
-
America 5,366.92 4,977.58 5,194.46 9,734.99 7.23%\r\nEurope 7,060.06 6,527.88
-
,791.23 12,353.55 6.87%\r\nAsia-Pacific 21,723.44 20,328.96 21,406.18 43,531.83
-
%\r\nLatin America 2,367.96 2,204.64 2,309.63 4,487.54 7.66%\r\nMiddle
-
East & Africa 2,811.96 2,622.79 2,752.71 5,437.82 7.86%\r\nTotal 39,330.34
-
,661.85 38,454.21 75,545.73 7.79%\r\nSource: Indiana Cast Metal Association
-
(INCMA), American Foundry Society (AFS), The North American Die Casting Association,
-
NON-FERROUS FOUNDERS’ SOCIETY, Aluminium Casters’ Association of India,
-
Casting Industry Suppliers Association, International Trade Centre, World Trade
-
Centre, Government Websites, Press Releases, Journals, Annual Reports, Whitepapers,
-
Company Websites, and MRFR Analysis\r\nAsia-Pacific accounted for the largest
-
market share of 55.45% in 2020, with a market value of USD 20,329.0 million; it
-
is expected to register the highest CAGR of 8.21% during the forecast period. Europe
-
accounted for the second largest market share in 2020, valued at USD 6,527.9 million;
-
it is projected to exhibit a CAGR of 6.87%.\r\nTABLE 62 EQUIPMENT & MACHINE
-
MARKET ESTIMATES & FORECAST, BY REGION, 2022-2030 (KILO TONS)\r\nRegion
-
2020 2021 2030 CAGR (2022-2030)\r\nNorth America 2,038.01 1,875.76 1,935.38
-
,262.17 5.97%\r\nEurope 2,604.05 2,389.38 2,457.64 4,020.19 5.62%\r\nAsia-Pacific
-
,074.39 8,427.31 8,773.70 16,048.96 6.94%\r\nLatin America 954.52 881.90
-
1,595.93 6.40%\r\nMiddle East & Africa 1,109.64 1,027.06 1,065.71
-
,892.67 6.59%\r\nTotal 15,780.61 14,601.41 15,145.87 26,819.93 6.55%\r\nSource:
-
Indiana Cast Metal Association (INCMA), American Foundry Society (AFS), The North
-
American Die Casting Association, NON-FERROUS FOUNDERS’ SOCIETY, Aluminium
-
Casters’ Association of India, Casting Industry Suppliers Association, International
-
Trade Centre, World Trade Centre, Government Websites, Press Releases, Journals,
-
Annual Reports, Whitepapers, Company Websites, and MRFR Analysis\r\nAsia-Pacific
-
dominated the market with a share of 57.72%, accounting for 8,427.31 kilo tons in
-
; it is expected to register the highest CAGR of 6.94% from 2021 to 2030. Europe
-
was the second-largest with a share of 16.36% in 2020, sized at 2,389.38 kilo tons;
-
it is projected to exhibit a CAGR of 5.62%.\r\nTABLE 63 METAL CASTING MARKET
-
ESTIMATES & FORECAST, BY EQUIPMENT & MACHINE, 2022-2030\r\n(USD MILLION)\r\nEquipment
-
& Machine 2019 2020 2021 2030 CAGR (2022-2030)\r\nPumps & Valves
-
,197.03 20,655.56 21,628.23 41,833.50 7.61%\r\nOthers 17,133.31 16,006.28
-
,825.98 33,712.23 8.03%\r\nTotal 39,330.34 36,661.85 38,454.21 75,545.73
-
%\r\nSource: Indiana Cast Metal Association (INCMA), American Foundry
-
Society (AFS), The North American Die Casting Association, NON-FERROUS FOUNDERS’
-
SOCIETY, Aluminium Casters’ Association of India, Casting Industry Suppliers
-
Association, International Trade Centre, World Trade Centre, Government Websites,
-
Press Releases, Journals, Annual Reports, Whitepapers, Company Websites, and MRFR
-
Analysis\r\nThe pumps & valves segment accounted for a larger market
-
share of 56.34% in 2020, with a market value of USD 20,655.6 million; it is expected
-
to register a CAGR of 7.61% during the forecast period. The Others segment was valued
-
at USD 16,006.3 million; it is projected to register a higher CAGR of 8.03%.\r\n \r\nTABLE
-
METAL CASTING MARKET ESTIMATES & FORECAST, BY EQUIPMENT & MACHINE, 2022-2030\r\n(KILO
-
TONS)\r\nEquipment & Machine 2019 2020 2021 2030 CAGR (2022-2030)\r\nPumps
-
& Valves 8,999.65 8,312.91 8,608.10 15,007.66 6.37%\r\nOthers 6,780.96
-
,288.50 6,537.77 11,812.27 6.79%\r\nTotal 15,780.61 14,601.41 15,145.87
-
,819.93 6.55%\r\nSource: Indiana Cast Metal Association (INCMA), American
-
Foundry Society (AFS), The North American Die Casting Association, NON-FERROUS FOUNDERS’
-
SOCIETY, Aluminium Casters’ Association of India, Casting Industry Suppliers
-
Association, International Trade Centre, World Trade Centre, Government Websites,
-
Press Releases, Journals, Annual Reports, Whitepapers, Company Websites, and MRFR
-
Analysis\r\nThe pumps & valves segment dominated the market with a share
-
of 56.93%, accounting for 8,312.91 kilo tons in 2020; it is projected to exhibit
-
a CAGR of 6.37%. The Others segment accounted for a share of 43.07% in 2020, sized
-
at 6,288.50 kilo tons; it is projected to exhibit a higher CAGR of 6.79%.\r\n8.5.2
-
PUMPS & VALVES\r\nTABLE 65 PUMPS & VALVES MARKET ESTIMATES &
-
FORECAST, BY REGION, 2022-2030 (USD MILLION)\r\nRegion 2019 2020 2021 2030
-
CAGR (2022-2030)\r\nNorth America 3,004.89 2,781.89 2,897.88 5,342.82 7.03%\r\nEurope
-
,947.28 3,643.16 3,783.29 6,769.96 6.68%\r\nAsia-Pacific 12,342.82 11,530.81
-
,121.08 24,270.01 8.02%\r\nLatin America 1,340.87 1,246.19 1,303.23 2,491.84
-
%\r\nMiddle East & Africa 1,561.17 1,453.51 1,522.74 2,958.87 7.66%\r\nTotal
-
,197.03 20,655.56 21,628.23 41,833.50 7.61%\r\nSource: Indiana Cast Metal
-
Association (INCMA), American Foundry Society (AFS), The North American Die Casting
-
Association, NON-FERROUS FOUNDERS’ SOCIETY, Aluminium Casters’ Association
-
of India, Casting Industry Suppliers Association, International Trade Centre, World
-
Trade Centre, Government Websites, Press Releases, Journals, Annual Reports, Whitepapers,
-
Company Websites, and MRFR Analysis\r\nAsia-Pacific accounted for the largest
-
market share of 55.82% in 2020, with a market value of USD 11,530.8 million; it
-
is expected to register the highest CAGR of 8.02% during the forecast period. Europe
-
accounted for the second largest market share in 2020, valued at USD 3,643.2 million;
-
it is projected to exhibit a CAGR of 6.68%.\r\n \r\nTABLE 66
-
PUMPS & VALVES MARKET ESTIMATES & FORECAST, BY REGION, 2022-2030 (KILO TONS)\r\nRegion
-
2020 2021 2030 CAGR (2022-2030)\r\nNorth America 1,152.56 1,058.90 1,090.58
-
,808.40 5.78%\r\nEurope 1,470.66 1,346.99 1,382.98 2,225.43 5.43%\r\nAsia-Pacific
-
,208.13 4,828.50 5,018.38 9,038.34 6.76%\r\nLatin America 545.91 503.48
-
895.05 6.21%\r\nMiddle East & Africa 622.39 575.03 595.59 1,040.43
-
%\r\nTotal 8,999.65 8,312.91 8,608.10 15,007.66 6.37%\r\nSource:
-
Indiana Cast Metal Association (INCMA), American Foundry Society (AFS), The North
-
American Die Casting Association, NON-FERROUS FOUNDERS’ SOCIETY, Aluminium
-
Casters’ Association of India, Casting Industry Suppliers Association, International
-
Trade Centre, World Trade Centre, Government Websites, Press Releases, Journals,
-
Annual Reports, Whitepapers, Company Websites, and MRFR Analysis\r\nAsia-Pacific
-
dominated the market with a share of 58.08%, accounting for 4,828.50 kilo tons in
-
; it is expected to register the highest CAGR of 6.76% from 2021 to 2030. Europe
-
was the second-largest with a share of 16.20% in 2020, sized at 1,346.99 kilo tons;
-
it is projected to exhibit a CAGR of 5.43%.\r\n8.5.3 OTHERS\r\nTABLE
-
OTHERS MARKET ESTIMATES & FORECAST, BY REGION, 2022-2030 (USD MILLION)\r\nRegion
-
2020 2021 2030 CAGR (2022-2030)\r\nNorth America 2,362.03 2,195.68 2,296.58
-
,392.17 7.47%\r\nEurope 3,112.78 2,884.72 3,007.94 5,583.59 7.11%\r\nAsia-Pacific
-
,380.62 8,798.15 9,285.10 19,261.82 8.45%\r\nLatin America 1,027.09 958.45
-
,006.40 1,995.70 7.90%\r\nMiddle East & Africa 1,250.78 1,169.28 1,229.97
-
,478.95 8.10%\r\nTotal 17,133.31 16,006.28 16,825.98 33,712.23 8.03%\r\nSource:
-
Indiana Cast Metal Association (INCMA), American Foundry Society (AFS), The North
-
American Die Casting Association, NON-FERROUS FOUNDERS’ SOCIETY, Aluminium
-
Casters’ Association of India, Casting Industry Suppliers Association, International
-
Trade Centre, World Trade Centre, Government Websites, Press Releases, Journals,
-
Annual Reports, Whitepapers, Company Websites, and MRFR Analysis\r\nAsia-Pacific
-
accounted for the largest market share of 54.97% in 2020, with a market value of
-
USD 8,798.2 million; it is expected to register the highest CAGR of 8.45% during
-
the forecast period. Europe accounted for the second largest market share in 2020,
-
valued at USD 2,884.7 million; it is projected to exhibit a CAGR of 7.11%.\r\n \r\nTABLE
-
OTHERS MARKET ESTIMATES & FORECAST, BY REGION, 2022-2030 (KILO TONS)\r\nRegion
-
2020 2021 2030 CAGR (2022-2030)\r\nNorth America 885.45 816.87 844.79
-
,453.77 6.22%\r\nEurope 1,133.39 1,042.38 1,074.67 1,794.76 5.86%\r\nAsia-Pacific
-
,866.26 3,598.81 3,755.32 7,010.62 7.18%\r\nLatin America 408.62 378.42
-
700.89 6.64%\r\nMiddle East & Africa 487.25 452.03 470.12 852.23
-
%\r\nTotal 6,780.96 6,288.50 6,537.77 11,812.27 6.79%\r\nSource:
-
Indiana Cast Metal Association (INCMA), American Foundry Society (AFS), The North
-
American Die Casting Association, NON-FERROUS FOUNDERS’ SOCIETY, Aluminium
-
Casters’ Association of India, Casting Industry Suppliers Association, International
-
Trade Centre, World Trade Centre, Government Websites, Press Releases, Journals,
-
Annual Reports, Whitepapers, Company Websites, and MRFR Analysis\r\nAsia-Pacific
-
dominated the market with a share of 57.23%, accounting for 3,598.81 kilo tons in
-
; it is expected to register the highest CAGR of 7.18% from 2021 to 2030. Europe
-
was the second-largest with a share of 16.58% in 2020, sized at 1,042.38 kilo tons;
-
it is projected to exhibit a CAGR of 5.86%.\r\n8.6 CONSUMER GOODS\r\nConsumer
-
electronic components are among the most complicated parts to be manufactured using
-
die casting and require high accuracy and excellent surface finishes and coatings.
-
Bezel for smartwatches, camera chassis, camera housings, coupling on consumer printer,
-
covers are the major consumer goods manufactured through die casting. The growing
-
consumer electronics market and high precision achieved through the metal casting
-
process are likely to favor the market growth in the years to follow\r\n8.6.1
-
CONSUMER GOODS: MARKET ESTIMATES & FORECAST BY REGION,2022-2030\r\nTABLE
-
CONSUMER GOODS MARKET ESTIMATES & FORECAST, BY REGION, 2022-2030 (USD MILLION)\r\nRegion
-
2020 2021 2030 CAGR (2022-2030)\r\nNorth America 3,950.06 3,650.77 3,796.57
-
,892.72 6.85%\r\nEurope 4,732.00 4,360.49 4,521.01 7,972.89 6.51%\r\nAsia-Pacific
-
,979.17 15,839.93 16,627.41 32,870.05 7.87%\r\nLatin America 1,615.67 1,498.53
-
,563.92 2,935.13 7.25%\r\nMiddle East & Africa 1,846.69 1,715.11 1,792.38
-
,404.96 7.39%\r\nTotal 29,123.58 27,064.83 28,301.30 54,075.74 7.46%\r\nSource:
-
Indiana Cast Metal Association (INCMA), American Foundry Society (AFS), The North
-
American Die Casting Association, NON-FERROUS FOUNDERS’ SOCIETY, Aluminium
-
Casters’ Association of India, Casting Industry Suppliers Association, International
-
Trade Centre, World Trade Centre, Government Websites, Press Releases, Journals,
-
Annual Reports, Whitepapers, Company Websites, and MRFR Analysis\r\nAsia-Pacific
-
accounted for the largest market share of 58.53% in 2020, with a market value of
-
USD 15,839.9 million; it is expected to register the highest CAGR of 7.87% during
-
the forecast period. Europe accounted for the second largest market share in 2020,
-
valued at USD 4,360.5 million; it is projected to exhibit a CAGR of 6.51%.\r\nTABLE
-
CONSUMER GOODS MARKET ESTIMATES & FORECAST, BY REGION, 2022-2030 (KILO TONS)\r\nRegion
-
2020 2021 2030 CAGR (2022-2030)\r\nNorth America 1,469.83 1,348.12 1,386.11
-
,263.30 5.60%\r\nEurope 1,710.23 1,563.93 1,603.15 2,542.34 5.26%\r\nAsia-Pacific
-
,952.94 6,437.09 6,680.84 11,879.64 6.60%\r\nLatin America 637.83 587.07
-
1,022.28 5.99%\r\nMiddle East & Africa 714.73 658.71 680.58 1,162.33
-
%\r\nTotal 11,485.55 10,594.92 10,956.44 18,869.88 6.23%\r\nSource:
-
Indiana Cast Metal Association (INCMA), American Foundry Society (AFS), The North
-
American Die Casting Association, NON-FERROUS FOUNDERS’ SOCIETY, Aluminium
-
Casters’ Association of India, Casting Industry Suppliers Association, International
-
Trade Centre, World Trade Centre, Government Websites, Press Releases, Journals,
-
Annual Reports, Whitepapers, Company Websites, and MRFR Analysis\r\nAsia-Pacific
-
dominated the market with a share of 60.76%, accounting for 6,437.09 kilo tons in
-
; it is expected to register the highest CAGR of 6.60% from 2021 to 2030. Europe
-
was the second-largest with a share of 14.76% in 2020, sized at 1,563.93 kilo tons;
-
it is projected to exhibit a CAGR of 5.26%.\r\n8.7 OTHERS\r\nThe others
-
segment includes the medical and food & beverage industries\r\n8.7.1
-
OTHERS: MARKET ESTIMATES & FORECAST BY REGION,2022-2030\r\nTABLE 71 OTHERS
-
MARKET ESTIMATES & FORECAST, BY REGION, 2022-2030 (USD MILLION)\r\nRegion
-
2020 2021 2030 CAGR (2022-2030)\r\nNorth America 1,791.43 1,645.17 1,699.86
-
,900.85 6.12%\r\nEurope 2,530.34 2,319.52 2,392.21 4,010.36 5.91%\r\nAsia-Pacific
-
,996.62 8,349.85 8,719.47 16,407.96 7.28%\r\nLatin America 822.20 758.60
-
1,404.95 6.64%\r\nMiddle East & Africa 1,276.57 1,181.77 1,230.95
-
,266.70 7.02%\r\nTotal 15,417.15 14,254.89 14,830.00 26,990.82 6.88%\r\nSource:
-
Indiana Cast Metal Association (INCMA), American Foundry Society (AFS), The North
-
American Die Casting Association, NON-FERROUS FOUNDERS’ SOCIETY, Aluminium
-
Casters’ Association of India, Casting Industry Suppliers Association, International
-
Trade Centre, World Trade Centre, Government Websites, Press Releases, Journals,
-
Annual Reports, Whitepapers, Company Websites, and MRFR Analysis\r\nAsia-Pacific
-
accounted for the largest market share of 58.58% in 2020, with a market value of
-
USD 8,349.8 million; it is expected to register the highest CAGR of 7.28% during
-
the forecast period. Europe accounted for the second largest market share in 2020,
-
valued at USD 2,319.5 million; it is projected to exhibit a CAGR of 5.91%.\r\nTABLE
-
OTHERS MARKET ESTIMATES & FORECAST, BY REGION, 2022-2030 (KILO TONS)\r\nRegion
-
2020 2021 2030 CAGR (2022-2030)\r\nNorth America 671.03 609.44 620.39
-
4.46%\r\nEurope 911.73 827.04 840.88 1,231.88 4.33%\r\nAsia-Pacific
-
,696.23 3,394.77 3,494.91 5,748.19 5.68%\r\nLatin America 323.83 295.54
-
469.34 5.01%\r\nMiddle East & Africa 493.64 452.30 464.56 749.50
-
%\r\nTotal 6,096.45 5,579.09 5,723.08 9,117.68 5.31%\r\nSource:
-
Indiana Cast Metal Association (INCMA), American Foundry Society (AFS), The North
-
American Die Casting Association, NON-FERROUS FOUNDERS’ SOCIETY, Aluminium
-
Casters’ Association of India, Casting Industry Suppliers Association, International
-
Trade Centre, World Trade Centre, Government Websites, Press Releases, Journals,
-
Annual Reports, Whitepapers, Company Websites, and MRFR Analysis\r\nAsia-Pacific
-
dominated the market with a share of 60.85%, accounting for 3,394.77 kilo tons in
-
; it is expected to register the highest CAGR of 5.68% from 2021 to 2030. Europe
-
was the second-largest with a share of 14.82% in 2020, sized at 827.04 kilo tons;
-
it is projected to exhibit a CAGR of 4.33%.\r\n9 GLOBAL METAL CASTING MARKET,\r\nBY
-
REGION\r\n9.1 OVERVIEW\r\nBased on region, the global metal castings
-
market has been divided into Asia-Pacific, Europe, North America, Latin America,
-
and the Middle East & Africa. Asia-Pacific accounted for the largest market
-
share of 56.63% in 2020, with a market value of USD 143,182.72 million, and is projected
-
to record the highest CAGR of 8.16% during the forecast period. Asia-Pacific has
-
been segmented into China, India, Japan, South Korea, Australia & New Zealand,
-
and the rest of Asia-Pacific. The high growth in the region is attributed to rapid
-
population growth, urbanization, and factors such as the presence of a large number
-
of producers, cheap labor costs, and growing application segments in the region.
-
China was the largest producer and consumer of metal casting in 2020. India has
-
also witnessed a rapid increase in consumption over the past few years. Moreover,
-
increasing capacity addition in Southeast Asia, including Singapore and Thailand,
-
South Korea, and China, is likely to project a positive outlook for the growth of
-
the Asia-Pacific market.\r\nThe market in Europe accounted for the second-largest
-
market share of 17.02% in 2020 and is anticipated to rise at a considerable rate
-
with a CAGR of 6.84% over the forecast period. The European market has been segmented
-
into Germany, the UK, France, Spain, Italy, Russia, and the rest of Europe. The
-
growth in this region is attributed to the large-scale production of motor vehicles,
-
and the sector represents the largest private investor in research and development
-
(R&D).\r\nNorth America accounted for the 13.59% share of the global
-
metal casting market in 2020 and is expected to register a CAGR of 7.18% during
-
the forecast period and reach a market value of USD 66,851.44 million by 2030. The
-
North American market has been divided into the US and Canada. The US is the second-largest
-
consumer of Metal Casting, followed by China. The growth in the US is due to the
-
presence of large-scale end-use industries, extensive technological and R&D
-
capabilities, and widespread production facilities. Henceforth, the US is expected
-
to drive regional growth during the assessment period. Moreover, Latin America and
-
Middle East & Africa accounted for merely a single-digit market share of around
-
% and 7.07%, respectively.\r\nFIGURE 21 GLOBAL METAL CASTING MARKET,
-
BY REGION, 2022-2030 (USD MILLION)\r\nSource: Indiana Cast Metal Association
-
(INCMA), American Foundry Society (AFS), The North American Die Casting Association,
-
NON-FERROUS FOUNDERS’ SOCIETY, Aluminium Casters’ Association of India,
-
Casting Industry Suppliers Association, International Trade Centre, World Trade
-
Centre, Government Websites, Press Releases, Journals, Annual Reports, Whitepapers,
-
Company Websites, and MRFR Analysis\r\nTABLE 73 GLOBAL METAL CASTING MARKET,
-
BY REGION, 2022-2030 (USD MILLION)\r\nRegion 2019 2020 2021 2030 CAGR (2022-2030)\r\nNorth
-
America 37,057.02 34,351.61 35,830.57 66,851.44 7.18%\r\nEurope 46,551.42
-
,029.76 44,752.52 81,191.68 6.84%\r\nAsia-Pacific 153,076.59 143,182.72
-
,698.81 305,171.55 8.16%\r\nLatin America 15,456.52 14,381.23 15,056.41
-
,086.65 7.59%\r\nMiddle East & Africa 19,174.17 17,872.02 18,744.49
-
,802.28 7.78%\r\nTotal 271,315.72 252,817.33 265,082.81 519,103.59 7.75%\r\nSource:
-
Indiana Cast Metal Association (INCMA), American Foundry Society (AFS), The North
-
American Die Casting Association, NON-FERROUS FOUNDERS’ SOCIETY, Aluminium
-
Casters’ Association of India, Casting Industry Suppliers Association, International
-
Trade Centre, World Trade Centre, Government Websites, Press Releases, Journals,
-
Annual Reports, Whitepapers, Company Websites, and MRFR Analysis\r\nAsia-Pacific
-
accounted for the largest market share of 56.63% in 2020, with a market value of
-
USD 143,182.7 million; it is expected to register the highest CAGR of 8.16% during
-
the forecast period. Europe accounted for the second largest market share in 2020,
-
valued at USD 43,029.8 million; it is projected to exhibit a CAGR of 6.84%.\r\nFIGURE
-
GLOBAL METAL CASTING MARKET, BY REGION, 2022-2030 (KILO TONS)\r\nSource:
-
Indiana Cast Metal Association (INCMA), American Foundry Society (AFS), The North
-
American Die Casting Association, NON-FERROUS FOUNDERS’ SOCIETY, Aluminium
-
Casters’ Association of India, Casting Industry Suppliers Association, International
-
Trade Centre, World Trade Centre, Government Websites, Press Releases, Journals,
-
Annual Reports, Whitepapers, Company Websites, and MRFR Analysis\r\n \r\nTABLE
-
GLOBAL METAL CASTING MARKET, BY REGION, 2022-2030 (KILO TONS)\r\nRegion
-
2020 2021 2030 CAGR (2022-2030)\r\nNorth America 14,165.61 13,029.92
-
,435.81 22,522.93 5.91%\r\nEurope 17,270.95 15,841.01 16,287.24 26,549.50
-
%\r\nAsia-Pacific 64,357.43 59,733.32 62,152.35 113,096.95 6.88%\r\nLatin
-
America 6,266.44 5,785.32 5,987.70 10,391.13 6.32%\r\nMiddle East & Africa
-
,612.60 7,040.44 7,299.53 12,871.14 6.50%\r\nTotal 109,673.03 101,430.00
-
,162.62 185,431.66 6.50%\r\nSource: Indiana Cast Metal Association (INCMA),
-
American Foundry Society (AFS), The North American Die Casting Association, NON-FERROUS
-
FOUNDERS’ SOCIETY, Aluminium Casters’ Association of India, Casting
-
Industry Suppliers Association, International Trade Centre, World Trade Centre,
-
Government Websites, Press Releases, Journals, Annual Reports, Whitepapers, Company
-
Websites, and MRFR Analysis\r\nAsia-Pacific dominated the market with a share
-
of 58.89%, accounting for 59,733.32 kilo tons in 2020; it is expected to register
-
the highest CAGR of 6.88% from 2021 to 2030. Europe was the second-largest with
-
a share of 15.62% in 2020, sized at 15,841.01 kilo tons; it is projected to exhibit
-
a CAGR of 5.58%.\r\n \r\n9.2 NORTH AMERICA\r\nFIGURE 23
-
NORTH AMERICA: METAL CASTING MARKET SHARE, BY COUNTRY, 2020 (% SHARE)\r\nSource:
-
Indiana Cast Metal Association (INCMA), American Foundry Society (AFS), The North
-
American Die Casting Association, NON-FERROUS FOUNDERS’ SOCIETY, Aluminium
-
Casters’ Association of India, Casting Industry Suppliers Association, International
-
Trade Centre, World Trade Centre, Government Websites, Press Releases, Journals,
-
Annual Reports, Whitepapers, Company Websites, and MRFR Analysis\r\nTABLE
-
NORTH AMERICA: METAL CASTING MARKET, BY COUNTRY, 2022-2030 (USD MILLION)\r\nCountry
-
2020 2021 2030 CAGR (2022-2030)\r\nUS 30,868.92 28,644.60 29,908.44
-
,315.66 7.28%\r\nCanada 6,188.10 5,707.01 5,922.13 10,535.78 6.61%\r\nTotal
-
,057.02 34,351.61 35,830.57 66,851.44 7.18%\r\nSource: Indiana Cast Metal
-
Association (INCMA), American Foundry Society (AFS), The North American Die Casting
-
Association, NON-FERROUS FOUNDERS’ SOCIETY, Aluminium Casters’ Association
-
of India, Casting Industry Suppliers Association, International Trade Centre, World
-
Trade Centre, Government Websites, Press Releases, Journals, Annual Reports, Whitepapers,
-
Company Websites, and MRFR Analysis\r\nThe US market accounted for a larger
-
market share of 83.39% in 2020, with a market value of USD 28,644.6 million; it
-
is expected to register a higher CAGR of 7.28% during the forecast period. Canada
-
market accounted for a market share of USD 5,707.0 million; in 2020, it is projected
-
to exhibit a CAGR of 6.61%.\r\nTABLE 76 NORTH AMERICA: METAL CASTING MARKET,
-
BY COUNTRY, 2022-2030 (KILO TONS)\r\nCountry 2019 2020 2021 2030 CAGR (2022-2030)\r\nUS
-
,812.12 10,876.19 11,226.41 18,991.54 6.02%\r\nCanada 2,353.49 2,153.73
-
,209.39 3,531.39 5.35%\r\nTotal 14,165.61 13,029.92 13,435.81 22,522.93
-
%\r\nSource: Indiana Cast Metal Association (INCMA), American Foundry
-
Society (AFS), The North American Die Casting Association, NON-FERROUS FOUNDERS’
-
SOCIETY, Aluminium Casters’ Association of India, Casting Industry Suppliers
-
Association, International Trade Centre, World Trade Centre, Government Websites,
-
Press Releases, Journals, Annual Reports, Whitepapers, Company Websites, and MRFR
-
Analysis\r\nThe US market dominated the market with a share of 83.47%, accounting
-
for 10,876.19 kilo tons in 2020; it is expected to register a higher CAGR of 6.02%
-
from 2021 to 2030. Canada market had a share of 16.53% in 2020, sized at 2,153.73
-
kilo tons; it is projected to exhibit a CAGR of 5.35%.\r\nTABLE 77 NORTH
-
AMERICA: METAL CASTING MARKET, BY MATERIAL TYPE, 2022-2030 (USD MILLION)\r\nMaterial
-
Type 2019 2020 2021 2030 CAGR (2022-2030)\r\nCast Iron 19,245.30 17,780.88
-
,484.49 33,449.03 6.81%\r\nAluminium 7,906.35 7,407.81 7,808.79 15,945.55
-
%\r\nStainless Steel 3,838.75 3,590.94 3,779.37 7,618.87 8.10%\r\nZinc
-
,169.90 1,087.81 1,138.10 2,181.44 7.50%\r\nMagnesium 827.06 765.04 796.27
-
,456.98 6.94%\r\nCarbon Steel 681.73 625.19 645.05 1,085.13 5.95%\r\nHigh
-
Steel Alloy 939.73 866.45 898.89 1,595.48 6.58%\r\nOthers 2,448.19 2,227.47
-
,279.60 3,518.95 4.94%\r\nTotal 37,057.02 34,351.61 35,830.57 66,851.44
-
%\r\nSource: Indiana Cast Metal Association (INCMA), American Foundry
-
Society (AFS), The North American Die Casting Association, NON-FERROUS FOUNDERS’
-
SOCIETY, Aluminium Casters’ Association of India, Casting Industry Suppliers
-
Association, International Trade Centre, World Trade Centre, Government Websites,
-
Press Releases, Journals, Annual Reports, Whitepapers, Company Websites, and MRFR
-
Analysis\r\nThe cast iron segment accounted for the largest market share
-
of 51.76% in 2020, with a market value of USD 17,780.9 million; it is expected to
-
register a CAGR of 6.81% during the forecast period. The aluminium segment accounted
-
for the second largest market share in 2020, valued at USD 7,407.8 million; it is
-
projected to register the highest CAGR of 8.26%.\r\nTABLE 78 NORTH AMERICA:
-
METAL CASTING MARKET, BY MATERIAL TYPE, 2022-2030 (KILO TONS)\r\nMaterial
-
Type 2019 2020 2021 2030 CAGR (2022-2030)\r\nCast Iron 7,462.67 6,842.30
-
,032.67 11,445.68 5.56%\r\nAluminium 3,002.56 2,791.80 2,909.67 5,343.73
-
%\r\nStainless Steel 1,386.41 1,287.03 1,339.26 2,428.18 6.83%\r\nZinc
-
401.65 415.47 716.23 6.24%\r\nMagnesium 305.84 280.75 288.91 475.44
-
%\r\nCarbon Steel 263.01 239.36 244.17 369.43 4.71%\r\nHigh Steel
-
Alloy 360.55 329.90 338.38 540.18 5.33%\r\nOthers 949.28 857.12 867.27 1,204.07
-
%\r\nTotal 14,165.61 13,029.92 13,435.81 22,522.93 5.91%\r\nSource:
-
Indiana Cast Metal Association (INCMA), American Foundry Society (AFS), The North
-
American Die Casting Association, NON-FERROUS FOUNDERS’ SOCIETY, Aluminium
-
Casters’ Association of India, Casting Industry Suppliers Association, International
-
Trade Centre, World Trade Centre, Government Websites, Press Releases, Journals,
-
Annual Reports, Whitepapers, Company Websites, and MRFR Analysis\r\nThe cast
-
iron segment dominated the market with a share of 52.51%, accounting for 6,842.30
-
kilo tons in 2020; it is projected to exhibit a CAGR of 5.56%. The aluminium segment
-
was the second-largest with a share of 21.43% in 2020, sized at 2,791.80 kilo tons;
-
it is projected to exhibit the highest CAGR of 6.99%.\r\nTABLE 79 NORTH AMERICA:
-
METAL CASTING MARKET, BY PROCESS TYPE, 2022-2030 (USD MILLION)\r\nProcess
-
Type 2019 2020 2021 2030 CAGR (2022-2030)\r\nSand Casting 18,350.72 17,055.13
-
,835.44 34,048.73 7.45%\r\nDie Casting 8,665.86 8,087.93 8,493.22 16,803.66
-
%\r\nShell Mold Casting 2,656.85 2,448.82 2,539.58 4,492.19 6.54%\r\nGravity
-
Casting 2,124.10 1,922.77 1,957.31 2,842.73 4.23%\r\nVacuum Casting 1,317.99
-
,199.90 1,228.76 1,910.11 5.02%\r\nInvestment Casting 2,087.09 1,931.11
-
,010.48 3,687.89 6.97%\r\nOthers 1,854.40 1,705.95 1,765.78 3,066.12 6.32%\r\nTotal
-
,057.02 34,351.61 35,830.57 66,851.44 7.18%\r\nSource: Indiana Cast Metal
-
Association (INCMA), American Foundry Society (AFS), The North American Die Casting
-
Association, NON-FERROUS FOUNDERS’ SOCIETY, Aluminium Casters’ Association
-
of India, Casting Industry Suppliers Association, International Trade Centre, World
-
Trade Centre, Government Websites, Press Releases, Journals, Annual Reports, Whitepapers,
-
Company Websites, and MRFR Analysis\r\nThe sand casting segment accounted
-
for the largest market share of 49.65% in 2020, with a market value of USD 17,055.1
-
million; it is expected to register a CAGR of 7.45% during the forecast period.
-
The die casting segment accounted for the second largest market share in 2020, valued
-
at USD 8,087.9 million; it is projected to register the highest CAGR of 7.88%.\r\nTABLE
-
NORTH AMERICA: METAL CASTING MARKET, BY PROCESS TYPE, 2022-2030 (KILO TONS)\r\nProcess
-
Type 2019 2020 2021 2030 CAGR (2022-2030)\r\nSand Casting 7,268.59 6,703.95
-
,931.45 11,901.09 6.19%\r\nDie Casting 3,291.13 3,048.24 3,164.82 5,631.50
-
%\r\nShell Mold Casting 1,030.13 942.23 966.11 1,536.98 5.29%\r\nGravity
-
Casting 782.58 703.01 707.55 924.26 3.01%\r\nVacuum Casting 476.03 430.07
-
608.80 3.79%\r\nInvestment Casting 776.65 713.13 734.05 1,211.01 5.72%\r\nOthers
-
489.28 496.38 709.29 4.05%\r\nTotal 14,165.61 13,029.92 13,435.81
-
,522.93 5.91%\r\nSource: Indiana Cast Metal Association (INCMA), American
-
Foundry Society (AFS), The North American Die Casting Association, NON-FERROUS FOUNDERS’
-
SOCIETY, Aluminium Casters’ Association of India, Casting Industry Suppliers
-
Association, International Trade Centre, World Trade Centre, Government Websites,
-
Press Releases, Journals, Annual Reports, Whitepapers, Company Websites, and MRFR
-
Analysis\r\nThe sand casting segment dominated the market with a share of
-
%, accounting for 6,703.95 kilo tons in 2020; it is projected to exhibit a
-
CAGR of 6.19%. The die casting segment was the second-largest with a share of 23.39%
-
in 2020, sized at 3,048.24 kilo tons; it is projected to exhibit the highest CAGR
-
of 6.61%.\r\nTABLE 81 NORTH AMERICA: METAL CASTING MARKET, BY END-USE INDUSTRY,
-
2030 (USD MILLION)\r\nEnd-use Industry 2019 2020 2021 2030 CAGR (2022-2030)\r\nAutomotive
-
& Transportation 15,575.89 14,491.89 15,171.24 29,235.55 7.56%\r\nBuilding
-
& Construction 6,114.61 5,660.52 5,896.21 10,866.59 7.03%\r\nMining 4,258.11
-
,925.69 4,072.22 7,220.74 6.57%\r\nEquipment & Machine 5,366.92 4,977.58
-
,194.46 9,734.99 7.23%\r\nConsumer Goods 3,950.06 3,650.77 3,796.57 6,892.72
-
%\r\nOthers 1,791.43 1,645.17 1,699.86 2,900.85 6.12%\r\nTotal
-
,057.02 34,351.61 35,830.57 66,851.44 7.18%\r\nSource: Indiana Cast Metal
-
Association (INCMA), American Foundry Society (AFS), The North American Die Casting
-
Association, NON-FERROUS FOUNDERS’ SOCIETY, Aluminium Casters’ Association
-
of India, Casting Industry Suppliers Association, International Trade Centre, World
-
Trade Centre, Government Websites, Press Releases, Journals, Annual Reports, Whitepapers,
-
Company Websites, and MRFR Analysis\r\nThe automotive & transportation
-
segment accounted for the largest market share of 42.19% in 2020, with a market
-
value of USD 14,491.9 million; it is expected to register the highest CAGR of 7.56%
-
during the forecast period. The building & construction segment accounted for
-
the second largest market share in 2020, valued at USD 5,660.5 million; it is projected
-
to exhibit a CAGR of 7.03%.\r\nTABLE 82 NORTH AMERICA: METAL CASTING MARKET,
-
BY END-USE INDUSTRY, 2022-2030 (KILO TONS)\r\nEnd-use Industry 2019 2020
-
2030 CAGR (2022-2030)\r\nAutomotive & Transportation 6,039.98 5,576.82
-
,772.27 10,004.17 6.30%\r\nBuilding & Construction 2,346.23 2,155.45
-
,219.83 3,679.46 5.78%\r\nMining 1,600.53 1,464.33 1,501.83 2,395.06 5.32%\r\nEquipment
-
& Machine 2,038.01 1,875.76 1,935.38 3,262.17 5.97%\r\nConsumer Goods
-
,469.83 1,348.12 1,386.11 2,263.30 5.60%\r\nOthers 671.03 609.44 620.39
-
4.46%\r\nTotal 14,165.61 13,029.92 13,435.81 22,522.93 5.91%\r\nSource:
-
Indiana Cast Metal Association (INCMA), American Foundry Society (AFS), The North
-
American Die Casting Association, NON-FERROUS FOUNDERS’ SOCIETY, Aluminium
-
Casters’ Association of India, Casting Industry Suppliers Association, International
-
Trade Centre, World Trade Centre, Government Websites, Press Releases, Journals,
-
Annual Reports, Whitepapers, Company Websites, and MRFR Analysis\r\nThe automotive
-
& transportation segment dominated the market with a share of 42.80%, accounting
-
for 5,576.82 kilo tons in 2020; it is expected to register the highest CAGR of 6.30%
-
from 2021 to 2030. The building & construction segment was the second-largest
-
with a share of 16.54% in 2020, sized at 2,155.45 kilo tons; it is projected to
-
exhibit a CAGR of 5.78%.\r\n \r\nTABLE 83 NORTH AMERICA: METAL
-
CASTING MARKET, BY AUTOMOTIVE & TRANSPORTATION, 2022-2030\r\n(USD MILLION)\r\nAutomotive
-
& Transportation 2019 2020 2021 2030 CAGR (2022-2030)\r\nGearbox 2,783.02
-
,611.38 2,756.87 5,712.77 8.43%\r\nWheels 1,787.33 1,671.55 1,758.91 3,545.70
-
%\r\nEngine Blocks 2,236.32 2,083.43 2,183.96 4,258.32 7.70%\r\nCylinder
-
Head 3,591.82 3,320.70 3,454.23 6,272.52 6.85%\r\nExhaust Manifold 963.89
-
929.82 1,713.50 7.03%\r\nSeat Frame 1,167.18 1,084.48 1,133.78 2,158.15
-
%\r\nOthers 3,046.32 2,827.86 2,953.67 5,574.61 7.31%\r\nTotal
-
,575.89 14,491.89 15,171.24 29,235.55 7.56%\r\nSource: Indiana Cast Metal
-
Association (INCMA), American Foundry Society (AFS), The North American Die Casting
-
Association, NON-FERROUS FOUNDERS’ SOCIETY, Aluminium Casters’ Association
-
of India, Casting Industry Suppliers Association, International Trade Centre, World
-
Trade Centre, Government Websites, Press Releases, Journals, Annual Reports, Whitepapers,
-
Company Websites, and MRFR Analysis\r\nThe cylinder head segment accounted
-
for the largest market share of 22.91% in 2020, with a market value of USD 3,320.7
-
million; it is expected to register a CAGR of 6.85% during the forecast period.
-
The gearbox segment accounted for the second largest market share in 2020, valued
-
at USD 2,611.4 million; it is projected to register the highest CAGR of 8.43%.\r\nTABLE
-
NORTH AMERICA: METAL CASTING MARKET, BY AUTOMOTIVE & TRANSPORTATION, 2022-2030\r\n(KILO
-
TONS)\r\nAutomotive & Transportation 2019 2020 2021 2030 CAGR (2022-2030)\r\nGearbox
-
,136.00 1,057.81 1,104.13 2,057.76 7.16%\r\nWheels 707.27 656.41 682.91
-
,238.13 6.83%\r\nEngine Blocks 903.31 835.14 865.55 1,517.85 6.44%\r\nCylinder
-
Head 1,435.88 1,317.38 1,354.87 2,212.75 5.60%\r\nExhaust Manifold 377.55
-
357.34 592.26 5.77%\r\nSeat Frame 452.60 417.33 431.37 738.49 6.16%\r\nOthers
-
,027.38 945.83 976.10 1,646.94 5.98%\r\nTotal 6,039.98 5,576.82 5,772.27
-
,004.17 6.30%\r\nSource: Indiana Cast Metal Association (INCMA), American
-
Foundry Society (AFS), The North American Die Casting Association, NON-FERROUS FOUNDERS’
-
SOCIETY, Aluminium Casters’ Association of India, Casting Industry Suppliers
-
Association, International Trade Centre, World Trade Centre, Government Websites,
-
Press Releases, Journals, Annual Reports, Whitepapers, Company Websites, and MRFR
-
Analysis\r\nThe cylinder head segment dominated the market with a share of
-
%, accounting for 1,317.38 kilo tons in 2020; it is projected to exhibit a
-
CAGR of 5.60%. The Gearbox segment was the second-largest with a share of 18.97%
-
in 2020, sized at 1,057.81 kilo tons; it is projected to exhibit the highest CAGR
-
of 7.16%.\r\nTABLE 85 NORTH AMERICA: METAL CASTING MARKET, BY EQUIPMENT &
-
MACHINE, 2022-2030 (USD MILLION)\r\nEquipment & Machine 2019 2020 2021
-
CAGR (2022-2030)\r\nPumps & Valves 3,004.89 2,781.89 2,897.88 5,342.82
-
%\r\nOthers 2,362.03 2,195.68 2,296.58 4,392.17 7.47%\r\nTotal
-
,366.92 4,977.58 5,194.46 9,734.99 7.23%\r\nSource: Indiana Cast Metal Association
-
(INCMA), American Foundry Society (AFS), The North American Die Casting Association,
-
NON-FERROUS FOUNDERS’ SOCIETY, Aluminium Casters’ Association of India,
-
Casting Industry Suppliers Association, International Trade Centre, World Trade
-
Centre, Government Websites, Press Releases, Journals, Annual Reports, Whitepapers,
-
Company Websites, and MRFR Analysis\r\nThe pumps & valves segment accounted
-
for a larger market share of 55.89% in 2020, with a market value of USD 2,781.9
-
million; it is expected to register a CAGR of 7.03% during the forecast period.
-
The Others segment was valued at USD 2,195.7 million; it is projected to register
-
a higher CAGR of 7.47%.\r\nTABLE 86 NORTH AMERICA: METAL CASTING MARKET,
-
BY EQUIPMENT & MACHINE, 2022-2030 (KILO TONS)\r\nEquipment & Machine
-
2020 2021 2030 CAGR (2022-2030)\r\nPumps & Valves 1,152.56 1,058.90
-
,090.58 1,808.40 5.78%\r\nOthers 885.45 816.87 844.79 1,453.77 6.22%\r\nTotal
-
,038.01 1,875.76 1,935.38 3,262.17 5.97%\r\nSource: Indiana Cast Metal Association
-
(INCMA), American Foundry Society (AFS), The North American Die Casting Association,
-
NON-FERROUS FOUNDERS’ SOCIETY, Aluminium Casters’ Association of India,
-
Casting Industry Suppliers Association, International Trade Centre, World Trade
-
Centre, Government Websites, Press Releases, Journals, Annual Reports, Whitepapers,
-
Company Websites, and MRFR Analysis\r\nThe pumps & valves segment dominated
-
the market with a share of 56.45%, accounting for 1,058.90 kilo tons in 2020; it
-
is projected to exhibit a CAGR of 5.78%. The Others segment accounted for a share
-
of 43.55% in 2020, sized at 816.87 kilo tons; it is projected to exhibit a higher
-
CAGR of 6.22%.\r\n \r\n9.2.1 US\r\nTABLE 87 US: METAL
-
CASTING MARKET, BY MATERIAL TYPE, 2022-2030 (USD MILLION)\r\nMaterial Type
-
2020 2021 2030 CAGR (2022-2030)\r\nCast Iron 16,065.81 14,858.47 15,462.18
-
,236.35 6.92%\r\nAluminium 6,583.80 6,175.01 6,515.96 13,428.63 8.37%\r\nStainless
-
Steel 3,219.48 3,014.44 3,175.57 6,455.55 8.20%\r\nZinc 958.78 892.53 934.88
-
,810.54 7.62%\r\nMagnesium 665.62 616.41 642.29 1,187.24 7.06%\r\nCarbon
-
Steel 587.36 539.30 557.11 947.60 6.08%\r\nHigh Steel Alloy 761.51 702.85
-
1,307.40 6.69%\r\nOthers 2,026.57 1,845.60 1,890.55 2,942.35 5.04%\r\nTotal
-
,868.92 28,644.60 29,908.44 56,315.66 7.28%\r\nSource: Indiana Cast Metal
-
Association (INCMA), American Foundry Society (AFS), The North American Die Casting
-
Association, NON-FERROUS FOUNDERS’ SOCIETY, Aluminium Casters’ Association
-
of India, Casting Industry Suppliers Association, International Trade Centre, World
-
Trade Centre, Government Websites, Press Releases, Journals, Annual Reports, Whitepapers,
-
Company Websites, and MRFR Analysis\r\nThe cast iron segment accounted for
-
the largest market share of 51.87% in 2020, with a market value of USD 14,858.5
-
million; it is expected to register a CAGR of 6.92% during the forecast period.
-
The aluminium segment accounted for the second largest market share in 2020, valued
-
at USD 6,175.0 million; it is projected to register the highest CAGR of 8.37%.\r\nTABLE
-
US: METAL CASTING MARKET, BY MATERIAL TYPE, 2022-2030 (KILO TONS)\r\nMaterial
-
Type 2019 2020 2021 2030 CAGR (2022-2030)\r\nCast Iron 6,235.97 5,723.37
-
,888.58 9,671.05 5.67%\r\nAluminium 2,502.82 2,329.52 2,430.36 4,504.52
-
%\r\nStainless Steel 1,163.88 1,081.45 1,126.38 2,059.31 6.93%\r\nZinc
-
329.91 341.65 595.06 6.36%\r\nMagnesium 246.43 226.47 233.31 387.85
-
%\r\nCarbon Steel 226.79 206.65 211.06 322.86 4.84%\r\nHigh Steel
-
Alloy 292.50 267.91 275.08 443.13 5.44%\r\nOthers 786.61 710.91 719.99 1,007.76
-
%\r\nTotal 11,812.12 10,876.19 11,226.41 18,991.54 6.02%\r\nSource:
-
Indiana Cast Metal Association (INCMA), American Foundry Society (AFS), The North
-
American Die Casting Association, NON-FERROUS FOUNDERS’ SOCIETY, Aluminium
-
Casters’ Association of India, Casting Industry Suppliers Association, International
-
Trade Centre, World Trade Centre, Government Websites, Press Releases, Journals,
-
Annual Reports, Whitepapers, Company Websites, and MRFR Analysis\r\nThe cast
-
iron segment dominated the market with a share of 52.62%, accounting for 5,723.37
-
kilo tons in 2020; it is projected to exhibit a CAGR of 5.67%. The aluminium segment
-
was the second-largest with a share of 21.42% in 2020, sized at 2,329.52 kilo tons;
-
it is projected to exhibit the highest CAGR of 7.10%.\r\nTABLE 89 US: METAL
-
CASTING MARKET, BY PROCESS TYPE, 2022-2030 (USD MILLION)\r\nProcess Type
-
2020 2021 2030 CAGR (2022-2030)\r\nSand Casting 15,224.81 14,164.86
-
,828.56 28,576.82 7.56%\r\nDie Casting 7,275.15 6,796.29 7,143.51 14,252.38
-
%\r\nShell Mold Casting 2,170.00 2,002.11 2,078.42 3,709.94 6.65%\r\nGravity
-
Casting 1,821.77 1,651.67 1,684.01 2,484.76 4.42%\r\nVacuum Casting 1,112.91
-
,014.41 1,040.06 1,634.89 5.15%\r\nInvestment Casting 1,762.18 1,632.08
-
,700.82 3,147.28 7.08%\r\nOthers 1,502.11 1,383.19 1,433.06 2,509.60 6.42%\r\nTotal
-
,868.92 28,644.60 29,908.44 56,315.66 7.28%\r\nSource: Indiana Cast Metal
-
Association (INCMA), American Foundry Society (AFS), The North American Die Casting
-
Association, NON-FERROUS FOUNDERS’ SOCIETY, Aluminium Casters’ Association
-
of India, Casting Industry Suppliers Association, International Trade Centre, World
-
Trade Centre, Government Websites, Press Releases, Journals, Annual Reports, Whitepapers,
-
Company Websites, and MRFR Analysis\r\nThe sand casting segment accounted
-
for the largest market share of 49.45% in 2020, with a market value of USD 14,164.9
-
million; it is expected to register a CAGR of 7.56% during the forecast period.
-
The die casting segment accounted for the second largest market share in 2020, valued
-
at USD 6,796.3 million; it is projected to register the highest CAGR of 7.98%.\r\nTABLE
-
US: METAL CASTING MARKET, BY PROCESS TYPE, 2022-2030 (KILO TONS)\r\nProcess
-
Type 2019 2020 2021 2030 CAGR (2022-2030)\r\nSand Casting 6,036.62 5,573.53
-
,768.72 9,998.15 6.30%\r\nDie Casting 2,765.63 2,563.90 2,664.42 4,780.84
-
%\r\nShell Mold Casting 842.29 771.20 791.54 1,270.67 5.40%\r\nGravity
-
Casting 671.77 604.40 609.27 808.49 3.19%\r\nVacuum Casting 402.33 363.93
-
521.53 3.92%\r\nInvestment Casting 656.36 603.26 621.57 1,034.40 5.82%\r\nOthers
-
395.97 401.98 577.47 4.11%\r\nTotal 11,812.12 10,876.19 11,226.41
-
,991.54 6.02%\r\nSource: Indiana Cast Metal Association (INCMA), American
-
Foundry Society (AFS), The North American Die Casting Association, NON-FERROUS FOUNDERS’
-
SOCIETY, Aluminium Casters’ Association of India, Casting Industry Suppliers
-
Association, International Trade Centre, World Trade Centre, Government Websites,
-
Press Releases, Journals, Annual Reports, Whitepapers, Company Websites, and MRFR
-
Analysis\r\nThe sand casting segment dominated the market with a share of
-
%, accounting for 5,573.53 kilo tons in 2020; it is projected to exhibit a
-
CAGR of 6.30%. The die casting segment was the second-largest with a share of 23.57%
-
in 2020, sized at 2,563.90 kilo tons; it is projected to exhibit the highest CAGR
-
of 6.71%.\r\n \r\nTABLE 91 US: METAL CASTING MARKET, BY END-USE
-
INDUSTRY, 2022-2030 (USD MILLION)\r\nEnd-use Industry 2019 2020 2021 2030
-
CAGR (2022-2030)\r\nAutomotive & Transportation 13,080.22 12,181.50 12,764.69
-
,809.16 7.66%\r\nBuilding & Construction 5,058.72 4,687.96 4,888.29
-
,094.13 7.14%\r\nMining 3,520.07 3,248.58 3,373.28 6,036.34 6.68%\r\nEquipment
-
& Machine 4,397.27 4,082.84 4,265.51 8,074.47 7.35%\r\nConsumer Goods
-
,306.50 3,059.07 3,184.46 5,834.04 6.96%\r\nOthers 1,506.15 1,384.65 1,432.20
-
,467.53 6.23%\r\nTotal 30,868.92 28,644.60 29,908.44 56,315.66 7.28%\r\nSource:
-
Indiana Cast Metal Association (INCMA), American Foundry Society (AFS), The North
-
American Die Casting Association, NON-FERROUS FOUNDERS’ SOCIETY, Aluminium
-
Casters’ Association of India, Casting Industry Suppliers Association, International
-
Trade Centre, World Trade Centre, Government Websites, Press Releases, Journals,
-
Annual Reports, Whitepapers, Company Websites, and MRFR Analysis\r\nThe automotive
-
& transportation segment accounted for the largest market share of 42.53% in
-
, with a market value of USD 12,181.5 million; it is expected to register the
-
highest CAGR of 7.66% during the forecast period. The building & construction
-
segment accounted for the second largest market share in 2020, valued at USD 4,688.0
-
million; it is projected to exhibit a CAGR of 7.14%.\r\nTABLE 92 US: METAL
-
CASTING MARKET, BY END-USE INDUSTRY, 2022-2030 (KILO TONS)\r\nEnd-use Industry
-
2020 2021 2030 CAGR (2022-2030)\r\nAutomotive & Transportation 5,077.10
-
,692.22 4,861.28 8,497.22 6.40%\r\nBuilding & Construction 1,943.09
-
,786.96 1,842.25 3,082.33 5.89%\r\nMining 1,324.49 1,213.02 1,245.35 2,004.18
-
%\r\nEquipment & Machine 1,671.61 1,540.25 1,590.97 2,708.51 6.09%\r\nConsumer
-
Goods 1,231.57 1,130.72 1,163.76 1,917.44 5.70%\r\nOthers 564.25 513.02 522.80
-
4.57%\r\nTotal 11,812.12 10,876.19 11,226.41 18,991.54 6.02%\r\nSource:
-
Indiana Cast Metal Association (INCMA), American Foundry Society (AFS), The North
-
American Die Casting Association, NON-FERROUS FOUNDERS’ SOCIETY, Aluminium
-
Casters’ Association of India, Casting Industry Suppliers Association, International
-
Trade Centre, World Trade Centre, Government Websites, Press Releases, Journals,
-
Annual Reports, Whitepapers, Company Websites, and MRFR Analysis\r\nThe automotive
-
& transportation segment dominated the market with a share of 43.14%, accounting
-
for 4,692.22 kilo tons in 2020; it is expected to register the highest CAGR of 6.40%
-
from 2021 to 2030. The building & construction segment was the second-largest
-
with a share of 16.43% in 2020, sized at 1,786.96 kilo tons; it is projected to
-
exhibit a CAGR of 5.89%.\r\n \r\nTABLE 93 US: METAL CASTING MARKET,
-
BY AUTOMOTIVE & TRANSPORTATION, 2022-2030 (USD MILLION)\r\nAutomotive
-
& Transportation 2019 2020 2021 2030 CAGR (2022-2030)\r\nGearbox 2,339.45
-
,197.22 2,321.82 4,852.02 8.53%\r\nWheels 1,515.80 1,418.81 1,494.25 3,035.47
-
%\r\nEngine Blocks 1,870.27 1,744.11 1,830.06 3,599.73 7.81%\r\nCylinder
-
Head 3,005.62 2,781.39 2,895.97 5,303.67 6.95%\r\nExhaust Manifold 807.90
-
780.83 1,451.28 7.13%\r\nSeat Frame 976.38 908.08 950.27 1,824.60
-
%\r\nOthers 2,564.80 2,383.12 2,491.49 4,742.38 7.41%\r\nTotal
-
,080.22 12,181.50 12,764.69 24,809.16 7.66%\r\nSource: Indiana Cast Metal
-
Association (INCMA), American Foundry Society (AFS), The North American Die Casting
-
Association, NON-FERROUS FOUNDERS’ SOCIETY, Aluminium Casters’ Association
-
of India, Casting Industry Suppliers Association, International Trade Centre, World
-
Trade Centre, Government Websites, Press Releases, Journals, Annual Reports, Whitepapers,
-
Company Websites, and MRFR Analysis\r\nThe cylinder head segment accounted
-
for the largest market share of 22.83% in 2020, with a market value of USD 2,781.4
-
million; it is expected to register a CAGR of 6.95% during the forecast period.
-
The gearbox segment accounted for the second largest market share in 2020, valued
-
at USD 2,197.2 million; it is projected to register the highest CAGR of 8.53%.\r\nTABLE
-
US: METAL CASTING MARKET, BY AUTOMOTIVE & TRANSPORTATION, 2022-2030 (KILO
-
TONS)\r\nAutomotive & Transportation 2019 2020 2021 2030 CAGR (2022-2030)\r\nGearbox
-
890.90 930.78 1,749.30 7.26%\r\nWheels 600.37 557.67 580.68 1,060.88
-
%\r\nEngine Blocks 756.20 699.81 726.00 1,284.29 6.54%\r\nCylinder
-
Head 1,202.72 1,104.50 1,137.01 1,872.71 5.70%\r\nExhaust Manifold 316.75
-
300.37 502.09 5.87%\r\nSeat Frame 378.98 349.78 361.90 624.93 6.26%\r\nOthers
-
798.22 824.55 1,403.03 6.08%\r\nTotal 5,077.10 4,692.22 4,861.28 8,497.22
-
%\r\nSource: Indiana Cast Metal Association (INCMA), American Foundry
-
Society (AFS), The North American Die Casting Association, NON-FERROUS FOUNDERS’
-
SOCIETY, Aluminium Casters’ Association of India, Casting Industry Suppliers
-
Association, International Trade Centre, World Trade Centre, Government Websites,
-
Press Releases, Journals, Annual Reports, Whitepapers, Company Websites, and MRFR
-
Analysis\r\nThe cylinder head segment dominated the market with a share of
-
%, accounting for 1,104.50 kilo tons in 2020; it is projected to exhibit a
-
CAGR of 5.70%. The Gearbox segment was the second-largest with a share of 18.99%
-
in 2020, sized at 890.90 kilo tons; it is projected to exhibit the highest CAGR
-
of 7.26%.\r\n \r\nTABLE 95 US: METAL CASTING MARKET, BY EQUIPMENT
-
& MACHINE, 2022-2030 (USD MILLION)\r\nEquipment & Machine 2019 2020
-
2030 CAGR (2022-2030)\r\nPumps & Valves 2,448.29 2,269.18 2,366.49
-
,407.74 7.16%\r\nOthers 1,948.97 1,813.65 1,899.02 3,666.73 7.58%\r\nTotal
-
,397.27 4,082.84 4,265.51 8,074.47 7.35%\r\nSource: Indiana Cast Metal Association
-
(INCMA), American Foundry Society (AFS), The North American Die Casting Association,
-
NON-FERROUS FOUNDERS’ SOCIETY, Aluminium Casters’ Association of India,
-
Casting Industry Suppliers Association, International Trade Centre, World Trade
-
Centre, Government Websites, Press Releases, Journals, Annual Reports, Whitepapers,
-
Company Websites, and MRFR Analysis\r\nThe pumps & valves segment accounted
-
for a larger market share of 55.58% in 2020, with a market value of USD 2,269.2
-
million; it is expected to register a CAGR of 7.16% during the forecast period.
-
The Others segment was valued at USD 1,813.7 million; it is projected to register
-
a higher CAGR of 7.58%.\r\nTABLE 96 US: METAL CASTING MARKET, BY EQUIPMENT
-
& MACHINE, 2022-2030 (KILO TONS)\r\nEquipment & Machine 2019 2020
-
2030 CAGR (2022-2030)\r\nPumps & Valves 940.12 864.70 891.58 1,493.47
-
%\r\nOthers 731.50 675.55 699.39 1,215.04 6.33%\r\nTotal 1,671.61
-
,540.25 1,590.97 2,708.51 6.09%\r\nSource: Indiana Cast Metal Association
-
(INCMA), American Foundry Society (AFS), The North American Die Casting Association,
-
NON-FERROUS FOUNDERS’ SOCIETY, Aluminium Casters’ Association of India,
-
Casting Industry Suppliers Association, International Trade Centre, World Trade
-
Centre, Government Websites, Press Releases, Journals, Annual Reports, Whitepapers,
-
Company Websites, and MRFR Analysis\r\nThe pumps & valves segment dominated
-
the market with a share of 56.14%, accounting for 864.70 kilo tons in 2020; it is
-
projected to exhibit a CAGR of 5.90%. The Others segment accounted for a share of
-
% in 2020, sized at 675.55 kilo tons; it is projected to exhibit a higher CAGR
-
of 6.33%.\r\n \r\n9.2.2 CANADA\r\nTABLE 97 CANADA: METAL
-
CASTING MARKET, BY MATERIAL TYPE, 2022-2030 (USD MILLION)\r\nMaterial Type
-
2020 2021 2030 CAGR (2022-2030)\r\nCast Iron 3,179.49 2,922.41 3,022.31
-
,212.68 6.24%\r\nAluminium 1,322.55 1,232.80 1,292.84 2,516.93 7.68%\r\nStainless
-
Steel 619.27 576.50 603.80 1,163.32 7.56%\r\nZinc 211.13 195.28 203.22 370.90
-
%\r\nMagnesium 161.44 148.64 153.98 269.74 6.43%\r\nCarbon Steel
-
85.89 87.95 137.53 5.09%\r\nHigh Steel Alloy 178.22 163.61 168.99 288.07
-
%\r\nOthers 421.62 381.88 389.05 576.61 4.47%\r\nTotal 6,188.10
-
,707.01 5,922.13 10,535.78 6.61%\r\nSource: Indiana Cast Metal Association
-
(INCMA), American Foundry Society (AFS), The North American Die Casting Association,
-
NON-FERROUS FOUNDERS’ SOCIETY, Aluminium Casters’ Association of India,
-
Casting Industry Suppliers Association, International Trade Centre, World Trade
-
Centre, Government Websites, Press Releases, Journals, Annual Reports, Whitepapers,
-
Company Websites, and MRFR Analysis\r\nThe cast iron segment accounted for
-
the largest market share of 51.21% in 2020, with a market value of USD 2,922.4 million;
-
it is expected to register a CAGR of 6.24% during the forecast period. The aluminium
-
segment accounted for the second largest market share in 2020, valued at USD 1,232.8
-
million; it is projected to register the highest CAGR of 7.68%.\r\nTABLE
-
CANADA: METAL CASTING MARKET, BY MATERIAL TYPE, 2022-2030 (KILO TONS)\r\nMaterial
-
Type 2019 2020 2021 2030 CAGR (2022-2030)\r\nCast Iron 1,226.71 1,118.92
-
,144.09 1,774.63 5.00%\r\nAluminium 499.74 462.28 479.31 839.21 6.42%\r\nStainless
-
Steel 222.53 205.58 212.88 368.87 6.30%\r\nZinc 78.16 71.75 73.82 121.17
-
%\r\nMagnesium 59.41 54.28 55.60 87.59 5.18%\r\nCarbon Steel 36.22
-
33.12 46.58 3.86%\r\nHigh Steel Alloy 68.05 61.99 63.30 97.05 4.86%\r\nOthers
-
146.21 147.27 196.30 3.24%\r\nTotal 2,353.49 2,153.73 2,209.39 3,531.39
-
%\r\nSource: Indiana Cast Metal Association (INCMA), American Foundry
-
Society (AFS), The North American Die Casting Association, NON-FERROUS FOUNDERS’
-
SOCIETY, Aluminium Casters’ Association of India, Casting Industry Suppliers
-
Association, International Trade Centre, World Trade Centre, Government Websites,
-
Press Releases, Journals, Annual Reports, Whitepapers, Company Websites, and MRFR
-
Analysis\r\nThe cast iron segment dominated the market with a share of 51.95%,
-
accounting for 1,118.92 kilo tons in 2020; it is projected to exhibit a CAGR of
-
%. The aluminium segment was the second-largest with a share of 21.46% in 2020,
-
sized at 462.28 kilo tons; it is projected to exhibit the highest CAGR of 6.42%.\r\nTABLE
-
CANADA: METAL CASTING MARKET, BY PROCESS TYPE, 2022-2030 (USD MILLION)\r\nProcess
-
Type 2019 2020 2021 2030 CAGR (2022-2030)\r\nSand Casting 3,125.91 2,890.27
-
,006.88 5,471.91 6.88%\r\nDie Casting 1,390.72 1,291.64 1,349.71 2,551.28
-
%\r\nShell Mold Casting 486.86 446.71 461.16 782.25 6.05%\r\nGravity
-
Casting 302.34 271.10 273.30 357.98 3.04%\r\nVacuum Casting 205.08 185.49
-
275.23 4.28%\r\nInvestment Casting 324.91 299.03 309.66 540.61 6.39%\r\nOthers
-
322.77 332.72 556.52 5.88%\r\nTotal 6,188.10 5,707.01 5,922.13 10,535.78
-
%\r\nSource: Indiana Cast Metal Association (INCMA), American Foundry
-
Society (AFS), The North American Die Casting Association, NON-FERROUS FOUNDERS’
-
SOCIETY, Aluminium Casters’ Association of India, Casting Industry Suppliers
-
Association, International Trade Centre, World Trade Centre, Government Websites,
-
Press Releases, Journals, Annual Reports, Whitepapers, Company Websites, and MRFR
-
Analysis\r\nThe sand casting segment accounted for the largest market share
-
of 50.64% in 2020, with a market value of USD 2,890.3 million; it is expected to
-
register a CAGR of 6.88% during the forecast period. The die casting segment accounted
-
for the second largest market share in 2020, valued at USD 1,291.6 million; it is
-
projected to register the highest CAGR of 7.33%.\r\nTABLE 100 CANADA: METAL
-
CASTING MARKET, BY PROCESS TYPE, 2022-2030 (KILO TONS)\r\nProcess Type 2019
-
2021 2030 CAGR (2022-2030)\r\nSand Casting 1,231.97 1,130.42 1,162.73
-
,902.94 5.63%\r\nDie Casting 525.50 484.34 500.40 850.66 6.07%\r\nShell
-
Mold Casting 187.84 171.03 174.57 266.31 4.80%\r\nGravity Casting 110.81
-
98.29 115.78 1.84%\r\nVacuum Casting 73.69 66.15 66.53 87.27 3.06%\r\nInvestment
-
Casting 120.29 109.86 112.48 176.61 5.14%\r\nOthers 103.38 93.31 94.40 131.81
-
%\r\nTotal 2,353.49 2,153.73 2,209.39 3,531.39 5.35%\r\nSource:
-
Indiana Cast Metal Association (INCMA), American Foundry Society (AFS), The North
-
American Die Casting Association, NON-FERROUS FOUNDERS’ SOCIETY, Aluminium
-
Casters’ Association of India, Casting Industry Suppliers Association, International
-
Trade Centre, World Trade Centre, Government Websites, Press Releases, Journals,
-
Annual Reports, Whitepapers, Company Websites, and MRFR Analysis\r\nThe sand
-
casting segment dominated the market with a share of 52.49%, accounting for 1,130.42
-
kilo tons in 2020; it is projected to exhibit a CAGR of 5.63%. The die casting segment
-
was the second-largest with a share of 22.49% in 2020, sized at 484.34 kilo tons;
-
it is projected to exhibit the highest CAGR of 6.07%.\r\n \r\nTABLE
-
CANADA: METAL CASTING MARKET, BY END-USE INDUSTRY, 2022-2030 (USD MILLION)\r\nEnd-use
-
Industry 2019 2020 2021 2030 CAGR (2022-2030)\r\nAutomotive & Transportation
-
,495.68 2,310.39 2,406.55 4,426.40 7.01%\r\nBuilding & Construction
-
,055.89 972.55 1,007.92 1,772.46 6.47%\r\nMining 738.05 677.11 698.94 1,184.40
-
%\r\nEquipment & Machine 969.65 894.74 928.96 1,660.52 6.67%\r\nConsumer
-
Goods 643.56 591.70 612.11 1,058.68 6.28%\r\nOthers 285.28 260.51 267.66
-
5.50%\r\nTotal 6,188.10 5,707.01 5,922.13 10,535.78 6.61%\r\nSource:
-
Indiana Cast Metal Association (INCMA), American Foundry Society (AFS), The North
-
American Die Casting Association, NON-FERROUS FOUNDERS’ SOCIETY, Aluminium
-
Casters’ Association of India, Casting Industry Suppliers Association, International
-
Trade Centre, World Trade Centre, Government Websites, Press Releases, Journals,
-
Annual Reports, Whitepapers, Company Websites, and MRFR Analysis\r\nThe automotive
-
& transportation segment accounted for the largest market share of 40.48% in
-
, with a market value of USD 2,310.4 million; it is expected to register the
-
highest CAGR of 7.01% during the forecast period. The building & construction
-
segment accounted for the second largest market share in 2020, valued at USD 972.6
-
million; it is projected to exhibit a CAGR of 6.47%.\r\nTABLE 102 CANADA:
-
METAL CASTING MARKET, BY END-USE INDUSTRY, 2022-2030 (KILO TONS)\r\nEnd-use
-
Industry 2019 2020 2021 2030 CAGR (2022-2030)\r\nAutomotive & Transportation
-
884.60 911.00 1,506.94 5.75%\r\nBuilding & Construction 403.14
-
377.57 597.14 5.23%\r\nMining 276.03 251.31 256.48 390.88 4.79%\r\nEquipment
-
& Machine 366.39 335.51 344.40 553.66 5.42%\r\nConsumer Goods 238.26
-
222.35 345.86 5.03%\r\nOthers 106.78 96.42 97.59 136.91 3.83%\r\nTotal
-
,353.49 2,153.73 2,209.39 3,531.39 5.35%\r\nSource: Indiana Cast Metal Association
-
(INCMA), American Foundry Society (AFS), The North American Die Casting Association,
-
NON-FERROUS FOUNDERS’ SOCIETY, Aluminium Casters’ Association of India,
-
Casting Industry Suppliers Association, International Trade Centre, World Trade
-
Centre, Government Websites, Press Releases, Journals, Annual Reports, Whitepapers,
-
Company Websites, and MRFR Analysis\r\nThe automotive & transportation
-
segment dominated the market with a share of 41.07%, accounting for 884.60 kilo
-
tons in 2020; it is expected to register the highest CAGR of 5.75% from 2021 to
-
The building & construction segment was the second-largest with a share
-
of 17.11% in 2020, sized at 368.49 kilo tons; it is projected to exhibit a CAGR
-
of 5.23%.\r\n \r\nTABLE 103 CANADA: METAL CASTING MARKET, BY
-
AUTOMOTIVE & TRANSPORTATION, 2022-2030 (USD MILLION)\r\nAutomotive &
-
Transportation 2019 2020 2021 2030 CAGR (2022-2030)\r\nGearbox 443.57 414.15
-
860.74 7.88%\r\nWheels 271.53 252.73 264.67 510.23 7.57%\r\nEngine
-
Blocks 366.05 339.32 353.90 658.58 7.14%\r\nCylinder Head 586.20 539.31 558.26
-
6.32%\r\nExhaust Manifold 155.99 143.73 148.99 262.22 6.48%\r\nSeat
-
Frame 190.81 176.41 183.51 333.55 6.86%\r\nOthers 481.52 444.74 462.17 832.23
-
%\r\nTotal 2,495.68 2,310.39 2,406.55 4,426.40 7.01%\r\nSource:
-
Indiana Cast Metal Association (INCMA), American Foundry Society (AFS), The North
-
American Die Casting Association, NON-FERROUS FOUNDERS’ SOCIETY, Aluminium
-
Casters’ Association of India, Casting Industry Suppliers Association, International
-
Trade Centre, World Trade Centre, Government Websites, Press Releases, Journals,
-
Annual Reports, Whitepapers, Company Websites, and MRFR Analysis\r\nThe cylinder
-
head segment accounted for the largest market share of 23.34% in 2020, with a market
-
value of USD 539.3 million; it is expected to register a CAGR of 6.32% during the
-
forecast period. The gearbox segment accounted for the second largest market share
-
in 2020, valued at USD 414.2 million; it is projected to register the highest CAGR
-
of 7.88%.\r\nTABLE 104 CANADA: METAL CASTING MARKET, BY AUTOMOTIVE &
-
TRANSPORTATION, 2022-2030 (KILO TONS)\r\nAutomotive & Transportation
-
2020 2021 2030 CAGR (2022-2030)\r\nGearbox 180.15 166.92 173.35 308.46
-
%\r\nWheels 106.90 98.74 102.23 177.25 6.31%\r\nEngine Blocks
-
135.33 139.55 233.55 5.89%\r\nCylinder Head 233.16 212.88 217.86 340.04
-
%\r\nExhaust Manifold 60.79 55.59 56.97 90.17 5.23%\r\nSeat Frame
-
67.54 69.47 113.55 5.61%\r\nOthers 161.15 147.60 151.55 243.92 5.43%\r\nTotal
-
884.60 911.00 1,506.94 5.75%\r\nSource: Indiana Cast Metal Association
-
(INCMA), American Foundry Society (AFS), The North American Die Casting Association,
-
NON-FERROUS FOUNDERS’ SOCIETY, Aluminium Casters’ Association of India,
-
Casting Industry Suppliers Association, International Trade Centre, World Trade
-
Centre, Government Websites, Press Releases, Journals, Annual Reports, Whitepapers,
-
Company Websites, and MRFR Analysis\r\nThe cylinder head segment dominated
-
the market with a share of 24.06%, accounting for 212.88 kilo tons in 2020; it is
-
projected to exhibit a CAGR of 5.07%. The Gearbox segment was the second-largest
-
with a share of 18.87% in 2020, sized at 166.92 kilo tons; it is projected to exhibit
-
the highest CAGR of 6.61%.\r\n \r\nTABLE 105 CANADA: METAL CASTING
-
MARKET, BY EQUIPMENT & MACHINE, 2022-2030 (USD MILLION)\r\nEquipment
-
& Machine 2019 2020 2021 2030 CAGR (2022-2030)\r\nPumps & Valves
-
512.71 531.40 935.08 6.48%\r\nOthers 413.06 382.03 397.56 725.44 6.91%\r\nTotal
-
894.74 928.96 1,660.52 6.67%\r\nSource: Indiana Cast Metal Association
-
(INCMA), American Foundry Society (AFS), The North American Die Casting Association,
-
NON-FERROUS FOUNDERS’ SOCIETY, Aluminium Casters’ Association of India,
-
Casting Industry Suppliers Association, International Trade Centre, World Trade
-
Centre, Government Websites, Press Releases, Journals, Annual Reports, Whitepapers,
-
Company Websites, and MRFR Analysis\r\nThe pumps & valves segment accounted
-
for a larger market share of 57.30% in 2020, with a market value of USD 512.7 million;
-
it is expected to register a CAGR of 6.48% during the forecast period. The Others
-
segment was valued at USD 382.0 million; it is projected to register a higher CAGR
-
of 6.91%.\r\nTABLE 106 CANADA: METAL CASTING MARKET, BY EQUIPMENT & MACHINE,
-
2030 (KILO TONS)\r\nEquipment & Machine 2019 2020 2021 2030 CAGR
-
(2022-2030)\r\nPumps & Valves 212.44 194.20 199.00 314.93 5.23%\r\nOthers
-
141.31 145.40 238.73 5.66%\r\nTotal 366.39 335.51 344.40 553.66 5.42%\r\nSource:
-
Indiana Cast Metal Association (INCMA), American Foundry Society (AFS), The North
-
American Die Casting Association, NON-FERROUS FOUNDERS’ SOCIETY, Aluminium
-
Casters’ Association of India, Casting Industry Suppliers Association, International
-
Trade Centre, World Trade Centre, Government Websites, Press Releases, Journals,
-
Annual Reports, Whitepapers, Company Websites, and MRFR Analysis\r\nThe pumps
-
& valves segment dominated the market with a share of 57.88%, accounting for
-
kilo tons in 2020; it is projected to exhibit a CAGR of 5.23%. The Others
-
segment accounted for a share of 42.12% in 2020, sized at 141.31 kilo tons; it is
-
projected to exhibit a higher CAGR of 5.66%.\r\n \r\n9.3 EUROPE\r\nFIGURE
-
EUROPE: METAL CASTING MARKET SHARE, BY COUNTRY, 2020 (% SHARE)\r\nSource:
-
Indiana Cast Metal Association (INCMA), American Foundry Society (AFS), The North
-
American Die Casting Association, NON-FERROUS FOUNDERS’ SOCIETY, Aluminium
-
Casters’ Association of India, Casting Industry Suppliers Association, International
-
Trade Centre, World Trade Centre, Government Websites, Press Releases, Journals,
-
Annual Reports, Whitepapers, Company Websites, and MRFR Analysis\r\nTABLE
-
EUROPE: METAL CASTING MARKET, BY COUNTRY, 2022-2030 (USD MILLION)\r\nCountry
-
2020 2021 2030 CAGR (2022-2030)\r\nGermany 14,037.62 13,048.30 13,646.26
-
,991.00 7.42%\r\nUK 3,730.19 3,427.04 3,542.44 6,070.91 6.17%\r\nFrance
-
,310.47 7,698.90 8,024.95 14,850.00 7.08%\r\nSpain 3,750.33 3,449.16 3,569.10
-
,178.82 6.29%\r\nItaly 4,366.07 4,053.02 4,233.22 7,972.85 7.29%\r\nRussia
-
,361.34 3,098.38 3,213.42 5,682.76 6.54%\r\nRest of Europe 8,995.40 8,254.96
-
,523.13 14,445.33 6.04%\r\nTotal 46,551.42 43,029.76 44,752.52 81,191.68
-
%\r\nSource: Indiana Cast Metal Association (INCMA), American Foundry
-
Society (AFS), The North American Die Casting Association, NON-FERROUS FOUNDERS’
-
SOCIETY, Aluminium Casters’ Association of India, Casting Industry Suppliers
-
Association, International Trade Centre, World Trade Centre, Government Websites,
-
Press Releases, Journals, Annual Reports, Whitepapers, Company Websites, and MRFR
-
Analysis\r\nGermany accounted for the largest market share of 30.32% in 2020,
-
with a market value of USD 13,048.3 million; the market is expected to register
-
the highest CAGR of 7.42% during the forecast period. Rest of Europe was the second-largest
-
market in 2020, valued at USD 8,255.0 million; the market is projected to exhibit
-
a CAGR of 6.04%.\r\n \r\nTABLE 108 EUROPE: METAL CASTING MARKET,
-
BY COUNTRY, 2022-2030 (KILO TONS)\r\nCountry 2019 2020 2021 2030 CAGR (2022-2030)\r\nGermany
-
,217.77 4,812.70 4,975.96 8,517.42 6.15%\r\nUK 1,418.92 1,293.52 1,321.82
-
,035.19 4.91%\r\nFrance 3,068.41 2,820.70 2,906.67 4,833.68 5.81%\r\nSpain
-
,370.25 1,250.47 1,279.18 1,989.58 5.03%\r\nItaly 1,608.62 1,481.77 1,530.03
-
,589.65 6.02%\r\nRussia 1,235.31 1,129.86 1,158.43 1,840.55 5.28%\r\nRest
-
of Europe 3,351.67 3,051.99 3,115.16 4,743.43 4.78%\r\nTotal 17,270.95 15,841.01
-
,287.24 26,549.50 5.58%\r\nSource: Indiana Cast Metal Association (INCMA),
-
American Foundry Society (AFS), The North American Die Casting Association, NON-FERROUS
-
FOUNDERS’ SOCIETY, Aluminium Casters’ Association of India, Casting
-
Industry Suppliers Association, International Trade Centre, World Trade Centre,
-
Government Websites, Press Releases, Journals, Annual Reports, Whitepapers, Company
-
Websites, and MRFR Analysis\r\nGermany market dominated with a share of 30.38%,
-
accounting for 4,812.70 kilo tons in 2020 and is projected to register the highest
-
CAGR of 6.15% from 2021 to 2030. The market in Rest of Europe was the second-largest
-
with a share of 19.27% in 2020, sized at 3,051.99 kilo tons; it is projected to
-
exhibit a CAGR of 4.78%.\r\nTABLE 109 EUROPE: METAL CASTING MARKET, BY MATERIAL
-
TYPE, 2022-2030 (USD MILLION)\r\nMaterial Type 2019 2020 2021 2030 CAGR (2022-2030)\r\nCast
-
Iron 23,933.45 22,049.63 22,856.28 40,224.91 6.48%\r\nAluminium 10,310.21
-
,626.23 10,111.41 19,968.55 7.85%\r\nStainless Steel 4,813.29 4,479.19 4,689.67
-
,008.54 7.52%\r\nZinc 1,832.43 1,698.37 1,771.11 3,290.66 7.13%\r\nMagnesium
-
,347.99 1,244.50 1,292.75 2,319.66 6.71%\r\nCarbon Steel 844.63 772.12 794.08
-
,294.60 5.58%\r\nHigh Steel Alloy 1,186.96 1,091.49 1,129.30 1,952.70 6.27%\r\nOthers
-
,282.46 2,068.22 2,107.92 3,132.07 4.50%\r\nTotal 46,551.42 43,029.76 44,752.52
-
,191.68 6.84%\r\nSource: Indiana Cast Metal Association (INCMA), American
-
Foundry Society (AFS), The North American Die Casting Association, NON-FERROUS FOUNDERS’
-
SOCIETY, Aluminium Casters’ Association of India, Casting Industry Suppliers
-
Association, International Trade Centre, World Trade Centre, Government Websites,
-
Press Releases, Journals, Annual Reports, Whitepapers, Company Websites, and MRFR
-
Analysis\r\nThe cast iron segment accounted for the largest market share
-
of 51.24% in 2020, with a market value of USD 22,049.6 million; it is expected to
-
register a CAGR of 6.48% during the forecast period. The aluminium segment accounted
-
for the second largest market share in 2020, valued at USD 9,626.2 million; it is
-
projected to register the highest CAGR of 7.85%.\r\nTABLE 110 EUROPE: METAL
-
CASTING MARKET, BY MATERIAL TYPE, 2022-2030 (KILO TONS)\r\nMaterial Type
-
2020 2021 2030 CAGR (2022-2030)\r\nCast Iron 9,015.01 8,242.04 8,446.88
-
,368.15 5.23%\r\nAluminium 3,802.90 3,523.51 3,659.22 6,498.45 6.59%\r\nStainless
-
Steel 1,688.68 1,559.47 1,614.28 2,788.58 6.26%\r\nZinc 661.92 608.81 627.71
-
,048.79 5.87%\r\nMagnesium 483.98 443.41 455.39 734.81 5.46%\r\nCarbon
-
Steel 316.43 287.05 291.88 427.90 4.34%\r\nHigh Steel Alloy 442.17 403.50
-
641.79 5.03%\r\nOthers 859.87 773.20 779.13 1,041.02 3.27%\r\nTotal
-
,270.95 15,841.01 16,287.24 26,549.50 5.58%\r\nSource: Indiana Cast Metal
-
Association (INCMA), American Foundry Society (AFS), The North American Die Casting
-
Association, NON-FERROUS FOUNDERS’ SOCIETY, Aluminium Casters’ Association
-
of India, Casting Industry Suppliers Association, International Trade Centre, World
-
Trade Centre, Government Websites, Press Releases, Journals, Annual Reports, Whitepapers,
-
Company Websites, and MRFR Analysis\r\nThe cast iron segment dominated the
-
market with a share of 52.03%, accounting for 8,242.04 kilo tons in 2020; it is
-
projected to exhibit a CAGR of 5.23%. The aluminium segment was the second-largest
-
with a share of 22.24% in 2020, sized at 3,523.51 kilo tons; it is projected to
-
exhibit the highest CAGR of 6.59%.\r\nTABLE 111 EUROPE: METAL CASTING MARKET,
-
BY PROCESS TYPE, 2022-2030 (USD MILLION)\r\nProcess Type 2019 2020 2021 2030
-
CAGR (2022-2030)\r\nSand Casting 23,485.21 21,762.56 22,690.08 42,085.60
-
%\r\nDie Casting 10,870.55 10,113.28 10,585.89 20,310.82 7.51%\r\nShell
-
Mold Casting 3,452.68 3,173.60 3,282.08 5,651.31 6.22%\r\nGravity Casting
-
,666.31 2,410.09 2,449.86 3,516.22 4.10%\r\nVacuum Casting 1,593.09 1,445.71
-
,475.65 2,221.44 4.65%\r\nInvestment Casting 2,701.96 2,493.32 2,588.75
-
,624.93 6.66%\r\nOthers 1,781.63 1,631.20 1,680.22 2,781.35 5.76%\r\nTotal
-
,551.42 43,029.76 44,752.52 81,191.68 6.84%\r\nSource: Indiana Cast Metal
-
Association (INCMA), American Foundry Society (AFS), The North American Die Casting
-
Association, NON-FERROUS FOUNDERS’ SOCIETY, Aluminium Casters’ Association
-
of India, Casting Industry Suppliers Association, International Trade Centre, World
-
Trade Centre, Government Websites, Press Releases, Journals, Annual Reports, Whitepapers,
-
Company Websites, and MRFR Analysis\r\nThe sand casting segment accounted
-
for the largest market share of 50.58% in 2020, with a market value of USD 21,762.6
-
million; it is expected to register a CAGR of 7.11% during the forecast period.
-
The die casting segment accounted for the second largest market share in 2020, valued
-
at USD 10,113.3 million; it is projected to register the highest CAGR of 7.51%.\r\nTABLE
-
EUROPE: METAL CASTING MARKET, BY PROCESS TYPE, 2022-2030 (KILO TONS)\r\nProcess
-
Type 2019 2020 2021 2030 CAGR (2022-2030)\r\nSand Casting 9,035.95 8,309.24
-
,565.34 14,286.42 5.85%\r\nDie Casting 4,010.94 3,703.03 3,832.21 6,611.86
-
%\r\nShell Mold Casting 1,300.62 1,186.37 1,213.04 1,878.28 4.98%\r\nGravity
-
Casting 953.13 854.95 859.21 1,108.80 2.87%\r\nVacuum Casting 558.39 502.86
-
686.88 3.42%\r\nInvestment Casting 976.51 894.23 917.95 1,474.76 5.41%\r\nOthers
-
390.33 392.04 502.49 2.80%\r\nTotal 17,270.95 15,841.01 16,287.24
-
,549.50 5.58%\r\nSource: Indiana Cast Metal Association (INCMA), American
-
Foundry Society (AFS), The North American Die Casting Association, NON-FERROUS FOUNDERS’
-
SOCIETY, Aluminium Casters’ Association of India, Casting Industry Suppliers
-
Association, International Trade Centre, World Trade Centre, Government Websites,
-
Press Releases, Journals, Annual Reports, Whitepapers, Company Websites, and MRFR
-
Analysis\r\nThe sand casting segment dominated the market with a share of
-
%, accounting for 8,309.24 kilo tons in 2020; it is projected to exhibit a
-
CAGR of 5.85%. The die casting segment was the second-largest with a share of 23.38%
-
in 2020, sized at 3,703.03 kilo tons; it is projected to exhibit the highest CAGR
-
of 6.25%.\r\nTABLE 113 EUROPE: METAL CASTING MARKET, BY END-USE INDUSTRY,
-
2030 (USD MILLION)\r\nEnd-use Industry 2019 2020 2021 2030 CAGR (2022-2030)\r\nAutomotive
-
& Transportation 18,834.70 17,475.80 18,244.08 34,218.45 7.24%\r\nBuilding
-
& Construction 8,007.69 7,392.60 7,678.91 13,773.76 6.71%\r\nMining 5,386.64
-
,953.46 5,125.08 8,862.66 6.27%\r\nEquipment & Machine 7,060.06 6,527.88
-
,791.23 12,353.55 6.87%\r\nConsumer Goods 4,732.00 4,360.49 4,521.01 7,972.89
-
%\r\nOthers 2,530.34 2,319.52 2,392.21 4,010.36 5.91%\r\nTotal
-
,551.42 43,029.76 44,752.52 81,191.68 6.84%\r\nSource: Indiana Cast Metal
-
Association (INCMA), American Foundry Society (AFS), The North American Die Casting
-
Association, NON-FERROUS FOUNDERS’ SOCIETY, Aluminium Casters’ Association
-
of India, Casting Industry Suppliers Association, International Trade Centre, World
-
Trade Centre, Government Websites, Press Releases, Journals, Annual Reports, Whitepapers,
-
Company Websites, and MRFR Analysis\r\nThe automotive & transportation
-
segment accounted for the largest market share of 40.61% in 2020, with a market
-
value of USD 17,475.8 million; it is expected to register the highest CAGR of 7.24%
-
during the forecast period. The building & construction segment accounted for
-
the second largest market share in 2020, valued at USD 7,392.6 million; it is projected
-
to exhibit a CAGR of 6.71%.\r\n \r\nTABLE 114 EUROPE: METAL CASTING
-
MARKET, BY END-USE INDUSTRY, 2022-2030 (KILO TONS)\r\nEnd-use Industry 2019
-
2021 2030 CAGR (2022-2030)\r\nAutomotive & Transportation 7,094.52
-
,532.41 6,742.41 11,371.95 5.98%\r\nBuilding & Construction 2,984.35
-
,734.09 2,807.84 4,529.08 5.46%\r\nMining 1,966.07 1,794.17 1,835.32 2,854.06
-
%\r\nEquipment & Machine 2,604.05 2,389.38 2,457.64 4,020.19 5.62%\r\nConsumer
-
Goods 1,710.23 1,563.93 1,603.15 2,542.34 5.26%\r\nOthers 911.73 827.04 840.88
-
,231.88 4.33%\r\nTotal 17,270.95 15,841.01 16,287.24 26,549.50 5.58%\r\nSource:
-
Indiana Cast Metal Association (INCMA), American Foundry Society (AFS), The North
-
American Die Casting Association, NON-FERROUS FOUNDERS’ SOCIETY, Aluminium
-
Casters’ Association of India, Casting Industry Suppliers Association, International
-
Trade Centre, World Trade Centre, Government Websites, Press Releases, Journals,
-
Annual Reports, Whitepapers, Company Websites, and MRFR Analysis\r\nThe automotive
-
& transportation segment dominated the market with a share of 41.24%, accounting
-
for 6,532.41 kilo tons in 2020; it is expected to register the highest CAGR of 5.98%
-
from 2021 to 2030. The building & construction segment was the second-largest
-
with a share of 17.26% in 2020, sized at 2,734.09 kilo tons; it is projected to
-
exhibit a CAGR of 5.46%.\r\nTABLE 115 EUROPE: METAL CASTING MARKET, BY AUTOMOTIVE
-
& TRANSPORTATION, 2022-2030 (USD MILLION)\r\nAutomotive & Transportation
-
2020 2021 2030 CAGR (2022-2030)\r\nGearbox 3,530.66 3,302.10 3,474.59
-
,978.12 8.06%\r\nWheels 2,084.22 1,944.77 2,041.67 4,021.76 7.82%\r\nEngine
-
Blocks 2,726.77 2,533.41 2,648.30 5,026.47 7.38%\r\nCylinder Head 4,378.47
-
,037.58 4,188.98 7,416.32 6.55%\r\nExhaust Manifold 1,223.05 1,129.55 1,173.72
-
,108.77 6.73%\r\nSeat Frame 1,547.24 1,433.68 1,494.70 2,769.43 7.09%\r\nOthers
-
,344.28 3,094.72 3,222.13 5,897.58 6.95%\r\nTotal 18,834.70 17,475.80 18,244.08
-
,218.45 7.24%\r\nSource: Indiana Cast Metal Association (INCMA), American
-
Foundry Society (AFS), The North American Die Casting Association, NON-FERROUS FOUNDERS’
-
SOCIETY, Aluminium Casters’ Association of India, Casting Industry Suppliers
-
Association, International Trade Centre, World Trade Centre, Government Websites,
-
Press Releases, Journals, Annual Reports, Whitepapers, Company Websites, and MRFR
-
Analysis\r\nThe cylinder head segment accounted for the largest market share
-
of 23.10% in 2020, with a market value of USD 4,037.6 million; it is expected to
-
register a CAGR of 6.55% during the forecast period. The gearbox segment accounted
-
for the second largest market share in 2020, valued at USD 3,302.1 million; it is
-
projected to register the highest CAGR of 8.06%.\r\n \r\nTABLE
-
EUROPE: METAL CASTING MARKET, BY AUTOMOTIVE & TRANSPORTATION, 2022-2030
-
(KILO TONS)\r\nAutomotive & Transportation 2019 2020 2021 2030 CAGR (2022-2030)\r\nGearbox
-
,399.94 1,299.31 1,351.71 2,441.17 6.79%\r\nWheels 801.06 741.76 769.90
-
,363.82 6.56%\r\nEngine Blocks 1,069.81 986.36 1,019.42 1,739.95 6.12%\r\nCylinder
-
Head 1,700.13 1,555.79 1,595.87 2,540.72 5.30%\r\nExhaust Manifold 465.38
-
438.18 707.93 5.47%\r\nSeat Frame 582.85 535.95 552.43 920.44 5.84%\r\nOthers
-
,075.36 986.72 1,014.89 1,657.92 5.60%\r\nTotal 7,094.52 6,532.41 6,742.41
-
,371.95 5.98%\r\nSource: Indiana Cast Metal Association (INCMA), American
-
Foundry Society (AFS), The North American Die Casting Association, NON-FERROUS FOUNDERS’
-
SOCIETY, Aluminium Casters’ Association of India, Casting Industry Suppliers
-
Association, International Trade Centre, World Trade Centre, Government Websites,
-
Press Releases, Journals, Annual Reports, Whitepapers, Company Websites, and MRFR
-
Analysis\r\nThe cylinder head segment dominated the market with a share of
-
%, accounting for 1,555.79 kilo tons in 2020; it is projected to exhibit a
-
CAGR of 5.30%. The Gearbox segment was the second-largest with a share of 19.89%
-
in 2020, sized at 1,299.31 kilo tons; it is projected to exhibit the highest CAGR
-
of 6.79%.\r\nTABLE 117 EUROPE: METAL CASTING MARKET, BY EQUIPMENT & MACHINE,
-
2030 (USD MILLION)\r\nEquipment & Machine 2019 2020 2021 2030 CAGR
-
(2022-2030)\r\nPumps & Valves 3,947.28 3,643.16 3,783.29 6,769.96 6.68%\r\nOthers
-
,112.78 2,884.72 3,007.94 5,583.59 7.11%\r\nTotal 7,060.06 6,527.88 6,791.23
-
,353.55 6.87%\r\nSource: Indiana Cast Metal Association (INCMA), American
-
Foundry Society (AFS), The North American Die Casting Association, NON-FERROUS FOUNDERS’
-
SOCIETY, Aluminium Casters’ Association of India, Casting Industry Suppliers
-
Association, International Trade Centre, World Trade Centre, Government Websites,
-
Press Releases, Journals, Annual Reports, Whitepapers, Company Websites, and MRFR
-
Analysis\r\nThe pumps & valves segment accounted for a larger market
-
share of 55.81% in 2020, with a market value of USD 3,643.2 million; it is expected
-
to register a CAGR of 6.68% during the forecast period. The Others segment was valued
-
at USD 2,884.7 million; it is projected to register a higher CAGR of 7.11%.\r\n \r\nTABLE
-
EUROPE: METAL CASTING MARKET, BY EQUIPMENT & MACHINE, 2022-2030 (KILO TONS)\r\nEquipment
-
& Machine 2019 2020 2021 2030 CAGR (2022-2030)\r\nPumps & Valves
-
,470.66 1,346.99 1,382.98 2,225.43 5.43%\r\nOthers 1,133.39 1,042.38 1,074.67
-
,794.76 5.86%\r\nTotal 2,604.05 2,389.38 2,457.64 4,020.19 5.62%\r\nSource:
-
Indiana Cast Metal Association (INCMA), American Foundry Society (AFS), The North
-
American Die Casting Association, NON-FERROUS FOUNDERS’ SOCIETY, Aluminium
-
Casters’ Association of India, Casting Industry Suppliers Association, International
-
Trade Centre, World Trade Centre, Government Websites, Press Releases, Journals,
-
Annual Reports, Whitepapers, Company Websites, and MRFR Analysis\r\nThe pumps
-
& valves segment dominated the market with a share of 56.37%, accounting for
-
,346.99 kilo tons in 2020; it is projected to exhibit a CAGR of 5.43%. The Others
-
segment accounted for a share of 43.63% in 2020, sized at 1,042.38 kilo tons; it
-
is projected to exhibit a higher CAGR of 5.86%.\r\n9.3.1 GERMANY\r\nTABLE
-
GERMANY: METAL CASTING MARKET, BY MATERIAL TYPE, 2022-2030 (USD MILLION)\r\nMaterial
-
Type 2019 2020 2021 2030 CAGR (2022-2030)\r\nCast Iron 7,420.97 6,875.58
-
,167.26 13,250.06 7.07%\r\nAluminium 3,207.31 3,007.29 3,172.30 6,507.93
-
%\r\nStainless Steel 1,472.27 1,375.30 1,445.43 2,874.66 7.94%\r\nZinc
-
493.12 517.08 1,008.15 7.70%\r\nMagnesium 384.33 356.68 372.43 699.19
-
%\r\nCarbon Steel 232.29 213.32 220.38 373.16 6.03%\r\nHigh Steel
-
Alloy 327.34 302.56 314.63 568.59 6.80%\r\nOthers 464.00 424.46 436.75 709.26
-
%\r\nTotal 14,037.62 13,048.30 13,646.26 25,991.00 7.42%\r\nSource:
-
Indiana Cast Metal Association (INCMA), American Foundry Society (AFS), The North
-
American Die Casting Association, NON-FERROUS FOUNDERS’ SOCIETY, Aluminium
-
Casters’ Association of India, Casting Industry Suppliers Association, International
-
Trade Centre, World Trade Centre, Government Websites, Press Releases, Journals,
-
Annual Reports, Whitepapers, Company Websites, and MRFR Analysis\r\nThe cast
-
iron segment accounted for the largest market share of 52.69% in 2020, with a market
-
value of USD 6,875.6 million; it is expected to register a CAGR of 7.07% during
-
the forecast period. The aluminium segment accounted for the second largest market
-
share in 2020, valued at USD 3,007.3 million; it is projected to register the highest
-
CAGR of 8.31%.\r\n \r\nTABLE 120 GERMANY: METAL CASTING MARKET,
-
BY MATERIAL TYPE, 2022-2030 (KILO TONS)\r\nMaterial Type 2019 2020 2021 2030
-
CAGR (2022-2030)\r\nCast Iron 2,800.45 2,574.86 2,653.74 4,412.13 5.81%\r\nAluminium
-
,185.39 1,102.99 1,150.35 2,122.39 7.04%\r\nStainless Steel 517.46 479.69
-
891.54 6.67%\r\nZinc 191.60 177.21 183.72 322.14 6.44%\r\nMagnesium
-
127.40 131.53 222.07 5.99%\r\nCarbon Steel 87.20 79.47 81.17 123.61
-
%\r\nHigh Steel Alloy 122.24 112.12 115.28 187.36 5.54%\r\nOthers
-
158.96 161.71 236.18 4.30%\r\nTotal 5,217.77 4,812.70 4,975.96 8,517.42
-
%\r\nSource: Indiana Cast Metal Association (INCMA), American Foundry
-
Society (AFS), The North American Die Casting Association, NON-FERROUS FOUNDERS’
-
SOCIETY, Aluminium Casters’ Association of India, Casting Industry Suppliers
-
Association, International Trade Centre, World Trade Centre, Government Websites,
-
Press Releases, Journals, Annual Reports, Whitepapers, Company Websites, and MRFR
-
Analysis\r\nThe cast iron segment dominated the market with a share of 53.50%,
-
accounting for 2,574.86 kilo tons in 2020; it is projected to exhibit a CAGR of
-
%. The aluminium segment was the second-largest with a share of 22.92% in 2020,
-
sized at 1,102.99 kilo tons; it is projected to exhibit the highest CAGR of 7.04%.\r\nTABLE
-
GERMANY: METAL CASTING MARKET, BY PROCESS TYPE, 2022-2030 (USD MILLION)\r\nProcess
-
Type 2019 2020 2021 2030 CAGR (2022-2030)\r\nSand Casting 7,095.79 6,612.81
-
,933.73 13,512.44 7.70%\r\nDie Casting 3,228.91 3,022.11 3,182.32 6,432.97
-
%\r\nShell Mold Casting 1,048.71 969.58 1,008.56 1,827.51 6.83%\r\nGravity
-
Casting 831.11 754.90 771.04 1,152.49 4.57%\r\nVacuum Casting 476.96 435.04
-
701.10 5.15%\r\nInvestment Casting 861.83 799.69 834.87 1,565.02 7.23%\r\nOthers
-
454.18 469.46 799.47 6.09%\r\nTotal 14,037.62 13,048.30 13,646.26
-
,991.00 7.42%\r\nSource: Indiana Cast Metal Association (INCMA), American
-
Foundry Society (AFS), The North American Die Casting Association, NON-FERROUS FOUNDERS’
-
SOCIETY, Aluminium Casters’ Association of India, Casting Industry Suppliers
-
Association, International Trade Centre, World Trade Centre, Government Websites,
-
Press Releases, Journals, Annual Reports, Whitepapers, Company Websites, and MRFR
-
Analysis\r\nThe sand casting segment accounted for the largest market share
-
of 50.68% in 2020, with a market value of USD 6,612.8 million; it is expected to
-
register a CAGR of 7.70% during the forecast period. The die casting segment accounted
-
for the second largest market share in 2020, valued at USD 3,022.1 million; it is
-
projected to register the highest CAGR of 8.13%.\r\n \r\nTABLE
-
GERMANY: METAL CASTING MARKET, BY PROCESS TYPE, 2022-2030 (KILO TONS)\r\nProcess
-
Type 2019 2020 2021 2030 CAGR (2022-2030)\r\nSand Casting 2,735.32 2,529.71
-
,622.49 4,596.26 6.43%\r\nDie Casting 1,193.37 1,108.42 1,153.99 2,097.95
-
%\r\nShell Mold Casting 395.75 363.10 373.43 608.54 5.58%\r\nGravity
-
Casting 297.96 268.57 271.21 364.58 3.34%\r\nVacuum Casting 167.64 151.74
-
217.44 3.91%\r\nInvestment Casting 312.09 287.38 296.63 500.08 5.97%\r\nOthers
-
103.78 104.32 132.57 2.70%\r\nTotal 5,217.77 4,812.70 4,975.96 8,517.42
-
%\r\nSource: Indiana Cast Metal Association (INCMA), American Foundry
-
Society (AFS), The North American Die Casting Association, NON-FERROUS FOUNDERS’
-
SOCIETY, Aluminium Casters’ Association of India, Casting Industry Suppliers
-
Association, International Trade Centre, World Trade Centre, Government Websites,
-
Press Releases, Journals, Annual Reports, Whitepapers, Company Websites, and MRFR
-
Analysis\r\nThe sand casting segment dominated the market with a share of
-
%, accounting for 2,529.71 kilo tons in 2020; it is projected to exhibit a
-
CAGR of 6.43%. The die casting segment was the second-largest with a share of 23.03%
-
in 2020, sized at 1,108.42 kilo tons; it is projected to exhibit the highest CAGR
-
of 6.87%.\r\nTABLE 123 GERMANY: METAL CASTING MARKET, BY END-USE INDUSTRY,
-
2030 (USD MILLION)\r\nEnd-use Industry 2019 2020 2021 2030 CAGR (2022-2030)\r\nAutomotive
-
& Transportation 5,687.61 5,306.92 5,571.19 10,971.95 7.82%\r\nBuilding
-
& Construction 2,392.18 2,220.82 2,319.70 4,368.54 7.29%\r\nMining 1,670.64
-
,544.83 1,607.18 2,916.44 6.85%\r\nEquipment & Machine 1,978.29 1,840.04
-
,925.59 3,688.46 7.49%\r\nConsumer Goods 1,393.52 1,291.20 1,346.06 2,489.98
-
%\r\nOthers 915.37 844.50 876.55 1,555.62 6.58%\r\nTotal 14,037.62
-
,048.30 13,646.26 25,991.00 7.42%\r\nSource: Indiana Cast Metal Association
-
(INCMA), American Foundry Society (AFS), The North American Die Casting Association,
-
NON-FERROUS FOUNDERS’ SOCIETY, Aluminium Casters’ Association of India,
-
Casting Industry Suppliers Association, International Trade Centre, World Trade
-
Centre, Government Websites, Press Releases, Journals, Annual Reports, Whitepapers,
-
Company Websites, and MRFR Analysis\r\nThe automotive & transportation
-
segment accounted for the largest market share of 40.67% in 2020, with a market
-
value of USD 5,306.9 million; it is expected to register the highest CAGR of 7.82%
-
during the forecast period. The building & construction segment accounted for
-
the second largest market share in 2020, valued at USD 2,220.8 million; it is projected
-
to exhibit a CAGR of 7.29%.\r\n \r\nTABLE 124 GERMANY: METAL
-
CASTING MARKET, BY END-USE INDUSTRY, 2022-2030 (KILO TONS)\r\nEnd-use Industry
-
2020 2021 2030 CAGR (2022-2030)\r\nAutomotive & Transportation 2,146.33
-
,987.40 2,062.78 3,653.54 6.56%\r\nBuilding & Construction 893.33 823.02
-
1,439.52 6.03%\r\nMining 611.15 560.82 576.86 941.42 5.59%\r\nEquipment
-
& Machine 731.16 674.87 698.27 1,202.90 6.23%\r\nConsumer Goods 504.63
-
478.25 795.64 5.82%\r\nOthers 331.18 302.58 309.86 484.40 5.09%\r\nTotal
-
,217.77 4,812.70 4,975.96 8,517.42 6.15%\r\nSource: Indiana Cast Metal Association
-
(INCMA), American Foundry Society (AFS), The North American Die Casting Association,
-
NON-FERROUS FOUNDERS’ SOCIETY, Aluminium Casters’ Association of India,
-
Casting Industry Suppliers Association, International Trade Centre, World Trade
-
Centre, Government Websites, Press Releases, Journals, Annual Reports, Whitepapers,
-
Company Websites, and MRFR Analysis\r\nThe automotive & transportation
-
segment dominated the market with a share of 41.29%, accounting for 1,987.40 kilo
-
tons in 2020; it is expected to register the highest CAGR of 6.56% from 2021 to
-
The building & construction segment was the second-largest with a share
-
of 17.10% in 2020, sized at 823.02 kilo tons; it is projected to exhibit a CAGR
-
of 6.03%.\r\nTABLE 125 GERMANY: METAL CASTING MARKET, BY AUTOMOTIVE &
-
TRANSPORTATION, 2022-2030\r\n(USD MILLION)\r\nAutomotive & Transportation
-
2020 2021 2030 CAGR (2022-2030)\r\nGearbox 1,034.01 972.86 1,029.78
-
,178.15 8.68%\r\nWheels 700.71 656.93 692.92 1,422.71 8.32%\r\nEngine
-
Blocks 856.76 800.43 841.36 1,675.95 7.96%\r\nCylinder Head 1,330.93 1,234.13
-
,287.48 2,391.89 7.12%\r\nExhaust Manifold 340.76 316.37 330.47 621.51 7.27%\r\nSeat
-
Frame 439.04 409.13 428.94 834.89 7.68%\r\nOthers 985.40 917.07 960.24 1,846.86
-
%\r\nTotal 5,687.61 5,306.92 5,571.19 10,971.95 7.82%\r\nSource:
-
Indiana Cast Metal Association (INCMA), American Foundry Society (AFS), The North
-
American Die Casting Association, NON-FERROUS FOUNDERS’ SOCIETY, Aluminium
-
Casters’ Association of India, Casting Industry Suppliers Association, International
-
Trade Centre, World Trade Centre, Government Websites, Press Releases, Journals,
-
Annual Reports, Whitepapers, Company Websites, and MRFR Analysis\r\nThe cylinder
-
head segment accounted for the largest market share of 23.26% in 2020, with a market
-
value of USD 1,234.1 million; it is expected to register a CAGR of 7.12% during
-
the forecast period. The gearbox segment accounted for the second largest market
-
share in 2020, valued at USD 972.9 million; it is projected to register the highest
-
CAGR of 8.68%.\r\n \r\nTABLE 126 GERMANY: METAL CASTING MARKET,
-
BY AUTOMOTIVE & TRANSPORTATION, 2022-2030 (KILO TONS)\r\nAutomotive &
-
Transportation 2019 2020 2021 2030 CAGR (2022-2030)\r\nGearbox 410.74 383.51
-
763.47 7.41%\r\nWheels 269.82 251.04 261.80 483.42 7.05%\r\nEngine
-
Blocks 336.79 312.25 324.50 581.33 6.69%\r\nCylinder Head 517.79 476.46 491.44
-
5.87%\r\nExhaust Manifold 129.89 119.68 123.60 209.05 6.01%\r\nSeat
-
Frame 165.68 153.21 158.82 278.01 6.42%\r\nOthers 315.62 291.26 301.27 517.17
-
%\r\nTotal 2,146.33 1,987.40 2,062.78 3,653.54 6.56%\r\nSource:
-
Indiana Cast Metal Association (INCMA), American Foundry Society (AFS), The North
-
American Die Casting Association, NON-FERROUS FOUNDERS’ SOCIETY, Aluminium
-
Casters’ Association of India, Casting Industry Suppliers Association, International
-
Trade Centre, World Trade Centre, Government Websites, Press Releases, Journals,
-
Annual Reports, Whitepapers, Company Websites, and MRFR Analysis\r\nThe cylinder
-
head segment dominated the market with a share of 23.97%, accounting for 476.46
-
kilo tons in 2020; it is projected to exhibit a CAGR of 5.87%. The Gearbox segment
-
was the second-largest with a share of 19.30% in 2020, sized at 383.51 kilo tons;
-
it is projected to exhibit the highest CAGR of 7.41%.\r\nTABLE 127 GERMANY:
-
METAL CASTING MARKET, BY EQUIPMENT & MACHINE, 2022-2030 (USD MILLION)\r\nEquipment
-
& Machine 2019 2020 2021 2030 CAGR (2022-2030)\r\nPumps & Valves
-
,094.64 1,016.32 1,061.66 2,000.75 7.29%\r\nOthers 883.66 823.73 863.93
-
,687.72 7.72%\r\nTotal 1,978.29 1,840.04 1,925.59 3,688.46 7.49%\r\nSource:
-
Indiana Cast Metal Association (INCMA), American Foundry Society (AFS), The North
-
American Die Casting Association, NON-FERROUS FOUNDERS’ SOCIETY, Aluminium
-
Casters’ Association of India, Casting Industry Suppliers Association, International
-
Trade Centre, World Trade Centre, Government Websites, Press Releases, Journals,
-
Annual Reports, Whitepapers, Company Websites, and MRFR Analysis\r\nThe pumps
-
& valves segment accounted for a larger market share of 55.23% in 2020, with
-
a market value of USD 1,016.3 million; it is expected to register a CAGR of 7.29%
-
during the forecast period. The Others segment was valued at USD 823.7 million;
-
it is projected to register a higher CAGR of 7.72%.\r\n \r\nTABLE
-
GERMANY: METAL CASTING MARKET, BY EQUIPMENT & MACHINE, 2022-2030 (KILO TONS)\r\nEquipment
-
& Machine 2019 2020 2021 2030 CAGR (2022-2030)\r\nPumps & Valves
-
376.52 388.87 659.08 6.04%\r\nOthers 322.50 298.35 309.39 543.81 6.47%\r\nTotal
-
674.87 698.27 1,202.90 6.23%\r\nSource: Indiana Cast Metal Association
-
(INCMA), American Foundry Society (AFS), The North American Die Casting Association,
-
NON-FERROUS FOUNDERS’ SOCIETY, Aluminium Casters’ Association of India,
-
Casting Industry Suppliers Association, International Trade Centre, World Trade
-
Centre, Government Websites, Press Releases, Journals, Annual Reports, Whitepapers,
-
Company Websites, and MRFR Analysis\r\nThe pumps & valves segment dominated
-
the market with a share of 55.79%, accounting for 376.52 kilo tons in 2020; it is
-
projected to exhibit a CAGR of 6.04%. The Others segment accounted for a share of
-
% in 2020, sized at 298.35 kilo tons; it is projected to exhibit a higher CAGR
-
of 6.47%.\r\n9.3.2 UK\r\nTABLE 129 UK: METAL CASTING MARKET, BY MATERIAL
-
TYPE, 2022-2030 (USD MILLION)\r\nMaterial Type 2019 2020 2021 2030 CAGR (2022-2030)\r\nCast
-
Iron 1,933.26 1,770.20 1,823.67 3,030.73 5.81%\r\nAluminium 811.34 753.25
-
1,473.20 7.22%\r\nStainless Steel 376.00 348.66 363.74 674.70 7.11%\r\nZinc
-
113.67 117.85 207.36 6.48%\r\nMagnesium 104.91 96.23 99.31 167.77
-
%\r\nCarbon Steel 68.11 61.89 63.26 97.49 4.92%\r\nHigh Steel
-
Alloy 79.22 72.33 74.29 120.13 5.48%\r\nOthers 234.01 210.82 213.60 299.52
-
%\r\nTotal 3,730.19 3,427.04 3,542.44 6,070.91 6.17%\r\nSource:
-
Indiana Cast Metal Association (INCMA), American Foundry Society (AFS), The North
-
American Die Casting Association, NON-FERROUS FOUNDERS’ SOCIETY, Aluminium
-
Casters’ Association of India, Casting Industry Suppliers Association, International
-
Trade Centre, World Trade Centre, Government Websites, Press Releases, Journals,
-
Annual Reports, Whitepapers, Company Websites, and MRFR Analysis\r\nThe cast
-
iron segment accounted for the largest market share of 51.65% in 2020, with a market
-
value of USD 1,770.2 million; it is expected to register a CAGR of 5.81% during
-
the forecast period. The aluminium segment accounted for the second largest market
-
share in 2020, valued at USD 753.2 million; it is projected to register the highest
-
CAGR of 7.22%.\r\n \r\nTABLE 130 UK: METAL CASTING MARKET, BY
-
MATERIAL TYPE, 2022-2030 (KILO TONS)\r\nMaterial Type 2019 2020 2021 2030
-
CAGR (2022-2030)\r\nCast Iron 746.10 677.96 690.55 1,032.09 4.57%\r\nAluminium
-
282.54 291.76 491.34 5.96%\r\nStainless Steel 135.15 124.37 128.28
-
5.85%\r\nZinc 45.68 41.77 42.82 67.76 5.23%\r\nMagnesium 38.62
-
35.87 54.49 4.76%\r\nCarbon Steel 26.15 23.58 23.83 33.03 3.69%\r\nHigh
-
Steel Alloy 30.25 27.41 27.84 40.48 4.25%\r\nOthers 90.31 80.74 80.88 102.00
-
%\r\nTotal 1,418.92 1,293.52 1,321.82 2,035.19 4.91%\r\nSource:
-
Indiana Cast Metal Association (INCMA), American Foundry Society (AFS), The North
-
American Die Casting Association, NON-FERROUS FOUNDERS’ SOCIETY, Aluminium
-
Casters’ Association of India, Casting Industry Suppliers Association, International
-
Trade Centre, World Trade Centre, Government Websites, Press Releases, Journals,
-
Annual Reports, Whitepapers, Company Websites, and MRFR Analysis\r\nThe cast
-
iron segment dominated the market with a share of 52.41%, accounting for 677.96
-
kilo tons in 2020; it is projected to exhibit a CAGR of 4.57%. The aluminium segment
-
was the second-largest with a share of 21.84% in 2020, sized at 282.54 kilo tons;
-
it is projected to exhibit the highest CAGR of 5.96%.\r\nTABLE 131 UK: METAL
-
CASTING MARKET, BY PROCESS TYPE, 2022-2030 (USD MILLION)\r\nProcess Type
-
2020 2021 2030 CAGR (2022-2030)\r\nSand Casting 1,872.06 1,724.35 1,787.01
-
,133.11 6.44%\r\nDie Casting 933.45 863.01 897.67 1,624.71 6.81%\r\nShell
-
Mold Casting 294.14 268.85 276.48 451.82 5.61%\r\nGravity Casting 159.64
-
142.02 169.53 1.99%\r\nVacuum Casting 117.00 105.30 106.59 147.83
-
%\r\nInvestment Casting 220.36 202.08 208.49 351.34 5.97%\r\nOthers
-
121.42 124.19 192.57 4.99%\r\nTotal 3,730.19 3,427.04 3,542.44 6,070.91
-
%\r\nSource: Indiana Cast Metal Association (INCMA), American Foundry
-
Society (AFS), The North American Die Casting Association, NON-FERROUS FOUNDERS’
-
SOCIETY, Aluminium Casters’ Association of India, Casting Industry Suppliers
-
Association, International Trade Centre, World Trade Centre, Government Websites,
-
Press Releases, Journals, Annual Reports, Whitepapers, Company Websites, and MRFR
-
Analysis\r\nThe sand casting segment accounted for the largest market share
-
of 50.32% in 2020, with a market value of USD 1,724.4 million; it is expected to
-
register a CAGR of 6.44% during the forecast period. The die casting segment accounted
-
for the second largest market share in 2020, valued at USD 863.0 million; it is
-
projected to register the highest CAGR of 6.81%.\r\n \r\nTABLE
-
UK: METAL CASTING MARKET, BY PROCESS TYPE, 2022-2030 (KILO TONS)\r\nProcess
-
Type 2019 2020 2021 2030 CAGR (2022-2030)\r\nSand Casting 738.02 674.61 691.21
-
,089.90 5.19%\r\nDie Casting 352.82 323.71 332.90 541.87 5.56%\r\nShell
-
Mold Casting 113.52 102.97 104.69 153.86 4.37%\r\nGravity Casting 58.53 51.67
-
54.85 0.79%\r\nVacuum Casting 42.06 37.56 37.59 46.89 2.49%\r\nInvestment
-
Casting 81.61 74.27 75.76 114.81 4.73%\r\nOthers 32.38 28.74 28.58 33.01
-
%\r\nTotal 1,418.92 1,293.52 1,321.82 2,035.19 4.91%\r\nSource:
-
Indiana Cast Metal Association (INCMA), American Foundry Society (AFS), The North
-
American Die Casting Association, NON-FERROUS FOUNDERS’ SOCIETY, Aluminium
-
Casters’ Association of India, Casting Industry Suppliers Association, International
-
Trade Centre, World Trade Centre, Government Websites, Press Releases, Journals,
-
Annual Reports, Whitepapers, Company Websites, and MRFR Analysis\r\nThe sand
-
casting segment dominated the market with a share of 52.15%, accounting for 674.61
-
kilo tons in 2020; it is projected to exhibit a CAGR of 5.19%. The die casting segment
-
was the second-largest with a share of 25.03% in 2020, sized at 323.71 kilo tons;
-
it is projected to exhibit the highest CAGR of 5.56%.\r\nTABLE 133 UK: METAL
-
CASTING MARKET, BY END-USE INDUSTRY, 2022-2030 (USD MILLION)\r\nEnd-use Industry
-
2020 2021 2030 CAGR (2022-2030)\r\nAutomotive & Transportation 1,530.63
-
,411.48 1,464.44 2,593.21 6.56%\r\nBuilding & Construction 658.08 603.85
-
1,056.42 6.04%\r\nMining 383.65 350.34 359.94 582.93 5.50%\r\nEquipment
-
& Machine 584.55 537.33 555.72 956.89 6.22%\r\nConsumer Goods 396.22
-
374.01 623.50 5.84%\r\nOthers 177.05 161.11 164.93 257.96 5.10%\r\nTotal
-
,730.19 3,427.04 3,542.44 6,070.91 6.17%\r\nSource: Indiana Cast Metal Association
-
(INCMA), American Foundry Society (AFS), The North American Die Casting Association,
-
NON-FERROUS FOUNDERS’ SOCIETY, Aluminium Casters’ Association of India,
-
Casting Industry Suppliers Association, International Trade Centre, World Trade
-
Centre, Government Websites, Press Releases, Journals, Annual Reports, Whitepapers,
-
Company Websites, and MRFR Analysis\r\nThe automotive & transportation
-
segment accounted for the largest market share of 41.19% in 2020, with a market
-
value of USD 1,411.5 million; it is expected to register the highest CAGR of 6.56%
-
during the forecast period. The building & construction segment accounted for
-
the second largest market share in 2020, valued at USD 603.8 million; it is projected
-
to exhibit a CAGR of 6.04%.\r\n \r\nTABLE 134 UK: METAL CASTING
-
MARKET, BY END-USE INDUSTRY, 2022-2030 (KILO TONS)\r\nEnd-use Industry 2019
-
2021 2030 CAGR (2022-2030)\r\nAutomotive & Transportation 590.72
-
554.52 883.10 5.31%\r\nBuilding & Construction 251.33 228.86 233.60
-
4.79%\r\nMining 143.53 130.07 132.12 192.44 4.27%\r\nEquipment
-
& Machine 220.94 201.55 206.09 319.14 4.98%\r\nConsumer Goods 146.73
-
135.90 203.75 4.60%\r\nOthers 65.67 59.09 59.59 80.76 3.44%\r\nTotal
-
,418.92 1,293.52 1,321.82 2,035.19 4.91%\r\nSource: Indiana Cast Metal Association
-
(INCMA), American Foundry Society (AFS), The North American Die Casting Association,
-
NON-FERROUS FOUNDERS’ SOCIETY, Aluminium Casters’ Association of India,
-
Casting Industry Suppliers Association, International Trade Centre, World Trade
-
Centre, Government Websites, Press Releases, Journals, Annual Reports, Whitepapers,
-
Company Websites, and MRFR Analysis\r\nThe automotive & transportation
-
segment dominated the market with a share of 41.79%, accounting for 540.58 kilo
-
tons in 2020; it is expected to register the highest CAGR of 5.31% from 2021 to
-
The building & construction segment was the second-largest with a share
-
of 17.69% in 2020, sized at 228.86 kilo tons; it is projected to exhibit a CAGR
-
of 4.79%.\r\nTABLE 135 UK: METAL CASTING MARKET, BY AUTOMOTIVE & TRANSPORTATION,
-
2030 (USD MILLION)\r\nAutomotive & Transportation 2019 2020 2021
-
CAGR (2022-2030)\r\nGearbox 285.19 265.13 277.30 526.52 7.38%\r\nWheels
-
150.57 157.08 291.87 7.13%\r\nEngine Blocks 200.02 184.72 191.93 344.35
-
%\r\nCylinder Head 362.46 332.19 342.52 572.57 5.88%\r\nExhaust
-
Manifold 118.39 108.75 112.40 192.10 6.14%\r\nSeat Frame 136.35 125.60 130.16
-
6.43%\r\nOthers 265.86 244.53 253.05 437.64 6.28%\r\nTotal
-
,530.63 1,411.48 1,464.44 2,593.21 6.56%\r\nSource: Indiana Cast Metal Association
-
(INCMA), American Foundry Society (AFS), The North American Die Casting Association,
-
NON-FERROUS FOUNDERS’ SOCIETY, Aluminium Casters’ Association of India,
-
Casting Industry Suppliers Association, International Trade Centre, World Trade
-
Centre, Government Websites, Press Releases, Journals, Annual Reports, Whitepapers,
-
Company Websites, and MRFR Analysis\r\nThe cylinder head segment accounted
-
for the largest market share of 23.53% in 2020, with a market value of USD 332.2
-
million; it is expected to register a CAGR of 5.88% during the forecast period.
-
The gearbox segment accounted for the second largest market share in 2020, valued
-
at USD 265.1 million; it is projected to register the highest CAGR of 7.38%.\r\n \r\nTABLE
-
UK: METAL CASTING MARKET, BY AUTOMOTIVE & TRANSPORTATION, 2022-2030 (KILO
-
TONS)\r\nAutomotive & Transportation 2019 2020 2021 2030 CAGR (2022-2030)\r\nGearbox
-
106.89 110.53 188.74 6.13%\r\nWheels 63.94 58.84 60.69 101.42 5.87%\r\nEngine
-
Blocks 80.41 73.69 75.70 122.15 5.46%\r\nCylinder Head 144.21 131.16 133.71
-
4.63%\r\nExhaust Manifold 46.15 42.07 42.99 66.08 4.89%\r\nSeat
-
Frame 52.62 48.10 49.29 77.70 5.19%\r\nOthers 87.53 79.83 81.61 125.99 4.94%\r\nTotal
-
540.58 554.52 883.10 5.31%\r\nSource: Indiana Cast Metal Association
-
(INCMA), American Foundry Society (AFS), The North American Die Casting Association,
-
NON-FERROUS FOUNDERS’ SOCIETY, Aluminium Casters’ Association of India,
-
Casting Industry Suppliers Association, International Trade Centre, World Trade
-
Centre, Government Websites, Press Releases, Journals, Annual Reports, Whitepapers,
-
Company Websites, and MRFR Analysis\r\nThe cylinder head segment dominated
-
the market with a share of 24.26%, accounting for 131.16 kilo tons in 2020; it is
-
projected to exhibit a CAGR of 4.63%. The Gearbox segment was the second-largest
-
with a share of 19.77% in 2020, sized at 106.89 kilo tons; it is projected to exhibit
-
the highest CAGR of 6.13%.\r\nTABLE 137 UK: METAL CASTING MARKET, BY EQUIPMENT
-
& MACHINE, 2022-2030 (USD MILLION)\r\nEquipment & Machine 2019 2020
-
2030 CAGR (2022-2030)\r\nPumps & Valves 330.61 303.37 313.21 530.79
-
%\r\nOthers 253.94 233.96 242.51 426.11 6.46%\r\nTotal 584.55
-
555.72 956.89 6.22%\r\nSource: Indiana Cast Metal Association (INCMA),
-
American Foundry Society (AFS), The North American Die Casting Association, NON-FERROUS
-
FOUNDERS’ SOCIETY, Aluminium Casters’ Association of India, Casting
-
Industry Suppliers Association, International Trade Centre, World Trade Centre,
-
Government Websites, Press Releases, Journals, Annual Reports, Whitepapers, Company
-
Websites, and MRFR Analysis\r\nThe pumps & valves segment accounted for
-
a larger market share of 56.46% in 2020, with a market value of USD 303.4 million;
-
it is expected to register a CAGR of 6.04% during the forecast period. The Others
-
segment was valued at USD 234.0 million; it is projected to register a higher CAGR
-
of 6.46%.\r\n \r\nTABLE 138 UK: METAL CASTING MARKET, BY EQUIPMENT
-
& MACHINE, 2022-2030 (KILO TONS)\r\nEquipment & Machine 2019 2020
-
2030 CAGR (2022-2030)\r\nPumps & Valves 126.23 114.94 117.33 178.82
-
%\r\nOthers 94.72 86.61 88.76 140.33 5.22%\r\nTotal 220.94 201.55
-
319.14 4.98%\r\nSource: Indiana Cast Metal Association (INCMA), American
-
Foundry Society (AFS), The North American Die Casting Association, NON-FERROUS FOUNDERS’
-
SOCIETY, Aluminium Casters’ Association of India, Casting Industry Suppliers
-
Association, International Trade Centre, World Trade Centre, Government Websites,
-
Press Releases, Journals, Annual Reports, Whitepapers, Company Websites, and MRFR
-
Analysis\r\nThe pumps & valves segment dominated the market with a share
-
of 57.03%, accounting for 114.94 kilo tons in 2020; it is projected to exhibit a
-
CAGR of 4.79%. The Others segment accounted for a share of 42.97% in 2020, sized
-
at 86.61 kilo tons; it is projected to exhibit a higher CAGR of 5.22%.\r\n9.3.3
-
FRANCE\r\nTABLE 139 FRANCE: METAL CASTING MARKET, BY MATERIAL TYPE, 2022-2030
-
(USD MILLION)\r\nMaterial Type 2019 2020 2021 2030 CAGR (2022-2030)\r\nCast
-
Iron 4,156.59 3,837.50 3,986.26 7,147.49 6.70%\r\nAluminium 1,853.35 1,734.61
-
,826.46 3,685.95 8.11%\r\nStainless Steel 886.32 825.10 864.21 1,668.56
-
%\r\nZinc 378.61 351.50 367.18 692.65 7.31%\r\nMagnesium 266.10
-
256.26 468.33 6.93%\r\nCarbon Steel 178.64 163.95 169.30 286.62 6.02%\r\nHigh
-
Steel Alloy 257.69 237.71 246.72 438.94 6.61%\r\nOthers 333.18 302.34 308.56
-
4.57%\r\nTotal 8,310.47 7,698.90 8,024.95 14,850.00 7.08%\r\nSource:
-
Indiana Cast Metal Association (INCMA), American Foundry Society (AFS), The North
-
American Die Casting Association, NON-FERROUS FOUNDERS’ SOCIETY, Aluminium
-
Casters’ Association of India, Casting Industry Suppliers Association, International
-
Trade Centre, World Trade Centre, Government Websites, Press Releases, Journals,
-
Annual Reports, Whitepapers, Company Websites, and MRFR Analysis\r\nThe cast
-
iron segment accounted for the largest market share of 49.84% in 2020, with a market
-
value of USD 3,837.5 million; it is expected to register a CAGR of 6.70% during
-
the forecast period. The aluminium segment accounted for the second largest market
-
share in 2020, valued at USD 1,734.6 million; it is projected to register the highest
-
CAGR of 8.11%.\r\n \r\nTABLE 140 FRANCE: METAL CASTING MARKET,
-
BY MATERIAL TYPE, 2022-2030 (KILO TONS)\r\nMaterial Type 2019 2020 2021 2030
-
CAGR (2022-2030)\r\nCast Iron 1,559.14 1,428.48 1,467.07 2,365.73 5.45%\r\nAluminium
-
632.38 658.34 1,194.85 6.85%\r\nStainless Steel 309.64 286.06 296.23
-
6.32%\r\nZinc 136.28 125.56 129.68 220.00 6.05%\r\nMagnesium
-
87.41 89.96 147.85 5.68%\r\nCarbon Steel 66.66 60.71 61.98 94.37 4.78%\r\nHigh
-
Steel Alloy 95.65 87.56 89.86 143.77 5.36%\r\nOthers 124.97 112.54 113.56
-
3.35%\r\nTotal 3,068.41 2,820.70 2,906.67 4,833.68 5.81%\r\nSource:
-
Indiana Cast Metal Association (INCMA), American Foundry Society (AFS), The North
-
American Die Casting Association, NON-FERROUS FOUNDERS’ SOCIETY, Aluminium
-
Casters’ Association of India, Casting Industry Suppliers Association, International
-
Trade Centre, World Trade Centre, Government Websites, Press Releases, Journals,
-
Annual Reports, Whitepapers, Company Websites, and MRFR Analysis\r\nThe cast
-
iron segment dominated the market with a share of 50.64%, accounting for 1,428.48
-
kilo tons in 2020; it is projected to exhibit a CAGR of 5.45%. The aluminium segment
-
was the second-largest with a share of 22.42% in 2020, sized at 632.38 kilo tons;
-
it is projected to exhibit the highest CAGR of 6.85%.\r\nTABLE 141 FRANCE:
-
METAL CASTING MARKET, BY PROCESS TYPE, 2022-2030 (USD MILLION)\r\nProcess
-
Type 2019 2020 2021 2030 CAGR (2022-2030)\r\nSand Casting 4,174.37 3,877.24
-
,051.92 7,672.49 7.35%\r\nDie Casting 1,889.31 1,762.51 1,849.90 3,635.34
-
%\r\nShell Mold Casting 549.14 505.65 523.86 916.09 6.41%\r\nGravity
-
Casting 526.06 476.93 486.28 719.32 4.45%\r\nVacuum Casting 362.22 330.66
-
543.17 5.36%\r\nInvestment Casting 455.32 420.99 437.96 796.13 6.87%\r\nOthers
-
324.93 335.48 567.47 6.01%\r\nTotal 8,310.47 7,698.90 8,024.95 14,850.00
-
%\r\nSource: Indiana Cast Metal Association (INCMA), American Foundry
-
Society (AFS), The North American Die Casting Association, NON-FERROUS FOUNDERS’
-
SOCIETY, Aluminium Casters’ Association of India, Casting Industry Suppliers
-
Association, International Trade Centre, World Trade Centre, Government Websites,
-
Press Releases, Journals, Annual Reports, Whitepapers, Company Websites, and MRFR
-
Analysis\r\nThe sand casting segment accounted for the largest market share
-
of 50.36% in 2020, with a market value of USD 3,877.2 million; it is expected to
-
register a CAGR of 7.35% during the forecast period. The die casting segment accounted
-
for the second largest market share in 2020, valued at USD 1,762.5 million; it is
-
projected to register the highest CAGR of 7.80%.\r\n \r\nTABLE
-
FRANCE: METAL CASTING MARKET, BY PROCESS TYPE, 2022-2030 (KILO TONS)\r\nProcess
-
Type 2019 2020 2021 2030 CAGR (2022-2030)\r\nSand Casting 1,599.48 1,474.30
-
,523.31 2,594.11 6.09%\r\nDie Casting 694.07 642.55 666.78 1,178.44 6.53%\r\nShell
-
Mold Casting 205.98 188.22 192.80 303.22 5.16%\r\nGravity Casting 187.46
-
170.02 226.18 3.22%\r\nVacuum Casting 126.54 114.64 116.39 167.44
-
%\r\nInvestment Casting 163.89 150.38 154.67 252.86 5.61%\r\nOthers
-
81.94 82.70 111.42 3.37%\r\nTotal 3,068.41 2,820.70 2,906.67 4,833.68
-
%\r\nSource: Indiana Cast Metal Association (INCMA), American Foundry
-
Society (AFS), The North American Die Casting Association, NON-FERROUS FOUNDERS’
-
SOCIETY, Aluminium Casters’ Association of India, Casting Industry Suppliers
-
Association, International Trade Centre, World Trade Centre, Government Websites,
-
Press Releases, Journals, Annual Reports, Whitepapers, Company Websites, and MRFR
-
Analysis\r\nThe sand casting segment dominated the market with a share of
-
%, accounting for 1,474.30 kilo tons in 2020; it is projected to exhibit a
-
CAGR of 6.09%. The die casting segment was the second-largest with a share of 22.78%
-
in 2020, sized at 642.55 kilo tons; it is projected to exhibit the highest CAGR
-
of 6.53%.\r\nTABLE 143 FRANCE: METAL CASTING MARKET, BY END-USE INDUSTRY,
-
2030 (USD MILLION)\r\nEnd-use Industry 2019 2020 2021 2030 CAGR (2022-2030)\r\nAutomotive
-
& Transportation 3,365.45 3,129.65 3,274.55 6,265.22 7.48%\r\nBuilding
-
& Construction 1,420.18 1,314.02 1,367.96 2,502.92 6.94%\r\nMining 1,081.20
-
1,034.10 1,830.79 6.55%\r\nEquipment & Machine 1,304.04 1,208.75
-
,260.64 2,344.45 7.14%\r\nConsumer Goods 785.53 725.29 753.48 1,352.16 6.71%\r\nOthers
-
324.32 334.21 554.46 5.79%\r\nTotal 8,310.47 7,698.90 8,024.95 14,850.00
-
%\r\nSource: Indiana Cast Metal Association (INCMA), American Foundry
-
Society (AFS), The North American Die Casting Association, NON-FERROUS FOUNDERS’
-
SOCIETY, Aluminium Casters’ Association of India, Casting Industry Suppliers
-
Association, International Trade Centre, World Trade Centre, Government Websites,
-
Press Releases, Journals, Annual Reports, Whitepapers, Company Websites, and MRFR
-
Analysis\r\nThe automotive & transportation segment accounted for the
-
largest market share of 40.65% in 2020, with a market value of USD 3,129.6 million;
-
it is expected to register the highest CAGR of 7.48% during the forecast period.
-
The building & construction segment accounted for the second largest market
-
share in 2020, valued at USD 1,314.0 million; it is projected to exhibit a CAGR
-
of 6.94%.\r\n \r\nTABLE 144 FRANCE: METAL CASTING MARKET, BY
-
END-USE INDUSTRY, 2022-2030 (KILO TONS)\r\nEnd-use Industry 2019 2020 2021
-
CAGR (2022-2030)\r\nAutomotive & Transportation 1,262.38 1,164.98
-
,205.14 2,073.71 6.22%\r\nBuilding & Construction 527.16 484.04 498.21
-
5.69%\r\nMining 393.14 359.71 368.93 587.42 5.30%\r\nEquipment
-
& Machine 479.06 440.67 454.39 759.99 5.88%\r\nConsumer Goods 282.75
-
266.10 429.46 5.46%\r\nOthers 123.91 112.21 113.89 163.29 4.08%\r\nTotal
-
,068.41 2,820.70 2,906.67 4,833.68 5.81%\r\nSource: Indiana Cast Metal Association
-
(INCMA), American Foundry Society (AFS), The North American Die Casting Association,
-
NON-FERROUS FOUNDERS’ SOCIETY, Aluminium Casters’ Association of India,
-
Casting Industry Suppliers Association, International Trade Centre, World Trade
-
Centre, Government Websites, Press Releases, Journals, Annual Reports, Whitepapers,
-
Company Websites, and MRFR Analysis\r\nThe automotive & transportation
-
segment dominated the market with a share of 41.30%, accounting for 1,164.98 kilo
-
tons in 2020; it is expected to register the highest CAGR of 6.22% from 2021 to
-
The building & construction segment was the second-largest with a share
-
of 17.16% in 2020, sized at 484.04 kilo tons; it is projected to exhibit a CAGR
-
of 5.69%.\r\nTABLE 145 FRANCE: METAL CASTING MARKET, BY AUTOMOTIVE &
-
TRANSPORTATION, 2022-2030 (USD MILLION)\r\nAutomotive & Transportation
-
2020 2021 2030 CAGR (2022-2030)\r\nGearbox 625.95 586.85 619.00 1,270.04
-
%\r\nWheels 359.91 336.53 354.04 710.54 8.05%\r\nEngine Blocks
-
439.82 460.81 892.50 7.62%\r\nCylinder Head 806.68 745.61 775.37 1,401.47
-
%\r\nExhaust Manifold 239.46 221.76 231.05 425.33 7.02%\r\nSeat
-
Frame 292.20 271.42 283.66 537.09 7.35%\r\nOthers 568.93 527.66 550.63 1,028.26
-
%\r\nTotal 3,365.45 3,129.65 3,274.55 6,265.22 7.48%\r\nSource:
-
Indiana Cast Metal Association (INCMA), American Foundry Society (AFS), The North
-
American Die Casting Association, NON-FERROUS FOUNDERS’ SOCIETY, Aluminium
-
Casters’ Association of India, Casting Industry Suppliers Association, International
-
Trade Centre, World Trade Centre, Government Websites, Press Releases, Journals,
-
Annual Reports, Whitepapers, Company Websites, and MRFR Analysis\r\nThe cylinder
-
head segment accounted for the largest market share of 23.82% in 2020, with a market
-
value of USD 745.6 million; it is expected to register a CAGR of 6.80% during the
-
forecast period. The gearbox segment accounted for the second largest market share
-
in 2020, valued at USD 586.8 million; it is projected to register the highest CAGR
-
of 8.31%.\r\n \r\nTABLE 146 FRANCE: METAL CASTING MARKET, BY
-
AUTOMOTIVE & TRANSPORTATION, 2022-2030 (KILO TONS)\r\nAutomotive &
-
Transportation 2019 2020 2021 2030 CAGR (2022-2030)\r\nGearbox 247.15 229.95
-
442.49 7.04%\r\nWheels 137.76 127.83 132.96 239.98 6.78%\r\nEngine
-
Blocks 184.55 170.54 176.66 307.72 6.36%\r\nCylinder Head 311.95 286.13 294.19
-
5.55%\r\nExhaust Manifold 90.73 83.38 85.89 142.20 5.76%\r\nSeat
-
Frame 109.61 101.03 104.40 177.77 6.09%\r\nOthers 180.64 166.12 171.25 285.34
-
%\r\nTotal 1,262.38 1,164.98 1,205.14 2,073.71 6.22%\r\nSource:
-
Indiana Cast Metal Association (INCMA), American Foundry Society (AFS), The North
-
American Die Casting Association, NON-FERROUS FOUNDERS’ SOCIETY, Aluminium
-
Casters’ Association of India, Casting Industry Suppliers Association, International
-
Trade Centre, World Trade Centre, Government Websites, Press Releases, Journals,
-
Annual Reports, Whitepapers, Company Websites, and MRFR Analysis\r\nThe cylinder
-
head segment dominated the market with a share of 24.56%, accounting for 286.13
-
kilo tons in 2020; it is projected to exhibit a CAGR of 5.55%. The Gearbox segment
-
was the second-largest with a share of 19.74% in 2020, sized at 229.95 kilo tons;
-
it is projected to exhibit the highest CAGR of 7.04%.\r\nTABLE 147 FRANCE:
-
METAL CASTING MARKET, BY EQUIPMENT & MACHINE, 2022-2030 (USD MILLION)\r\nEquipment
-
& Machine 2019 2020 2021 2030 CAGR (2022-2030)\r\nPumps & Valves
-
670.04 697.55 1,276.37 6.94%\r\nOthers 579.89 538.71 563.09 1,068.08
-
%\r\nTotal 1,304.04 1,208.75 1,260.64 2,344.45 7.14%\r\nSource:
-
Indiana Cast Metal Association (INCMA), American Foundry Society (AFS), The North
-
American Die Casting Association, NON-FERROUS FOUNDERS’ SOCIETY, Aluminium
-
Casters’ Association of India, Casting Industry Suppliers Association, International
-
Trade Centre, World Trade Centre, Government Websites, Press Releases, Journals,
-
Annual Reports, Whitepapers, Company Websites, and MRFR Analysis\r\nThe pumps
-
& valves segment accounted for a larger market share of 55.43% in 2020, with
-
a market value of USD 670.0 million; it is expected to register a CAGR of 6.94%
-
during the forecast period. The Others segment was valued at USD 538.7 million;
-
it is projected to register a higher CAGR of 7.37%.\r\n \r\nTABLE
-
FRANCE: METAL CASTING MARKET, BY EQUIPMENT & MACHINE, 2022-2030 (KILO TONS)\r\nEquipment
-
& Machine 2019 2020 2021 2030 CAGR (2022-2030)\r\nPumps & Valves
-
246.74 253.97 417.93 5.69%\r\nOthers 210.35 193.93 200.42 342.05 6.12%\r\nTotal
-
440.67 454.39 759.99 5.88%\r\nSource: Indiana Cast Metal Association
-
(INCMA), American Foundry Society (AFS), The North American Die Casting Association,
-
NON-FERROUS FOUNDERS’ SOCIETY, Aluminium Casters’ Association of India,
-
Casting Industry Suppliers Association, International Trade Centre, World Trade
-
Centre, Government Websites, Press Releases, Journals, Annual Reports, Whitepapers,
-
Company Websites, and MRFR Analysis\r\nThe pumps & valves segment dominated
-
the market with a share of 55.99%, accounting for 246.74 kilo tons in 2020; it is
-
projected to exhibit a CAGR of 5.69%. The Others segment accounted for a share of
-
% in 2020, sized at 193.93 kilo tons; it is projected to exhibit a higher CAGR
-
of 6.12%.\r\n9.3.4 SPAIN\r\nTABLE 149 SPAIN: METAL CASTING MARKET,
-
BY MATERIAL TYPE, 2022-2030 (USD MILLION)\r\nMaterial Type 2019 2020 2021
-
CAGR (2022-2030)\r\nCast Iron 1,915.49 1,755.69 1,810.56 3,038.18 5.92%\r\nAluminium
-
772.10 807.12 1,524.45 7.32%\r\nStainless Steel 353.92 328.74 343.54
-
7.29%\r\nZinc 128.27 118.31 122.77 218.03 6.59%\r\nMagnesium
-
105.62 109.13 186.43 6.13%\r\nCarbon Steel 74.00 67.37 69.00 108.32
-
%\r\nHigh Steel Alloy 103.53 94.76 97.58 161.57 5.76%\r\nOthers
-
206.57 209.40 294.81 3.87%\r\nTotal 3,750.33 3,449.16 3,569.10 6,178.82
-
%\r\nSource: Indiana Cast Metal Association (INCMA), American Foundry
-
Society (AFS), The North American Die Casting Association, NON-FERROUS FOUNDERS’
-
SOCIETY, Aluminium Casters’ Association of India, Casting Industry Suppliers
-
Association, International Trade Centre, World Trade Centre, Government Websites,
-
Press Releases, Journals, Annual Reports, Whitepapers, Company Websites, and MRFR
-
Analysis\r\nThe cast iron segment accounted for the largest market share
-
of 50.90% in 2020, with a market value of USD 1,755.7 million; it is expected to
-
register a CAGR of 5.92% during the forecast period. The aluminium segment accounted
-
for the second largest market share in 2020, valued at USD 772.1 million; it is
-
projected to register the highest CAGR of 7.32%.\r\n \r\nTABLE
-
SPAIN: METAL CASTING MARKET, BY MATERIAL TYPE, 2022-2030 (KILO TONS)\r\nMaterial
-
Type 2019 2020 2021 2030 CAGR (2022-2030)\r\nCast Iron 709.97 645.77 658.43
-
4.68%\r\nAluminium 301.63 278.14 287.47 488.30 6.06%\r\nStainless
-
Steel 122.18 112.62 116.36 197.09 6.03%\r\nZinc 45.62 41.76 42.84 68.43 5.34%\r\nMagnesium
-
37.05 37.85 58.16 4.89%\r\nCarbon Steel 27.29 24.65 24.96 35.24 3.91%\r\nHigh
-
Steel Alloy 37.97 34.49 35.12 52.29 4.52%\r\nOthers 84.94 75.98 76.15 96.42
-
%\r\nTotal 1,370.25 1,250.47 1,279.18 1,989.58 5.03%\r\nSource:
-
Indiana Cast Metal Association (INCMA), American Foundry Society (AFS), The North
-
American Die Casting Association, NON-FERROUS FOUNDERS’ SOCIETY, Aluminium
-
Casters’ Association of India, Casting Industry Suppliers Association, International
-
Trade Centre, World Trade Centre, Government Websites, Press Releases, Journals,
-
Annual Reports, Whitepapers, Company Websites, and MRFR Analysis\r\nThe cast
-
iron segment dominated the market with a share of 51.64%, accounting for 645.77
-
kilo tons in 2020; it is projected to exhibit a CAGR of 4.68%. The aluminium segment
-
was the second-largest with a share of 22.24% in 2020, sized at 278.14 kilo tons;
-
it is projected to exhibit the highest CAGR of 6.06%.\r\nTABLE 151 SPAIN:
-
METAL CASTING MARKET, BY PROCESS TYPE, 2022-2030 (USD MILLION)\r\nProcess
-
Type 2019 2020 2021 2030 CAGR (2022-2030)\r\nSand Casting 1,846.21 1,702.42
-
,766.24 3,129.65 6.56%\r\nDie Casting 861.12 797.43 830.81 1,526.29 6.99%\r\nShell
-
Mold Casting 284.34 260.12 267.73 441.12 5.71%\r\nGravity Casting 230.09
-
209.30 287.05 3.57%\r\nVacuum Casting 156.29 141.53 144.17 214.07
-
%\r\nInvestment Casting 229.71 210.88 217.82 371.01 6.10%\r\nOthers
-
129.83 133.02 209.64 5.18%\r\nTotal 3,750.33 3,449.16 3,569.10 6,178.82
-
%\r\nSource: Indiana Cast Metal Association (INCMA), American Foundry
-
Society (AFS), The North American Die Casting Association, NON-FERROUS FOUNDERS’
-
SOCIETY, Aluminium Casters’ Association of India, Casting Industry Suppliers
-
Association, International Trade Centre, World Trade Centre, Government Websites,
-
Press Releases, Journals, Annual Reports, Whitepapers, Company Websites, and MRFR
-
Analysis\r\nThe sand casting segment accounted for the largest market share
-
of 49.36% in 2020, with a market value of USD 1,702.4 million; it is expected to
-
register a CAGR of 6.56% during the forecast period. The die casting segment accounted
-
for the second largest market share in 2020, valued at USD 797.4 million; it is
-
projected to register the highest CAGR of 6.99%.\r\n \r\nTABLE
-
SPAIN: METAL CASTING MARKET, BY PROCESS TYPE, 2022-2030 (KILO TONS)\r\nProcess
-
Type 2019 2020 2021 2030 CAGR (2022-2030)\r\nSand Casting 699.00 639.65 656.13
-
,045.58 5.31%\r\nDie Casting 312.59 287.26 295.90 488.89 5.74%\r\nShell
-
Mold Casting 105.39 95.68 97.36 144.27 4.47%\r\nGravity Casting 81.02 72.31
-
89.19 2.36%\r\nVacuum Casting 53.95 48.49 48.83 65.21 3.27%\r\nInvestment
-
Casting 81.70 74.43 76.01 116.44 4.85%\r\nOthers 36.60 32.65 32.63 40.01
-
%\r\nTotal 1,370.25 1,250.47 1,279.18 1,989.58 5.03%\r\nSource:
-
Indiana Cast Metal Association (INCMA), American Foundry Society (AFS), The North
-
American Die Casting Association, NON-FERROUS FOUNDERS’ SOCIETY, Aluminium
-
Casters’ Association of India, Casting Industry Suppliers Association, International
-
Trade Centre, World Trade Centre, Government Websites, Press Releases, Journals,
-
Annual Reports, Whitepapers, Company Websites, and MRFR Analysis\r\nThe sand
-
casting segment dominated the market with a share of 51.15%, accounting for 639.65
-
kilo tons in 2020; it is projected to exhibit a CAGR of 5.31%. The die casting segment
-
was the second-largest with a share of 22.97% in 2020, sized at 287.26 kilo tons;
-
it is projected to exhibit the highest CAGR of 5.74%.\r\nTABLE 153 SPAIN:
-
METAL CASTING MARKET, BY END-USE INDUSTRY, 2022-2030 (USD MILLION)\r\nEnd-use
-
Industry 2019 2020 2021 2030 CAGR (2022-2030)\r\nAutomotive & Transportation
-
,478.46 1,365.02 1,417.95 2,539.86 6.69%\r\nBuilding & Construction
-
614.72 635.32 1,087.68 6.16%\r\nMining 472.24 432.16 444.96 735.65
-
%\r\nEquipment & Machine 632.78 582.25 602.79 1,048.07 6.34%\r\nConsumer
-
Goods 352.09 322.71 332.80 558.44 5.92%\r\nOthers 145.54 132.29 135.28 209.12
-
%\r\nTotal 3,750.33 3,449.16 3,569.10 6,178.82 6.29%\r\nSource:
-
Indiana Cast Metal Association (INCMA), American Foundry Society (AFS), The North
-
American Die Casting Association, NON-FERROUS FOUNDERS’ SOCIETY, Aluminium
-
Casters’ Association of India, Casting Industry Suppliers Association, International
-
Trade Centre, World Trade Centre, Government Websites, Press Releases, Journals,
-
Annual Reports, Whitepapers, Company Websites, and MRFR Analysis\r\nThe automotive
-
& transportation segment accounted for the largest market share of 39.58% in
-
, with a market value of USD 1,365.0 million; it is expected to register the
-
highest CAGR of 6.69% during the forecast period. The building & construction
-
segment accounted for the second largest market share in 2020, valued at USD 614.7
-
million; it is projected to exhibit a CAGR of 6.16%.\r\n \r\nTABLE
-
SPAIN: METAL CASTING MARKET, BY END-USE INDUSTRY, 2022-2030 (KILO TONS)\r\nEnd-use
-
Industry 2019 2020 2021 2030 CAGR (2022-2030)\r\nAutomotive & Transportation
-
502.08 515.65 830.68 5.44%\r\nBuilding & Construction 245.46 223.75
-
352.03 4.91%\r\nMining 169.67 154.09 156.86 233.23 4.51%\r\nEquipment
-
& Machine 229.70 209.75 214.69 335.71 5.09%\r\nConsumer Goods 125.23
-
116.14 175.26 4.68%\r\nOthers 52.21 46.89 47.20 62.68 3.20%\r\nTotal
-
,370.25 1,250.47 1,279.18 1,989.58 5.03%\r\nSource: Indiana Cast Metal Association
-
(INCMA), American Foundry Society (AFS), The North American Die Casting Association,
-
NON-FERROUS FOUNDERS’ SOCIETY, Aluminium Casters’ Association of India,
-
Casting Industry Suppliers Association, International Trade Centre, World Trade
-
Centre, Government Websites, Press Releases, Journals, Annual Reports, Whitepapers,
-
Company Websites, and MRFR Analysis\r\nThe automotive & transportation
-
segment dominated the market with a share of 40.15%, accounting for 502.08 kilo
-
tons in 2020; it is expected to register the highest CAGR of 5.44% from 2021 to
-
The building & construction segment was the second-largest with a share
-
of 17.89% in 2020, sized at 223.75 kilo tons; it is projected to exhibit a CAGR
-
of 4.91%.\r\nTABLE 155 SPAIN: METAL CASTING MARKET, BY AUTOMOTIVE & TRANSPORTATION,
-
2030 (USD MILLION)\r\nAutomotive & Transportation 2019 2020 2021
-
CAGR (2022-2030)\r\nGearbox 276.96 257.78 269.93 518.26 7.52%\r\nWheels
-
152.96 159.72 299.54 7.24%\r\nEngine Blocks 221.65 204.90 213.12 386.14
-
%\r\nCylinder Head 354.40 325.22 335.77 568.18 6.02%\r\nExhaust
-
Manifold 100.59 92.47 95.63 164.50 6.21%\r\nSeat Frame 121.77 112.29 116.50
-
6.56%\r\nOthers 238.29 219.40 227.27 396.85 6.39%\r\nTotal
-
,478.46 1,365.02 1,417.95 2,539.86 6.69%\r\nSource: Indiana Cast Metal Association
-
(INCMA), American Foundry Society (AFS), The North American Die Casting Association,
-
NON-FERROUS FOUNDERS’ SOCIETY, Aluminium Casters’ Association of India,
-
Casting Industry Suppliers Association, International Trade Centre, World Trade
-
Centre, Government Websites, Press Releases, Journals, Annual Reports, Whitepapers,
-
Company Websites, and MRFR Analysis\r\nThe cylinder head segment accounted
-
for the largest market share of 23.83% in 2020, with a market value of USD 325.2
-
million; it is expected to register a CAGR of 6.02% during the forecast period.
-
The gearbox segment accounted for the second largest market share in 2020, valued
-
at USD 257.8 million; it is projected to register the highest CAGR of 7.52%.\r\n \r\nTABLE
-
SPAIN: METAL CASTING MARKET, BY AUTOMOTIVE & TRANSPORTATION, 2022-2030 (KILO
-
TONS)\r\nAutomotive & Transportation 2019 2020 2021 2030 CAGR (2022-2030)\r\nGearbox
-
99.81 103.33 178.42 6.26%\r\nWheels 62.33 57.41 59.27 99.97 5.98%\r\nEngine
-
Blocks 85.58 78.51 80.73 131.55 5.57%\r\nCylinder Head 135.42 123.32 125.88
-
4.78%\r\nExhaust Manifold 37.66 34.35 35.13 54.35 4.97%\r\nSeat
-
Frame 45.13 41.30 42.37 67.50 5.31%\r\nOthers 73.81 67.38 68.94 107.32 5.04%\r\nTotal
-
502.08 515.65 830.68 5.44%\r\nSource: Indiana Cast Metal Association
-
(INCMA), American Foundry Society (AFS), The North American Die Casting Association,
-
NON-FERROUS FOUNDERS’ SOCIETY, Aluminium Casters’ Association of India,
-
Casting Industry Suppliers Association, International Trade Centre, World Trade
-
Centre, Government Websites, Press Releases, Journals, Annual Reports, Whitepapers,
-
Company Websites, and MRFR Analysis\r\nThe cylinder head segment dominated
-
the market with a share of 24.56%, accounting for 123.32 kilo tons in 2020; it is
-
projected to exhibit a CAGR of 4.78%. The Gearbox segment was the second-largest
-
with a share of 19.88% in 2020, sized at 99.81 kilo tons; it is projected to exhibit
-
the highest CAGR of 6.26%.\r\nTABLE 157 SPAIN: METAL CASTING MARKET, BY EQUIPMENT
-
& MACHINE, 2022-2030 (USD MILLION)\r\nEquipment & Machine 2019 2020
-
2030 CAGR (2022-2030)\r\nPumps & Valves 350.76 322.17 332.94 569.55
-
%\r\nOthers 282.02 260.07 269.84 478.52 6.57%\r\nTotal 632.78
-
602.79 1,048.07 6.34%\r\nSource: Indiana Cast Metal Association (INCMA),
-
American Foundry Society (AFS), The North American Die Casting Association, NON-FERROUS
-
FOUNDERS’ SOCIETY, Aluminium Casters’ Association of India, Casting
-
Industry Suppliers Association, International Trade Centre, World Trade Centre,
-
Government Websites, Press Releases, Journals, Annual Reports, Whitepapers, Company
-
Websites, and MRFR Analysis\r\nThe pumps & valves segment accounted for
-
a larger market share of 55.33% in 2020, with a market value of USD 322.2 million;
-
it is expected to register a CAGR of 6.15% during the forecast period. The Others
-
segment was valued at USD 260.1 million; it is projected to register a higher CAGR
-
of 6.57%.\r\n \r\nTABLE 158 SPAIN: METAL CASTING MARKET, BY EQUIPMENT
-
& MACHINE, 2022-2030 (KILO TONS)\r\nEquipment & Machine 2019 2020
-
2030 CAGR (2022-2030)\r\nPumps & Valves 128.61 117.23 119.78 184.28
-
%\r\nOthers 101.09 92.52 94.91 151.43 5.33%\r\nTotal 229.70 209.75
-
335.71 5.09%\r\nSource: Indiana Cast Metal Association (INCMA), American
-
Foundry Society (AFS), The North American Die Casting Association, NON-FERROUS FOUNDERS’
-
SOCIETY, Aluminium Casters’ Association of India, Casting Industry Suppliers
-
Association, International Trade Centre, World Trade Centre, Government Websites,
-
Press Releases, Journals, Annual Reports, Whitepapers, Company Websites, and MRFR
-
Analysis\r\nThe pumps & valves segment dominated the market with a share
-
of 55.89%, accounting for 117.23 kilo tons in 2020; it is projected to exhibit a
-
CAGR of 4.90%. The Others segment accounted for a share of 44.11% in 2020, sized
-
at 92.52 kilo tons; it is projected to exhibit a higher CAGR of 5.33%.\r\n9.3.5
-
ITALY\r\nTABLE 159 ITALY: METAL CASTING MARKET, BY MATERIAL TYPE, 2022-2030
-
(USD MILLION)\r\nMaterial Type 2019 2020 2021 2030 CAGR (2022-2030)\r\nCast
-
Iron 2,215.84 2,050.00 2,133.88 3,895.85 6.92%\r\nAluminium 968.55 908.40
-
1,969.76 8.33%\r\nStainless Steel 412.12 384.69 403.99 798.22 7.86%\r\nZinc
-
164.51 172.24 331.52 7.55%\r\nMagnesium 165.11 153.09 159.71 297.61
-
%\r\nCarbon Steel 87.53 80.44 83.17 142.33 6.15%\r\nHigh Steel
-
Alloy 114.24 105.51 109.65 197.08 6.73%\r\nOthers 225.90 206.37 212.07 340.48
-
%\r\nTotal 4,366.07 4,053.02 4,233.22 7,972.85 7.29%\r\nSource:
-
Indiana Cast Metal Association (INCMA), American Foundry Society (AFS), The North
-
American Die Casting Association, NON-FERROUS FOUNDERS’ SOCIETY, Aluminium
-
Casters’ Association of India, Casting Industry Suppliers Association, International
-
Trade Centre, World Trade Centre, Government Websites, Press Releases, Journals,
-
Annual Reports, Whitepapers, Company Websites, and MRFR Analysis\r\nThe cast
-
iron segment accounted for the largest market share of 50.58% in 2020, with a market
-
value of USD 2,050.0 million; it is expected to register a CAGR of 6.92% during
-
the forecast period. The aluminium segment accounted for the second largest market
-
share in 2020, valued at USD 908.4 million; it is projected to register the highest
-
CAGR of 8.33%.\r\n \r\nTABLE 160 ITALY: METAL CASTING MARKET,
-
BY MATERIAL TYPE, 2022-2030 (KILO TONS)\r\nMaterial Type 2019 2020 2021 2030
-
CAGR (2022-2030)\r\nCast Iron 828.67 760.81 782.98 1,285.61 5.66%\r\nAluminium
-
330.18 344.45 636.61 7.06%\r\nStainless Steel 143.55 132.97 138.06
-
6.60%\r\nZinc 63.44 58.59 60.65 104.98 6.29%\r\nMagnesium 58.90
-
55.90 93.68 5.90%\r\nCarbon Steel 32.56 29.70 30.36 46.72 4.91%\r\nHigh
-
Steel Alloy 42.28 38.75 39.81 64.36 5.48%\r\nOthers 84.48 76.59 77.81 112.36
-
%\r\nTotal 1,608.62 1,481.77 1,530.03 2,589.65 6.02%\r\nSource:
-
Indiana Cast Metal Association (INCMA), American Foundry Society (AFS), The North
-
American Die Casting Association, NON-FERROUS FOUNDERS’ SOCIETY, Aluminium
-
Casters’ Association of India, Casting Industry Suppliers Association, International
-
Trade Centre, World Trade Centre, Government Websites, Press Releases, Journals,
-
Annual Reports, Whitepapers, Company Websites, and MRFR Analysis\r\nThe cast
-
iron segment dominated the market with a share of 51.34%, accounting for 760.81
-
kilo tons in 2020; it is projected to exhibit a CAGR of 5.66%. The aluminium segment
-
was the second-largest with a share of 22.28% in 2020, sized at 330.18 kilo tons;
-
it is projected to exhibit the highest CAGR of 7.06%.\r\nTABLE 161 ITALY:
-
METAL CASTING MARKET, BY PROCESS TYPE, 2022-2030 (USD MILLION)\r\nProcess
-
Type 2019 2020 2021 2030 CAGR (2022-2030)\r\nSand Casting 2,265.87 2,108.70
-
,207.98 4,252.18 7.55%\r\nDie Casting 967.26 903.94 950.44 1,896.89 7.98%\r\nShell
-
Mold Casting 293.04 270.41 280.74 500.09 6.63%\r\nGravity Casting 281.22
-
261.20 394.93 4.70%\r\nVacuum Casting 139.12 126.57 129.50 198.21
-
%\r\nInvestment Casting 260.96 241.81 252.10 467.10 7.09%\r\nOthers
-
146.02 151.25 263.46 6.36%\r\nTotal 4,366.07 4,053.02 4,233.22 7,972.85
-
%\r\nSource: Indiana Cast Metal Association (INCMA), American Foundry
-
Society (AFS), The North American Die Casting Association, NON-FERROUS FOUNDERS’
-
SOCIETY, Aluminium Casters’ Association of India, Casting Industry Suppliers
-
Association, International Trade Centre, World Trade Centre, Government Websites,
-
Press Releases, Journals, Annual Reports, Whitepapers, Company Websites, and MRFR
-
Analysis\r\nThe sand casting segment accounted for the largest market share
-
of 52.03% in 2020, with a market value of USD 2,108.7 million; it is expected to
-
register a CAGR of 7.55% during the forecast period. The die casting segment accounted
-
for the second largest market share in 2020, valued at USD 903.9 million; it is
-
projected to register the highest CAGR of 7.98%.\r\n \r\nTABLE
-
ITALY: METAL CASTING MARKET, BY PROCESS TYPE, 2022-2030 (KILO TONS)\r\nProcess
-
Type 2019 2020 2021 2030 CAGR (2022-2030)\r\nSand Casting 865.60 799.42 827.60
-
,433.38 6.29%\r\nDie Casting 354.27 328.56 341.55 613.06 6.72%\r\nShell
-
Mold Casting 109.59 100.36 103.01 165.03 5.38%\r\nGravity Casting 99.91 90.11
-
123.81 3.47%\r\nVacuum Casting 48.46 43.75 44.26 60.92 3.61%\r\nInvestment
-
Casting 93.65 86.12 88.77 147.91 5.84%\r\nOthers 37.14 33.47 33.79 45.54
-
%\r\nTotal 1,608.62 1,481.77 1,530.03 2,589.65 6.02%\r\nSource:
-
Indiana Cast Metal Association (INCMA), American Foundry Society (AFS), The North
-
American Die Casting Association, NON-FERROUS FOUNDERS’ SOCIETY, Aluminium
-
Casters’ Association of India, Casting Industry Suppliers Association, International
-
Trade Centre, World Trade Centre, Government Websites, Press Releases, Journals,
-
Annual Reports, Whitepapers, Company Websites, and MRFR Analysis\r\nThe sand
-
casting segment dominated the market with a share of 53.95%, accounting for 799.42
-
kilo tons in 2020; it is projected to exhibit a CAGR of 6.29%. The die casting segment
-
was the second-largest with a share of 22.17% in 2020, sized at 328.56 kilo tons;
-
it is projected to exhibit the highest CAGR of 6.72%.\r\nTABLE 163 ITALY:
-
METAL CASTING MARKET, BY END-USE INDUSTRY, 2022-2030 (USD MILLION)\r\nEnd-use
-
Industry 2019 2020 2021 2030 CAGR (2022-2030)\r\nAutomotive & Transportation
-
,753.08 1,633.64 1,712.80 3,336.46 7.69%\r\nBuilding & Construction
-
703.34 733.71 1,366.55 7.15%\r\nMining 469.07 432.93 449.56 802.35
-
%\r\nEquipment & Machine 602.24 559.42 584.67 1,107.55 7.36%\r\nConsumer
-
Goods 529.99 490.69 511.17 939.92 7.00%\r\nOthers 253.09 232.99 241.31 420.02
-
%\r\nTotal 4,366.07 4,053.02 4,233.22 7,972.85 7.29%\r\nSource:
-
Indiana Cast Metal Association (INCMA), American Foundry Society (AFS), The North
-
American Die Casting Association, NON-FERROUS FOUNDERS’ SOCIETY, Aluminium
-
Casters’ Association of India, Casting Industry Suppliers Association, International
-
Trade Centre, World Trade Centre, Government Websites, Press Releases, Journals,
-
Annual Reports, Whitepapers, Company Websites, and MRFR Analysis\r\nThe automotive
-
& transportation segment accounted for the largest market share of 40.31% in
-
, with a market value of USD 1,633.6 million; it is expected to register the
-
highest CAGR of 7.69% during the forecast period. The building & construction
-
segment accounted for the second largest market share in 2020, valued at USD 703.3
-
million; it is projected to exhibit a CAGR of 7.15%.\r\n \r\nTABLE
-
ITALY: METAL CASTING MARKET, BY END-USE INDUSTRY, 2022-2030 (KILO TONS)\r\nEnd-use
-
Industry 2019 2020 2021 2030 CAGR (2022-2030)\r\nAutomotive & Transportation
-
606.28 628.48 1,101.02 6.43%\r\nBuilding & Construction 280.74
-
266.41 446.26 5.90%\r\nMining 170.05 155.75 159.91 256.67 5.40%\r\nEquipment
-
& Machine 220.58 203.34 210.11 357.95 6.10%\r\nConsumer Goods 190.19
-
179.98 297.64 5.75%\r\nOthers 91.44 83.34 85.14 130.12 4.83%\r\nTotal
-
,608.62 1,481.77 1,530.03 2,589.65 6.02%\r\nSource: Indiana Cast Metal Association
-
(INCMA), American Foundry Society (AFS), The North American Die Casting Association,
-
NON-FERROUS FOUNDERS’ SOCIETY, Aluminium Casters’ Association of India,
-
Casting Industry Suppliers Association, International Trade Centre, World Trade
-
Centre, Government Websites, Press Releases, Journals, Annual Reports, Whitepapers,
-
Company Websites, and MRFR Analysis\r\nThe automotive & transportation
-
segment dominated the market with a share of 40.92%, accounting for 606.28 kilo
-
tons in 2020; it is expected to register the highest CAGR of 6.43% from 2021 to
-
The building & construction segment was the second-largest with a share
-
of 17.43% in 2020, sized at 258.31 kilo tons; it is projected to exhibit a CAGR
-
of 5.90%.\r\nTABLE 165 ITALY: METAL CASTING MARKET, BY AUTOMOTIVE & TRANSPORTATION,
-
2030 (USD MILLION)\r\nAutomotive & Transportation 2019 2020 2021
-
CAGR (2022-2030)\r\nGearbox 335.16 314.81 332.67 693.67 8.51%\r\nWheels
-
174.94 184.42 376.91 8.27%\r\nEngine Blocks 233.45 217.86 228.74 451.34
-
%\r\nCylinder Head 416.94 386.16 402.38 740.12 7.01%\r\nExhaust
-
Manifold 117.53 109.04 113.82 212.79 7.20%\r\nSeat Frame 143.72 133.77 140.08
-
7.56%\r\nOthers 319.57 297.07 310.69 591.77 7.42%\r\nTotal
-
,753.08 1,633.64 1,712.80 3,336.46 7.69%\r\nSource: Indiana Cast Metal Association
-
(INCMA), American Foundry Society (AFS), The North American Die Casting Association,
-
NON-FERROUS FOUNDERS’ SOCIETY, Aluminium Casters’ Association of India,
-
Casting Industry Suppliers Association, International Trade Centre, World Trade
-
Centre, Government Websites, Press Releases, Journals, Annual Reports, Whitepapers,
-
Company Websites, and MRFR Analysis\r\nThe cylinder head segment accounted
-
for the largest market share of 23.64% in 2020, with a market value of USD 386.2
-
million; it is expected to register a CAGR of 7.01% during the forecast period.
-
The gearbox segment accounted for the second largest market share in 2020, valued
-
at USD 314.8 million; it is projected to register the highest CAGR of 8.51%.\r\n \r\nTABLE
-
ITALY: METAL CASTING MARKET, BY AUTOMOTIVE & TRANSPORTATION, 2022-2030 (KILO
-
TONS)\r\nAutomotive & Transportation 2019 2020 2021 2030 CAGR (2022-2030)\r\nGearbox
-
122.98 128.49 240.96 7.24%\r\nWheels 71.25 66.25 69.05 126.92 7.00%\r\nEngine
-
Blocks 90.94 84.22 87.43 155.15 6.58%\r\nCylinder Head 160.75 147.75 152.21
-
5.75%\r\nExhaust Manifold 44.40 40.88 42.18 70.93 5.94%\r\nSeat
-
Frame 53.75 49.64 51.40 89.05 6.30%\r\nOthers 102.59 94.56 97.71 166.23 6.08%\r\nTotal
-
606.28 628.48 1,101.02 6.43%\r\nSource: Indiana Cast Metal Association
-
(INCMA), American Foundry Society (AFS), The North American Die Casting Association,
-
NON-FERROUS FOUNDERS’ SOCIETY, Aluminium Casters’ Association of India,
-
Casting Industry Suppliers Association, International Trade Centre, World Trade
-
Centre, Government Websites, Press Releases, Journals, Annual Reports, Whitepapers,
-
Company Websites, and MRFR Analysis\r\nThe cylinder head segment dominated
-
the market with a share of 24.37%, accounting for 147.75 kilo tons in 2020; it is
-
projected to exhibit a CAGR of 5.75%. The Gearbox segment was the second-largest
-
with a share of 20.28% in 2020, sized at 122.98 kilo tons; it is projected to exhibit
-
the highest CAGR of 7.24%.\r\nTABLE 167 ITALY: METAL CASTING MARKET, BY EQUIPMENT
-
& MACHINE, 2022-2030 (USD MILLION)\r\nEquipment & Machine 2019 2020
-
2030 CAGR (2022-2030)\r\nPumps & Valves 341.14 316.33 330.03 615.31
-
%\r\nOthers 261.10 243.09 254.64 492.24 7.60%\r\nTotal 602.24
-
584.67 1,107.55 7.36%\r\nSource: Indiana Cast Metal Association (INCMA),
-
American Foundry Society (AFS), The North American Die Casting Association, NON-FERROUS
-
FOUNDERS’ SOCIETY, Aluminium Casters’ Association of India, Casting
-
Industry Suppliers Association, International Trade Centre, World Trade Centre,
-
Government Websites, Press Releases, Journals, Annual Reports, Whitepapers, Company
-
Websites, and MRFR Analysis\r\nThe pumps & valves segment accounted for
-
a larger market share of 56.55% in 2020, with a market value of USD 316.3 million;
-
it is expected to register a CAGR of 7.17% during the forecast period. The Others
-
segment was valued at USD 243.1 million; it is projected to register a higher CAGR
-
of 7.60%.\r\n \r\nTABLE 168 ITALY: METAL CASTING MARKET, BY EQUIPMENT
-
& MACHINE, 2022-2030 (KILO TONS)\r\nEquipment & Machine 2019 2020
-
2030 CAGR (2022-2030)\r\nPumps & Valves 126.21 116.14 119.80 200.87
-
%\r\nOthers 94.37 87.20 90.31 157.08 6.34%\r\nTotal 220.58 203.34
-
357.95 6.10%\r\nSource: Indiana Cast Metal Association (INCMA), American
-
Foundry Society (AFS), The North American Die Casting Association, NON-FERROUS FOUNDERS’
-
SOCIETY, Aluminium Casters’ Association of India, Casting Industry Suppliers
-
Association, International Trade Centre, World Trade Centre, Government Websites,
-
Press Releases, Journals, Annual Reports, Whitepapers, Company Websites, and MRFR
-
Analysis\r\nThe pumps & valves segment dominated the market with a share
-
of 57.12%, accounting for 116.14 kilo tons in 2020; it is projected to exhibit a
-
CAGR of 5.91%. The Others segment accounted for a share of 42.88% in 2020, sized
-
at 87.20 kilo tons; it is projected to exhibit a higher CAGR of 6.34%.\r\n9.3.6
-
RUSSIA\r\nTABLE 169 RUSSIA: METAL CASTING MARKET, BY MATERIAL TYPE, 2022-2030
-
(USD MILLION)\r\nMaterial Type 2019 2020 2021 2030 CAGR (2022-2030)\r\nCast
-
Iron 1,683.72 1,546.64 1,598.51 2,738.50 6.16%\r\nAluminium 749.81 698.24
-
1,410.44 7.57%\r\nStainless Steel 348.70 324.33 339.39 648.19 7.45%\r\nZinc
-
155.17 161.24 290.11 6.74%\r\nMagnesium 96.82 89.11 92.28 160.91 6.37%\r\nCarbon
-
Steel 37.68 34.11 34.74 51.26 4.42%\r\nHigh Steel Alloy 69.96 64.08 66.03
-
5.84%\r\nOthers 206.64 186.71 189.72 273.31 4.14%\r\nTotal
-
,361.34 3,098.38 3,213.42 5,682.76 6.54%\r\nSource: Indiana Cast Metal Association
-
(INCMA), American Foundry Society (AFS), The North American Die Casting Association,
-
NON-FERROUS FOUNDERS’ SOCIETY, Aluminium Casters’ Association of India,
-
Casting Industry Suppliers Association, International Trade Centre, World Trade
-
Centre, Government Websites, Press Releases, Journals, Annual Reports, Whitepapers,
-
Company Websites, and MRFR Analysis\r\nThe cast iron segment accounted for
-
the largest market share of 49.92% in 2020, with a market value of USD 1,546.6 million;
-
it is expected to register a CAGR of 6.16% during the forecast period. The aluminium
-
segment accounted for the second largest market share in 2020, valued at USD 698.2
-
million; it is projected to register the highest CAGR of 7.57%.\r\n \r\nTABLE
-
RUSSIA: METAL CASTING MARKET, BY MATERIAL TYPE, 2022-2030 (KILO TONS)\r\nMaterial
-
Type 2019 2020 2021 2030 CAGR (2022-2030)\r\nCast Iron 628.42 572.85 585.37
-
4.92%\r\nAluminium 274.08 253.28 262.35 454.93 6.31%\r\nStainless
-
Steel 121.21 111.88 115.76 198.82 6.19%\r\nZinc 60.17 55.15 56.66 91.68 5.49%\r\nMagnesium
-
31.48 32.23 50.55 5.13%\r\nCarbon Steel 13.99 12.57 12.65 16.79 3.19%\r\nHigh
-
Steel Alloy 25.84 23.49 23.93 35.87 4.60%\r\nOthers 77.13 69.15 69.48 90.01
-
%\r\nTotal 1,235.31 1,129.86 1,158.43 1,840.55 5.28%\r\nSource:
-
Indiana Cast Metal Association (INCMA), American Foundry Society (AFS), The North
-
American Die Casting Association, NON-FERROUS FOUNDERS’ SOCIETY, Aluminium
-
Casters’ Association of India, Casting Industry Suppliers Association, International
-
Trade Centre, World Trade Centre, Government Websites, Press Releases, Journals,
-
Annual Reports, Whitepapers, Company Websites, and MRFR Analysis\r\nThe cast
-
iron segment dominated the market with a share of 50.70%, accounting for 572.85
-
kilo tons in 2020; it is projected to exhibit a CAGR of 4.92%. The aluminium segment
-
was the second-largest with a share of 22.42% in 2020, sized at 253.28 kilo tons;
-
it is projected to exhibit the highest CAGR of 6.31%.\r\nTABLE 171 RUSSIA:
-
METAL CASTING MARKET, BY PROCESS TYPE, 2022-2030 (USD MILLION)\r\nProcess
-
Type 2019 2020 2021 2030 CAGR (2022-2030)\r\nSand Casting 1,648.27 1,523.34
-
,584.05 2,867.40 6.82%\r\nDie Casting 763.12 708.01 739.06 1,382.70 7.21%\r\nShell
-
Mold Casting 291.83 267.75 276.39 468.17 6.03%\r\nGravity Casting 213.46
-
195.36 276.31 3.93%\r\nVacuum Casting 114.55 103.61 105.41 153.82
-
%\r\nInvestment Casting 193.62 178.14 184.40 320.53 6.34%\r\nOthers
-
124.97 128.74 213.83 5.80%\r\nTotal 3,361.34 3,098.38 3,213.42 5,682.76
-
%\r\nSource: Indiana Cast Metal Association (INCMA), American Foundry
-
Society (AFS), The North American Die Casting Association, NON-FERROUS FOUNDERS’
-
SOCIETY, Aluminium Casters’ Association of India, Casting Industry Suppliers
-
Association, International Trade Centre, World Trade Centre, Government Websites,
-
Press Releases, Journals, Annual Reports, Whitepapers, Company Websites, and MRFR
-
Analysis\r\nThe sand casting segment accounted for the largest market share
-
of 49.17% in 2020, with a market value of USD 1,523.3 million; it is expected to
-
register a CAGR of 6.82% during the forecast period. The die casting segment accounted
-
for the second largest market share in 2020, valued at USD 708.0 million; it is
-
projected to register the highest CAGR of 7.21%.\r\n \r\nTABLE
-
RUSSIA: METAL CASTING MARKET, BY PROCESS TYPE, 2022-2030 (KILO TONS)\r\nProcess
-
Type 2019 2020 2021 2030 CAGR (2022-2030)\r\nSand Casting 628.42 576.36 592.55
-
5.56%\r\nDie Casting 278.95 256.83 265.06 445.99 5.95%\r\nShell
-
Mold Casting 108.92 99.17 101.22 154.19 4.79%\r\nGravity Casting 75.69 67.76
-
86.45 2.71%\r\nVacuum Casting 39.82 35.74 35.95 47.18 3.07%\r\nInvestment
-
Casting 69.35 63.31 64.80 101.30 5.09%\r\nOthers 34.17 30.69 30.89 40.79
-
%\r\nTotal 1,235.31 1,129.86 1,158.43 1,840.55 5.28%\r\nSource:
-
Indiana Cast Metal Association (INCMA), American Foundry Society (AFS), The North
-
American Die Casting Association, NON-FERROUS FOUNDERS’ SOCIETY, Aluminium
-
Casters’ Association of India, Casting Industry Suppliers Association, International
-
Trade Centre, World Trade Centre, Government Websites, Press Releases, Journals,
-
Annual Reports, Whitepapers, Company Websites, and MRFR Analysis\r\nThe sand
-
casting segment dominated the market with a share of 51.01%, accounting for 576.36
-
kilo tons in 2020; it is projected to exhibit a CAGR of 5.56%. The die casting segment
-
was the second-largest with a share of 22.73% in 2020, sized at 256.83 kilo tons;
-
it is projected to exhibit the highest CAGR of 5.95%.\r\nTABLE 173 RUSSIA:
-
METAL CASTING MARKET, BY END-USE INDUSTRY, 2022-2030 (USD MILLION)\r\nEnd-use
-
Industry 2019 2020 2021 2030 CAGR (2022-2030)\r\nAutomotive & Transportation
-
,330.44 1,231.10 1,281.72 2,344.84 6.94%\r\nBuilding & Construction
-
570.28 590.74 1,033.47 6.41%\r\nMining 337.11 308.82 318.29 531.17
-
%\r\nEquipment & Machine 534.60 493.04 511.61 908.97 6.59%\r\nConsumer
-
Goods 385.55 354.40 366.52 631.80 6.24%\r\nOthers 154.23 140.76 144.53 232.51
-
%\r\nTotal 3,361.34 3,098.38 3,213.42 5,682.76 6.54%\r\nSource:
-
Indiana Cast Metal Association (INCMA), American Foundry Society (AFS), The North
-
American Die Casting Association, NON-FERROUS FOUNDERS’ SOCIETY, Aluminium
-
Casters’ Association of India, Casting Industry Suppliers Association, International
-
Trade Centre, World Trade Centre, Government Websites, Press Releases, Journals,
-
Annual Reports, Whitepapers, Company Websites, and MRFR Analysis\r\nThe automotive
-
& transportation segment accounted for the largest market share of 39.73% in
-
, with a market value of USD 1,231.1 million; it is expected to register the
-
highest CAGR of 6.94% during the forecast period. The building & construction
-
segment accounted for the second largest market share in 2020, valued at USD 570.3
-
million; it is projected to exhibit a CAGR of 6.41%.\r\n \r\nTABLE
-
RUSSIA: METAL CASTING MARKET, BY END-USE INDUSTRY, 2022-2030 (KILO TONS)\r\nEnd-use
-
Industry 2019 2020 2021 2030 CAGR (2022-2030)\r\nAutomotive & Transportation
-
455.98 469.36 772.24 5.69%\r\nBuilding & Construction 228.78 209.02
-
336.82 5.16%\r\nMining 121.97 110.88 112.99 169.58 4.61%\r\nEquipment
-
& Machine 195.42 178.85 183.49 293.19 5.35%\r\nConsumer Goods 138.09
-
128.80 199.67 4.99%\r\nOthers 54.50 49.17 49.72 69.05 3.72%\r\nTotal
-
,235.31 1,129.86 1,158.43 1,840.55 5.28%\r\nSource: Indiana Cast Metal Association
-
(INCMA), American Foundry Society (AFS), The North American Die Casting Association,
-
NON-FERROUS FOUNDERS’ SOCIETY, Aluminium Casters’ Association of India,
-
Casting Industry Suppliers Association, International Trade Centre, World Trade
-
Centre, Government Websites, Press Releases, Journals, Annual Reports, Whitepapers,
-
Company Websites, and MRFR Analysis\r\nThe automotive & transportation
-
segment dominated the market with a share of 40.36%, accounting for 455.98 kilo
-
tons in 2020; it is expected to register the highest CAGR of 5.69% from 2021 to
-
The building & construction segment was the second-largest with a share
-
of 18.50% in 2020, sized at 209.02 kilo tons; it is projected to exhibit a CAGR
-
of 5.16%.\r\nTABLE 175 RUSSIA: METAL CASTING MARKET, BY AUTOMOTIVE &
-
TRANSPORTATION, 2022-2030 (USD MILLION)\r\nAutomotive & Transportation
-
2020 2021 2030 CAGR (2022-2030)\r\nGearbox 241.94 225.75 236.98 465.62
-
%\r\nWheels 143.59 133.59 139.84 268.23 7.51%\r\nEngine Blocks
-
171.93 179.25 331.97 7.09%\r\nCylinder Head 304.73 280.19 289.84 499.54
-
%\r\nExhaust Manifold 91.16 83.99 87.07 153.01 6.47%\r\nSeat Frame
-
102.59 106.68 193.05 6.81%\r\nOthers 252.47 233.07 242.08 433.41 6.69%\r\nTotal
-
,330.44 1,231.10 1,281.72 2,344.84 6.94%\r\nSource: Indiana Cast Metal Association
-
(INCMA), American Foundry Society (AFS), The North American Die Casting Association,
-
NON-FERROUS FOUNDERS’ SOCIETY, Aluminium Casters’ Association of India,
-
Casting Industry Suppliers Association, International Trade Centre, World Trade
-
Centre, Government Websites, Press Releases, Journals, Annual Reports, Whitepapers,
-
Company Websites, and MRFR Analysis\r\nThe cylinder head segment accounted
-
for the largest market share of 22.76% in 2020, with a market value of USD 280.2
-
million; it is expected to register a CAGR of 6.24% during the forecast period.
-
The gearbox segment accounted for the second largest market share in 2020, valued
-
at USD 225.7 million; it is projected to register the highest CAGR of 7.79%.\r\n \r\nTABLE
-
RUSSIA: METAL CASTING MARKET, BY AUTOMOTIVE & TRANSPORTATION, 2022-2030
-
(KILO TONS)\r\nAutomotive & Transportation 2019 2020 2021 2030 CAGR (2022-2030)\r\nGearbox
-
88.02 91.35 161.42 6.53%\r\nWheels 54.68 50.49 52.25 90.14 6.25%\r\nEngine
-
Blocks 72.14 66.33 68.37 113.89 5.83%\r\nCylinder Head 117.25 106.99 109.42
-
4.99%\r\nExhaust Manifold 34.37 31.42 32.21 50.90 5.22%\r\nSeat
-
Frame 41.43 38.00 39.06 63.58 5.56%\r\nOthers 81.64 74.74 76.70 122.71 5.36%\r\nTotal
-
455.98 469.36 772.24 5.69%\r\nSource: Indiana Cast Metal Association
-
(INCMA), American Foundry Society (AFS), The North American Die Casting Association,
-
NON-FERROUS FOUNDERS’ SOCIETY, Aluminium Casters’ Association of India,
-
Casting Industry Suppliers Association, International Trade Centre, World Trade
-
Centre, Government Websites, Press Releases, Journals, Annual Reports, Whitepapers,
-
Company Websites, and MRFR Analysis\r\nThe cylinder head segment dominated
-
the market with a share of 23.46%, accounting for 106.99 kilo tons in 2020; it is
-
projected to exhibit a CAGR of 4.99%. The Gearbox segment was the second-largest
-
with a share of 19.30% in 2020, sized at 88.02 kilo tons; it is projected to exhibit
-
the highest CAGR of 6.53%.\r\nTABLE 177 RUSSIA: METAL CASTING MARKET, BY
-
EQUIPMENT & MACHINE, 2022-2030 (USD MILLION)\r\nEquipment & Machine
-
2020 2021 2030 CAGR (2022-2030)\r\nPumps & Valves 303.90 279.78
-
506.81 6.41%\r\nOthers 230.70 213.26 221.79 402.16 6.84%\r\nTotal
-
493.04 511.61 908.97 6.59%\r\nSource: Indiana Cast Metal Association
-
(INCMA), American Foundry Society (AFS), The North American Die Casting Association,
-
NON-FERROUS FOUNDERS’ SOCIETY, Aluminium Casters’ Association of India,
-
Casting Industry Suppliers Association, International Trade Centre, World Trade
-
Centre, Government Websites, Press Releases, Journals, Annual Reports, Whitepapers,
-
Company Websites, and MRFR Analysis\r\nThe pumps & valves segment accounted
-
for a larger market share of 56.75% in 2020, with a market value of USD 279.8 million;
-
it is expected to register a CAGR of 6.41% during the forecast period. The Others
-
segment was valued at USD 213.3 million; it is projected to register a higher CAGR
-
of 6.84%.\r\n \r\nTABLE 178 RUSSIA: METAL CASTING MARKET, BY
-
EQUIPMENT & MACHINE, 2022-2030 (KILO TONS)\r\nEquipment & Machine
-
2020 2021 2030 CAGR (2022-2030)\r\nPumps & Valves 112.21 102.52
-
165.12 5.16%\r\nOthers 83.21 76.33 78.50 128.06 5.59%\r\nTotal
-
178.85 183.49 293.19 5.35%\r\nSource: Indiana Cast Metal Association
-
(INCMA), American Foundry Society (AFS), The North American Die Casting Association,
-
NON-FERROUS FOUNDERS’ SOCIETY, Aluminium Casters’ Association of India,
-
Casting Industry Suppliers Association, International Trade Centre, World Trade
-
Centre, Government Websites, Press Releases, Journals, Annual Reports, Whitepapers,
-
Company Websites, and MRFR Analysis\r\nThe pumps & valves segment dominated
-
the market with a share of 57.32%, accounting for 102.52 kilo tons in 2020; it is
-
projected to exhibit a CAGR of 5.16%. The Others segment accounted for a share of
-
% in 2020, sized at 76.33 kilo tons; it is projected to exhibit a higher CAGR
-
of 5.59%.\r\n9.3.7 REST OF EUROPE\r\nTABLE 179 REST OF EUROPE: METAL
-
CASTING MARKET, BY MATERIAL TYPE, 2022-2030 (USD MILLION)\r\nMaterial Type
-
2020 2021 2030 CAGR (2022-2030)\r\nCast Iron 4,607.58 4,214.02 4,336.15
-
,124.11 5.67%\r\nAluminium 1,888.92 1,752.34 1,828.78 3,396.82 7.12%\r\nStainless
-
Steel 963.96 892.37 929.37 1,697.17 6.92%\r\nZinc 328.29 302.08 312.74 542.84
-
%\r\nMagnesium 215.72 197.60 203.64 339.42 5.84%\r\nCarbon Steel
-
151.04 154.24 235.42 4.81%\r\nHigh Steel Alloy 234.99 214.55 220.39
-
5.48%\r\nOthers 589.55 530.95 537.81 753.21 3.81%\r\nTotal
-
,995.40 8,254.96 8,523.13 14,445.33 6.04%\r\nSource: Indiana Cast Metal
-
Association (INCMA), American Foundry Society (AFS), The North American Die Casting
-
Association, NON-FERROUS FOUNDERS’ SOCIETY, Aluminium Casters’ Association
-
of India, Casting Industry Suppliers Association, International Trade Centre, World
-
Trade Centre, Government Websites, Press Releases, Journals, Annual Reports, Whitepapers,
-
Company Websites, and MRFR Analysis\r\nThe cast iron segment accounted for
-
the largest market share of 51.05% in 2020, with a market value of USD 4,214.0 million;
-
it is expected to register a CAGR of 5.67% during the forecast period. The aluminium
-
segment accounted for the second largest market share in 2020, valued at USD 1,752.3
-
million; it is projected to register the highest CAGR of 7.12%.\r\n \r\nTABLE
-
REST OF EUROPE: METAL CASTING MARKET, BY MATERIAL TYPE, 2022-2030 (KILO TONS)\r\nMaterial
-
Type 2019 2020 2021 2030 CAGR (2022-2030)\r\nCast Iron 1,742.27 1,581.31
-
,608.74 2,377.05 4.43%\r\nAluminium 699.53 644.01 664.50 1,110.02 5.87%\r\nStainless
-
Steel 339.49 311.88 321.14 527.42 5.67%\r\nZinc 119.12 108.78 111.34 173.81
-
%\r\nMagnesium 77.80 70.72 72.06 108.02 4.60%\r\nCarbon Steel
-
56.38 56.92 78.14 3.58%\r\nHigh Steel Alloy 87.93 79.67 80.92 117.66
-
%\r\nOthers 222.93 199.24 199.53 251.32 2.60%\r\nTotal 3,351.67
-
,051.99 3,115.16 4,743.43 4.78%\r\nSource: Indiana Cast Metal Association
-
(INCMA), American Foundry Society (AFS), The North American Die Casting Association,
-
NON-FERROUS FOUNDERS’ SOCIETY, Aluminium Casters’ Association of India,
-
Casting Industry Suppliers Association, International Trade Centre, World Trade
-
Centre, Government Websites, Press Releases, Journals, Annual Reports, Whitepapers,
-
Company Websites, and MRFR Analysis\r\nThe cast iron segment dominated the
-
market with a share of 51.81%, accounting for 1,581.31 kilo tons in 2020; it is
-
projected to exhibit a CAGR of 4.43%. The aluminium segment was the second-largest
-
with a share of 21.10% in 2020, sized at 644.01 kilo tons; it is projected to exhibit
-
the highest CAGR of 5.87%.\r\nTABLE 181 REST OF EUROPE: METAL CASTING MARKET,
-
BY PROCESS TYPE, 2022-2030 (USD MILLION)\r\nProcess Type 2019 2020 2021 2030
-
CAGR (2022-2030)\r\nSand Casting 4,582.64 4,213.71 4,359.15 7,518.33 6.24%\r\nDie
-
Casting 2,227.38 2,056.26 2,135.68 3,811.92 6.65%\r\nShell Mold Casting 691.48
-
648.31 1,046.50 5.46%\r\nGravity Casting 424.73 381.16 384.66 516.60
-
%\r\nVacuum Casting 226.94 203.00 204.16 263.25 2.86%\r\nInvestment
-
Casting 480.16 439.74 453.10 753.82 5.82%\r\nOthers 362.07 329.85 338.06
-
5.23%\r\nTotal 8,995.40 8,254.96 8,523.13 14,445.33 6.04%\r\nSource:
-
Indiana Cast Metal Association (INCMA), American Foundry Society (AFS), The North
-
American Die Casting Association, NON-FERROUS FOUNDERS’ SOCIETY, Aluminium
-
Casters’ Association of India, Casting Industry Suppliers Association, International
-
Trade Centre, World Trade Centre, Government Websites, Press Releases, Journals,
-
Annual Reports, Whitepapers, Company Websites, and MRFR Analysis\r\nThe sand
-
casting segment accounted for the largest market share of 51.04% in 2020, with a
-
market value of USD 4,213.7 million; it is expected to register a CAGR of 6.24%
-
during the forecast period. The die casting segment accounted for the second largest
-
market share in 2020, valued at USD 2,056.3 million; it is projected to register
-
the highest CAGR of 6.65%.\r\n \r\nTABLE 182 REST OF EUROPE:
-
METAL CASTING MARKET, BY PROCESS TYPE, 2022-2030 (KILO TONS)\r\nProcess Type
-
2020 2021 2030 CAGR (2022-2030)\r\nSand Casting 1,770.11 1,615.20 1,652.05
-
,562.53 5.00%\r\nDie Casting 824.88 755.70 776.02 1,245.67 5.40%\r\nShell
-
Mold Casting 261.47 236.87 240.53 349.18 4.23%\r\nGravity Casting 152.57
-
135.58 163.75 2.12%\r\nVacuum Casting 79.93 70.95 70.55 81.81 1.66%\r\nInvestment
-
Casting 174.23 158.34 161.31 241.36 4.58%\r\nOthers 88.48 79.05 79.13 99.14
-
%\r\nTotal 3,351.67 3,051.99 3,115.16 4,743.43 4.78%\r\nSource:
-
Indiana Cast Metal Association (INCMA), American Foundry Society (AFS), The North
-
American Die Casting Association, NON-FERROUS FOUNDERS’ SOCIETY, Aluminium
-
Casters’ Association of India, Casting Industry Suppliers Association, International
-
Trade Centre, World Trade Centre, Government Websites, Press Releases, Journals,
-
Annual Reports, Whitepapers, Company Websites, and MRFR Analysis\r\nThe sand
-
casting segment dominated the market with a share of 52.92%, accounting for 1,615.20
-
kilo tons in 2020; it is projected to exhibit a CAGR of 5.00%. The die casting segment
-
was the second-largest with a share of 24.76% in 2020, sized at 755.70 kilo tons;
-
it is projected to exhibit the highest CAGR of 5.40%.\r\nTABLE 183 REST OF
-
EUROPE: METAL CASTING MARKET, BY END-USE INDUSTRY, 2022-2030 (USD MILLION)\r\nEnd-use
-
Industry 2019 2020 2021 2030 CAGR (2022-2030)\r\nAutomotive & Transportation
-
,689.03 3,398.00 3,521.43 6,166.91 6.42%\r\nBuilding & Construction
-
,490.02 1,365.57 1,408.08 2,358.19 5.90%\r\nMining 972.72 887.52 911.05
-
,463.32 5.41%\r\nEquipment & Machine 1,423.54 1,307.05 1,350.22 2,299.14
-
%\r\nConsumer Goods 889.09 813.28 836.98 1,377.10 5.69%\r\nOthers
-
483.54 495.38 780.68 5.18%\r\nTotal 8,995.40 8,254.96 8,523.13 14,445.33
-
%\r\nSource: Indiana Cast Metal Association (INCMA), American Foundry
-
Society (AFS), The North American Die Casting Association, NON-FERROUS FOUNDERS’
-
SOCIETY, Aluminium Casters’ Association of India, Casting Industry Suppliers
-
Association, International Trade Centre, World Trade Centre, Government Websites,
-
Press Releases, Journals, Annual Reports, Whitepapers, Company Websites, and MRFR
-
Analysis\r\nThe automotive & transportation segment accounted for the
-
largest market share of 41.16% in 2020, with a market value of USD 3,398.0 million;
-
it is expected to register the highest CAGR of 6.42% during the forecast period.
-
The building & construction segment accounted for the second largest market
-
share in 2020, valued at USD 1,365.6 million; it is projected to exhibit a CAGR
-
of 5.90%.\r\n \r\nTABLE 184 REST OF EUROPE: METAL CASTING MARKET,
-
BY END-USE INDUSTRY, 2022-2030 (KILO TONS)\r\nEnd-use Industry 2019 2020
-
2030 CAGR (2022-2030)\r\nAutomotive & Transportation 1,394.94 1,275.10
-
,306.47 2,057.67 5.18%\r\nBuilding & Construction 557.55 507.09 516.97
-
4.66%\r\nMining 356.56 322.84 327.66 473.31 4.17%\r\nEquipment
-
& Machine 527.19 480.36 490.61 751.32 4.85%\r\nConsumer Goods 322.61
-
297.98 440.92 4.45%\r\nOthers 192.82 173.75 175.47 241.58 3.62%\r\nTotal
-
,351.67 3,051.99 3,115.16 4,743.43 4.78%\r\nSource: Indiana Cast Metal Association
-
(INCMA), American Foundry Society (AFS), The North American Die Casting Association,
-
NON-FERROUS FOUNDERS’ SOCIETY, Aluminium Casters’ Association of India,
-
Casting Industry Suppliers Association, International Trade Centre, World Trade
-
Centre, Government Websites, Press Releases, Journals, Annual Reports, Whitepapers,
-
Company Websites, and MRFR Analysis\r\nThe automotive & transportation
-
segment dominated the market with a share of 41.78%, accounting for 1,275.10 kilo
-
tons in 2020; it is expected to register the highest CAGR of 5.18% from 2021 to
-
The building & construction segment was the second-largest with a share
-
of 16.62% in 2020, sized at 507.09 kilo tons; it is projected to exhibit a CAGR
-
of 4.66%.\r\nTABLE 185 REST OF EUROPE: METAL CASTING MARKET, BY AUTOMOTIVE
-
& TRANSPORTATION, 2022-2030\r\n(USD MILLION)\r\nAutomotive &
-
Transportation 2019 2020 2021 2030 CAGR (2022-2030)\r\nGearbox 731.45 678.91
-
1,325.87 7.20%\r\nWheels 366.14 339.25 353.65 651.96 7.03%\r\nEngine
-
Blocks 557.04 513.75 533.08 944.22 6.56%\r\nCylinder Head 802.33 734.09 755.63
-
,242.55 5.68%\r\nExhaust Manifold 215.16 197.17 203.29 339.53 5.86%\r\nSeat
-
Frame 303.16 278.90 288.68 500.00 6.29%\r\nOthers 713.76 655.93 678.17 1,162.79
-
%\r\nTotal 3,689.03 3,398.00 3,521.43 6,166.91 6.42%\r\nSource:
-
Indiana Cast Metal Association (INCMA), American Foundry Society (AFS), The North
-
American Die Casting Association, NON-FERROUS FOUNDERS’ SOCIETY, Aluminium
-
Casters’ Association of India, Casting Industry Suppliers Association, International
-
Trade Centre, World Trade Centre, Government Websites, Press Releases, Journals,
-
Annual Reports, Whitepapers, Company Websites, and MRFR Analysis\r\nThe cylinder
-
head segment accounted for the largest market share of 21.60% in 2020, with a market
-
value of USD 734.1 million; it is expected to register a CAGR of 5.68% during the
-
forecast period. The gearbox segment accounted for the second largest market share
-
in 2020, valued at USD 678.9 million; it is projected to register the highest CAGR
-
of 7.20%.\r\nTABLE 186 REST OF EUROPE: METAL CASTING MARKET, BY AUTOMOTIVE
-
& TRANSPORTATION, 2022-2030\r\n(KILO TONS)\r\nAutomotive &
-
Transportation 2019 2020 2021 2030 CAGR (2022-2030)\r\nGearbox 291.14 268.17
-
465.68 5.95%\r\nWheels 141.27 129.90 133.88 221.97 5.78%\r\nEngine
-
Blocks 219.41 200.82 206.02 328.18 5.31%\r\nCylinder Head 312.77 283.99 289.01
-
4.44%\r\nExhaust Manifold 82.18 74.74 76.18 114.43 4.62%\r\nSeat
-
Frame 114.63 104.66 107.10 166.83 5.05%\r\nOthers 233.53 212.83 217.41 333.16
-
%\r\nTotal 1,394.94 1,275.10 1,306.47 2,057.67 5.18%\r\nSource:
-
Indiana Cast Metal Association (INCMA), American Foundry Society (AFS), The North
-
American Die Casting Association, NON-FERROUS FOUNDERS’ SOCIETY, Aluminium
-
Casters’ Association of India, Casting Industry Suppliers Association, International
-
Trade Centre, World Trade Centre, Government Websites, Press Releases, Journals,
-
Annual Reports, Whitepapers, Company Websites, and MRFR Analysis\r\nThe cylinder
-
head segment dominated the market with a share of 22.27%, accounting for 283.99
-
kilo tons in 2020; it is projected to exhibit a CAGR of 4.44%. The Gearbox segment
-
was the second-largest with a share of 21.03% in 2020, sized at 268.17 kilo tons;
-
it is projected to exhibit the highest CAGR of 5.95%.\r\nTABLE 187 REST OF
-
EUROPE: METAL CASTING MARKET, BY EQUIPMENT & MACHINE, 2022-2030 (USD MILLION)\r\nEquipment
-
& Machine 2019 2020 2021 2030 CAGR (2022-2030)\r\nPumps & Valves
-
735.14 758.09 1,270.38 5.90%\r\nOthers 621.47 571.91 592.13 1,028.76
-
%\r\nTotal 1,423.54 1,307.05 1,350.22 2,299.14 6.09%\r\nSource:
-
Indiana Cast Metal Association (INCMA), American Foundry Society (AFS), The North
-
American Die Casting Association, NON-FERROUS FOUNDERS’ SOCIETY, Aluminium
-
Casters’ Association of India, Casting Industry Suppliers Association, International
-
Trade Centre, World Trade Centre, Government Websites, Press Releases, Journals,
-
Annual Reports, Whitepapers, Company Websites, and MRFR Analysis\r\nThe pumps
-
& valves segment accounted for a larger market share of 56.24% in 2020, with
-
a market value of USD 735.1 million; it is expected to register a CAGR of 5.90%
-
during the forecast period. The Others segment was valued at USD 571.9 million;
-
it is projected to register a higher CAGR of 6.33%.\r\n \r\nTABLE
-
REST OF EUROPE: METAL CASTING MARKET, BY EQUIPMENT & MACHINE, 2022-2030
-
(KILO TONS)\r\nEquipment & Machine 2019 2020 2021 2030 CAGR (2022-2030)\r\nPumps
-
& Valves 300.04 272.90 278.24 419.33 4.66%\r\nOthers 227.15 207.45 212.37
-
5.09%\r\nTotal 527.19 480.36 490.61 751.32 4.85%\r\nSource:
-
Indiana Cast Metal Association (INCMA), American Foundry Society (AFS), The North
-
American Die Casting Association, NON-FERROUS FOUNDERS’ SOCIETY, Aluminium
-
Casters’ Association of India, Casting Industry Suppliers Association, International
-
Trade Centre, World Trade Centre, Government Websites, Press Releases, Journals,
-
Annual Reports, Whitepapers, Company Websites, and MRFR Analysis\r\nThe pumps
-
& valves segment dominated the market with a share of 56.81%, accounting for
-
kilo tons in 2020; it is projected to exhibit a CAGR of 4.66%. The Others
-
segment accounted for a share of 43.19% in 2020, sized at 207.45 kilo tons; it is
-
projected to exhibit a higher CAGR of 5.09%.\r\n \r\n9.4 ASIA-PACIFIC\r\nFIGURE
-
ASIA-PACIFIC: METAL CASTING MARKET SHARE, BY COUNTRY, 2020 (% SHARE)\r\nSource:
-
Indiana Cast Metal Association (INCMA), American Foundry Society (AFS), The North
-
American Die Casting Association, NON-FERROUS FOUNDERS’ SOCIETY, Aluminium
-
Casters’ Association of India, Casting Industry Suppliers Association, International
-
Trade Centre, World Trade Centre, Government Websites, Press Releases, Journals,
-
Annual Reports, Whitepapers, Company Websites, and MRFR Analysis\r\nTABLE
-
ASIA-PACIFIC: METAL CASTING MARKET, BY COUNTRY, 2022-2030 (USD MILLION)\r\nCountry
-
2020 2021 2030 CAGR (2022-2030)\r\nChina 95,871.71 89,947.90 94,956.58
-
,522.70 8.48%\r\nJapan 11,834.65 11,057.26 11,624.55 23,300.69 8.03%\r\nIndia
-
,428.64 22,878.79 24,110.35 49,381.83 8.29%\r\nSouth Korea 6,238.94 5,784.28
-
,033.80 11,232.24 7.15%\r\nAustralia & New Zealand 5,664.84 5,280.49
-
,538.51 10,866.19 7.78%\r\nRest of Asia Pacific 9,037.81 8,234.00 8,435.02
-
,867.90 4.80%\r\nTotal 153,076.59 143,182.72 150,698.81 305,171.55 8.16%\r\nSource:
-
Indiana Cast Metal Association (INCMA), American Foundry Society (AFS), The North
-
American Die Casting Association, NON-FERROUS FOUNDERS’ SOCIETY, Aluminium
-
Casters’ Association of India, Casting Industry Suppliers Association, International
-
Trade Centre, World Trade Centre, Government Websites, Press Releases, Journals,
-
Annual Reports, Whitepapers, Company Websites, and MRFR Analysis\r\nChina
-
accounted for the largest market share of 62.82% in 2020, with a market value of
-
USD 89,947.9 million; the market is expected to register the highest CAGR of 8.48%
-
during the forecast period. India was the second-largest market in 2020, valued
-
at USD 22,878.8 million; the market is projected to exhibit a CAGR of 8.29%.\r\n \r\nTABLE
-
ASIA-PACIFIC: METAL CASTING MARKET, BY COUNTRY, 2022-2030 (KILO TONS)\r\nCountry
-
2020 2021 2030 CAGR (2022-2030)\r\nChina 40,471.43 37,677.04 39,320.94
-
,485.21 7.20%\r\nJapan 4,866.20 4,511.39 4,688.70 8,443.63 6.75%\r\nIndia
-
,281.34 9,554.57 9,953.94 18,316.48 7.01%\r\nSouth Korea 2,596.46 2,388.62
-
,463.21 4,119.66 5.88%\r\nAustralia & New Zealand 2,349.20 2,172.87
-
,253.02 3,971.32 6.50%\r\nRest of Asia Pacific 3,792.79 3,428.83 3,472.54
-
,760.65 3.57%\r\nTotal 64,357.43 59,733.32 62,152.35 113,096.95 6.88%\r\nSource:
-
Indiana Cast Metal Association (INCMA), American Foundry Society (AFS), The North
-
American Die Casting Association, NON-FERROUS FOUNDERS’ SOCIETY, Aluminium
-
Casters’ Association of India, Casting Industry Suppliers Association, International
-
Trade Centre, World Trade Centre, Government Websites, Press Releases, Journals,
-
Annual Reports, Whitepapers, Company Websites, and MRFR Analysis\r\nChina
-
market dominated with a share of 63.08%, accounting for 37,677.04 kilo tons in 2020
-
and is projected to register the highest CAGR of 7.20% from 2021 to 2030. The market
-
in India was the second-largest with a share of 16.00% in 2020, sized at 9,554.57
-
kilo tons; it is projected to exhibit a CAGR of 7.01%.\r\nTABLE 191 ASIA-PACIFIC:
-
METAL CASTING MARKET, BY MATERIAL TYPE, 2022-2030 (USD MILLION)\r\nMaterial
-
Type 2019 2020 2021 2030 CAGR (2022-2030)\r\nCast Iron 78,383.63 73,070.78
-
,646.93 150,487.62 7.78%\r\nAluminium 34,594.79 32,688.17 34,750.64 76,680.56
-
%\r\nStainless Steel 15,982.39 15,082.87 16,015.26 35,009.72 9.08%\r\nZinc
-
,042.46 4,727.32 4,986.80 10,304.79 8.40%\r\nMagnesium 3,497.55 3,263.70
-
,426.83 6,790.20 7.89%\r\nCarbon Steel 2,175.16 2,004.55 2,078.18 3,633.19
-
%\r\nHigh Steel Alloy 3,768.11 3,501.94 3,661.97 6,982.25 7.43%\r\nOthers
-
,632.50 8,843.40 9,132.21 15,283.22 5.89%\r\nTotal 153,076.59 143,182.72
-
,698.81 305,171.55 8.16%\r\nSource: Indiana Cast Metal Association (INCMA),
-
American Foundry Society (AFS), The North American Die Casting Association, NON-FERROUS
-
FOUNDERS’ SOCIETY, Aluminium Casters’ Association of India, Casting
-
Industry Suppliers Association, International Trade Centre, World Trade Centre,
-
Government Websites, Press Releases, Journals, Annual Reports, Whitepapers, Company
-
Websites, and MRFR Analysis\r\nThe cast iron segment accounted for the largest
-
market share of 51.03% in 2020, with a market value of USD 73,070.8 million; it
-
is expected to register a CAGR of 7.78% during the forecast period. The aluminium
-
segment accounted for the second largest market share in 2020, valued at USD 32,688.2
-
million; it is projected to register the highest CAGR of 9.19%.\r\n \r\nTABLE
-
ASIA-PACIFIC: METAL CASTING MARKET, BY MATERIAL TYPE, 2022-2030 (KILO TONS)\r\nMaterial
-
Type 2019 2020 2021 2030 CAGR (2022-2030)\r\nCast Iron 33,442.64 30,938.78
-
,086.63 56,666.22 6.52%\r\nAluminium 14,457.70 13,556.96 14,249.62 28,282.14
-
%\r\nStainless Steel 6,349.84 5,946.89 6,243.25 12,276.27 7.80%\r\nZinc
-
,063.06 1,919.42 2,001.92 3,721.09 7.13%\r\nMagnesium 1,422.12 1,316.94
-
,367.15 2,436.66 6.63%\r\nCarbon Steel 923.13 844.25 865.39 1,360.85 5.16%\r\nHigh
-
Steel Alloy 1,589.64 1,466.11 1,515.79 2,599.56 6.18%\r\nOthers 4,109.30
-
,743.97 3,822.59 5,754.17 4.65%\r\nTotal 64,357.43 59,733.32 62,152.35 113,096.95
-
%\r\nSource: Indiana Cast Metal Association (INCMA), American Foundry
-
Society (AFS), The North American Die Casting Association, NON-FERROUS FOUNDERS’
-
SOCIETY, Aluminium Casters’ Association of India, Casting Industry Suppliers
-
Association, International Trade Centre, World Trade Centre, Government Websites,
-
Press Releases, Journals, Annual Reports, Whitepapers, Company Websites, and MRFR
-
Analysis\r\nThe cast iron segment dominated the market with a share of 51.79%,
-
accounting for 30,938.78 kilo tons in 2020; it is projected to exhibit a CAGR of
-
%. The aluminium segment was the second-largest with a share of 22.70% in 2020,
-
sized at 13,556.96 kilo tons; it is projected to exhibit the highest CAGR of 7.91%.\r\nTABLE
-
ASIA-PACIFIC: METAL CASTING MARKET, BY PROCESS TYPE, 2022-2030 (USD MILLION)\r\nProcess
-
Type 2019 2020 2021 2030 CAGR (2022-2030)\r\nSand Casting 74,682.30 70,043.31
-
,917.89 153,287.28 8.44%\r\nDie Casting 35,542.77 33,465.32 35,453.30 76,004.08
-
%\r\nShell Mold Casting 11,328.86 10,537.63 11,028.68 21,202.96 7.53%\r\nGravity
-
Casting 9,201.08 8,420.32 8,666.34 13,964.39 5.44%\r\nVacuum Casting 5,217.89
-
,790.82 4,947.79 8,298.75 5.91%\r\nInvestment Casting 8,710.77 8,129.59
-
,537.21 16,940.02 7.91%\r\nOthers 8,392.92 7,795.74 8,147.60 15,474.06 7.39%\r\nTotal
-
,076.59 143,182.72 150,698.81 305,171.55 8.16%\r\nSource: Indiana Cast
-
Metal Association (INCMA), American Foundry Society (AFS), The North American Die
-
Casting Association, NON-FERROUS FOUNDERS’ SOCIETY, Aluminium Casters’
-
Association of India, Casting Industry Suppliers Association, International Trade
-
Centre, World Trade Centre, Government Websites, Press Releases, Journals, Annual
-
Reports, Whitepapers, Company Websites, and MRFR Analysis\r\nThe sand casting
-
segment accounted for the largest market share of 48.92% in 2020, with a market
-
value of USD 70,043.3 million; it is expected to register a CAGR of 8.44% during
-
the forecast period. The die casting segment accounted for the second largest market
-
share in 2020, valued at USD 33,465.3 million; it is projected to register the highest
-
CAGR of 8.84%.\r\n \r\nTABLE 194 ASIA-PACIFIC: METAL CASTING
-
MARKET, BY PROCESS TYPE, 2022-2030 (KILO TONS)\r\nProcess Type 2019 2020
-
2030 CAGR (2022-2030)\r\nSand Casting 32,548.98 30,294.96 31,609.89
-
,961.99 7.17%\r\nDie Casting 14,848.12 13,873.95 14,532.23 28,022.83 7.57%\r\nShell
-
Mold Casting 4,831.49 4,459.86 4,614.99 7,980.54 6.27%\r\nGravity Casting
-
,731.42 3,388.85 3,448.54 4,998.92 4.21%\r\nVacuum Casting 2,074.59 1,890.32
-
,930.24 2,912.46 4.68%\r\nInvestment Casting 3,563.87 3,300.79 3,427.17
-
,116.83 6.65%\r\nOthers 2,758.97 2,524.59 2,589.29 4,103.38 5.25%\r\nTotal
-
,357.43 59,733.32 62,152.35 113,096.95 6.88%\r\nSource: Indiana Cast Metal
-
Association (INCMA), American Foundry Society (AFS), The North American Die Casting
-
Association, NON-FERROUS FOUNDERS’ SOCIETY, Aluminium Casters’ Association
-
of India, Casting Industry Suppliers Association, International Trade Centre, World
-
Trade Centre, Government Websites, Press Releases, Journals, Annual Reports, Whitepapers,
-
Company Websites, and MRFR Analysis\r\nThe sand casting segment dominated
-
the market with a share of 50.72%, accounting for 30,294.96 kilo tons in 2020; it
-
is projected to exhibit a CAGR of 7.17%. The die casting segment was the second-largest
-
with a share of 23.23% in 2020, sized at 13,873.95 kilo tons; it is projected to
-
exhibit the highest CAGR of 7.57%.\r\nTABLE 195 ASIA-PACIFIC: METAL CASTING
-
MARKET, BY END-USE INDUSTRY, 2022-2030 (USD MILLION)\r\nEnd-use Industry
-
2020 2021 2030 CAGR (2022-2030)\r\nAutomotive & Transportation 62,484.27
-
,668.05 61,981.68 129,774.55 8.56%\r\nBuilding & Construction 27,627.67
-
,812.32 27,136.06 54,382.87 8.03%\r\nMining 15,265.42 14,183.61 14,828.01
-
,204.29 7.41%\r\nEquipment & Machine 21,723.44 20,328.96 21,406.18
-
,531.83 8.21%\r\nConsumer Goods 16,979.17 15,839.93 16,627.41 32,870.05
-
%\r\nOthers 8,996.62 8,349.85 8,719.47 16,407.96 7.28%\r\nTotal
-
,076.59 143,182.72 150,698.81 305,171.55 8.16%\r\nSource: Indiana Cast
-
Metal Association (INCMA), American Foundry Society (AFS), The North American Die
-
Casting Association, NON-FERROUS FOUNDERS’ SOCIETY, Aluminium Casters’
-
Association of India, Casting Industry Suppliers Association, International Trade
-
Centre, World Trade Centre, Government Websites, Press Releases, Journals, Annual
-
Reports, Whitepapers, Company Websites, and MRFR Analysis\r\nThe automotive
-
& transportation segment accounted for the largest market share of 40.97% in
-
, with a market value of USD 58,668.0 million; it is expected to register the
-
highest CAGR of 8.56% during the forecast period. The building & construction
-
segment accounted for the second largest market share in 2020, valued at USD 25,812.3
-
million; it is projected to exhibit a CAGR of 8.03%.\r\n \r\nTABLE
-
ASIA-PACIFIC: METAL CASTING MARKET, BY END-USE INDUSTRY, 2022-2030 (KILO TONS)\r\nEnd-use
-
Industry 2019 2020 2021 2030 CAGR (2022-2030)\r\nAutomotive & Transportation
-
,657.33 24,838.88 25,945.59 48,863.45 7.29%\r\nBuilding & Construction
-
,665.64 10,816.22 11,242.55 20,266.28 6.77%\r\nMining 6,310.90 5,819.05
-
,014.75 10,290.43 6.15%\r\nEquipment & Machine 9,074.39 8,427.31 8,773.70
-
,048.96 6.94%\r\nConsumer Goods 6,952.94 6,437.09 6,680.84 11,879.64 6.60%\r\nOthers
-
,696.23 3,394.77 3,494.91 5,748.19 5.68%\r\nTotal 64,357.43 59,733.32 62,152.35
-
,096.95 6.88%\r\nSource: Indiana Cast Metal Association (INCMA), American
-
Foundry Society (AFS), The North American Die Casting Association, NON-FERROUS FOUNDERS’
-
SOCIETY, Aluminium Casters’ Association of India, Casting Industry Suppliers
-
Association, International Trade Centre, World Trade Centre, Government Websites,
-
Press Releases, Journals, Annual Reports, Whitepapers, Company Websites, and MRFR
-
Analysis\r\nThe automotive & transportation segment dominated the market
-
with a share of 41.58%, accounting for 24,838.88 kilo tons in 2020; it is expected
-
to register the highest CAGR of 7.29% from 2021 to 2030. The building & construction
-
segment was the second-largest with a share of 18.11% in 2020, sized at 10,816.22
-
kilo tons; it is projected to exhibit a CAGR of 6.77%.\r\nTABLE 197 ASIA-PACIFIC:
-
METAL CASTING MARKET, BY AUTOMOTIVE & TRANSPORTATION, 2022-2030\r\n(USD
-
MILLION)\r\nAutomotive & Transportation 2019 2020 2021 2030 CAGR (2022-2030)\r\nGearbox
-
,099.63 11,450.93 12,193.08 27,326.75 9.38%\r\nWheels 6,480.87 6,118.72
-
,499.88 14,279.43 9.14%\r\nEngine Blocks 9,222.49 8,670.70 9,172.55 19,433.56
-
%\r\nCylinder Head 14,749.12 13,762.73 14,449.65 28,550.23 7.86%\r\nExhaust
-
Manifold 4,259.82 3,981.49 4,187.19 8,405.45 8.05%\r\nSeat Frame 5,029.48
-
,715.69 4,975.05 10,284.88 8.40%\r\nOthers 10,642.87 9,967.78 10,504.28
-
,494.25 8.28%\r\nTotal 62,484.27 58,668.05 61,981.68 129,774.55 8.56%\r\nSource:
-
Indiana Cast Metal Association (INCMA), American Foundry Society (AFS), The North
-
American Die Casting Association, NON-FERROUS FOUNDERS’ SOCIETY, Aluminium
-
Casters’ Association of India, Casting Industry Suppliers Association, International
-
Trade Centre, World Trade Centre, Government Websites, Press Releases, Journals,
-
Annual Reports, Whitepapers, Company Websites, and MRFR Analysis\r\nThe cylinder
-
head segment accounted for the largest market share of 23.46% in 2020, with a market
-
value of USD 13,762.7 million; it is expected to register a CAGR of 7.86% during
-
the forecast period. The gearbox segment accounted for the second largest market
-
share in 2020, valued at USD 11,450.9 million; it is projected to register the highest
-
CAGR of 9.38%.\r\nTABLE 198 ASIA-PACIFIC: METAL CASTING MARKET, BY AUTOMOTIVE
-
& TRANSPORTATION, 2022-2030\r\n(KILO TONS)\r\nAutomotive &
-
Transportation 2019 2020 2021 2030 CAGR (2022-2030)\r\nGearbox 5,434.05 5,103.60
-
,373.02 10,831.40 8.10%\r\nWheels 2,820.79 2,642.91 2,775.86 5,485.33 7.86%\r\nEngine
-
Blocks 4,098.79 3,824.25 3,999.93 7,622.69 7.43%\r\nCylinder Head 6,486.71
-
,006.86 6,235.48 11,081.93 6.60%\r\nExhaust Manifold 1,835.39 1,702.42 1,770.16
-
,196.26 6.79%\r\nSeat Frame 2,145.24 1,996.10 2,082.11 3,871.69 7.14%\r\nOthers
-
,836.37 3,562.75 3,709.03 6,774.14 6.92%\r\nTotal 26,657.33 24,838.88 25,945.59
-
,863.45 7.29%\r\nSource: Indiana Cast Metal Association (INCMA), American
-
Foundry Society (AFS), The North American Die Casting Association, NON-FERROUS FOUNDERS’
-
SOCIETY, Aluminium Casters’ Association of India, Casting Industry Suppliers
-
Association, International Trade Centre, World Trade Centre, Government Websites,
-
Press Releases, Journals, Annual Reports, Whitepapers, Company Websites, and MRFR
-
Analysis\r\nThe cylinder head segment dominated the market with a share of
-
%, accounting for 6,006.86 kilo tons in 2020; it is projected to exhibit a
-
CAGR of 6.60%. The Gearbox segment was the second-largest with a share of 20.55%
-
in 2020, sized at 5,103.60 kilo tons; it is projected to exhibit the highest CAGR
-
of 8.10%.\r\nTABLE 199 ASIA-PACIFIC: METAL CASTING MARKET, BY EQUIPMENT &
-
MACHINE, 2022-2030 (USD MILLION)\r\nEquipment & Machine 2019 2020 2021
-
CAGR (2022-2030)\r\nPumps & Valves 12,342.82 11,530.81 12,121.08
-
,270.01 8.02%\r\nOthers 9,380.62 8,798.15 9,285.10 19,261.82 8.45%\r\nTotal
-
,723.44 20,328.96 21,406.18 43,531.83 8.21%\r\nSource: Indiana Cast Metal
-
Association (INCMA), American Foundry Society (AFS), The North American Die Casting
-
Association, NON-FERROUS FOUNDERS’ SOCIETY, Aluminium Casters’ Association
-
of India, Casting Industry Suppliers Association, International Trade Centre, World
-
Trade Centre, Government Websites, Press Releases, Journals, Annual Reports, Whitepapers,
-
Company Websites, and MRFR Analysis\r\nThe pumps & valves segment accounted
-
for a larger market share of 56.72% in 2020, with a market value of USD 11,530.8
-
million; it is expected to register a CAGR of 8.02% during the forecast period.
-
The Others segment was valued at USD 8,798.2 million; it is projected to register
-
a higher CAGR of 8.45%.\r\n \r\nTABLE 200 ASIA-PACIFIC: METAL
-
CASTING MARKET, BY EQUIPMENT & MACHINE, 2022-2030 (KILO TONS)\r\nEquipment
-
& Machine 2019 2020 2021 2030 CAGR (2022-2030)\r\nPumps & Valves
-
,208.13 4,828.50 5,018.38 9,038.34 6.76%\r\nOthers 3,866.26 3,598.81 3,755.32
-
,010.62 7.18%\r\nTotal 9,074.39 8,427.31 8,773.70 16,048.96 6.94%\r\nSource:
-
Indiana Cast Metal Association (INCMA), American Foundry Society (AFS), The North
-
American Die Casting Association, NON-FERROUS FOUNDERS’ SOCIETY, Aluminium
-
Casters’ Association of India, Casting Industry Suppliers Association, International
-
Trade Centre, World Trade Centre, Government Websites, Press Releases, Journals,
-
Annual Reports, Whitepapers, Company Websites, and MRFR Analysis\r\nThe pumps
-
& valves segment dominated the market with a share of 57.30%, accounting for
-
,828.50 kilo tons in 2020; it is projected to exhibit a CAGR of 6.76%. The Others
-
segment accounted for a share of 42.70% in 2020, sized at 3,598.81 kilo tons; it
-
is projected to exhibit a higher CAGR of 7.18%.\r\n9.4.1 CHINA\r\nTABLE
-
CHINA: METAL CASTING MARKET, BY MATERIAL TYPE, 2022-2030 (USD MILLION)\r\nMaterial
-
Type 2019 2020 2021 2030 CAGR (2022-2030)\r\nCast Iron 48,997.16 45,813.83
-
,200.44 97,187.44 8.10%\r\nAluminium 22,062.06 20,904.67 22,285.93 50,419.53
-
%\r\nStainless Steel 10,335.87 9,781.77 10,415.70 23,334.75 9.38%\r\nZinc
-
,892.34 2,722.55 2,883.58 6,174.48 8.83%\r\nMagnesium 1,954.73 1,830.02
-
,927.79 3,932.61 8.24%\r\nCarbon Steel 1,257.50 1,161.85 1,207.60 2,157.66
-
%\r\nHigh Steel Alloy 1,987.37 1,852.72 1,943.38 3,808.55 7.76%\r\nOthers
-
,384.67 5,880.48 6,092.17 10,507.68 6.24%\r\nTotal 95,871.71 89,947.90 94,956.58
-
,522.70 8.48%\r\nSource: Indiana Cast Metal Association (INCMA), American
-
Foundry Society (AFS), The North American Die Casting Association, NON-FERROUS FOUNDERS’
-
SOCIETY, Aluminium Casters’ Association of India, Casting Industry Suppliers
-
Association, International Trade Centre, World Trade Centre, Government Websites,
-
Press Releases, Journals, Annual Reports, Whitepapers, Company Websites, and MRFR
-
Analysis\r\nThe cast iron segment accounted for the largest market share
-
of 50.93% in 2020, with a market value of USD 45,813.8 million; it is expected to
-
register a CAGR of 8.10% during the forecast period. The aluminium segment accounted
-
for the second largest market share in 2020, valued at USD 20,904.7 million; it
-
is projected to register the highest CAGR of 9.50%.\r\n \r\nTABLE
-
CHINA: METAL CASTING MARKET, BY MATERIAL TYPE, 2022-2030 (KILO TONS)\r\nMaterial
-
Type 2019 2020 2021 2030 CAGR (2022-2030)\r\nCast Iron 20,989.95 19,476.63
-
,259.58 36,737.93 6.84%\r\nAluminium 9,256.32 8,703.87 9,174.07 18,666.17
-
%\r\nStainless Steel 4,123.93 3,873.10 4,077.47 8,215.44 8.09%\r\nZinc
-
,188.99 1,110.66 1,163.05 2,239.72 7.55%\r\nMagnesium 798.71 742.06 772.86
-
,417.91 6.98%\r\nCarbon Steel 535.88 491.35 504.92 811.35 5.41%\r\nHigh
-
Steel Alloy 842.50 779.43 808.33 1,424.68 6.50%\r\nOthers 2,735.14 2,499.94
-
,560.66 3,972.02 5.00%\r\nTotal 40,471.43 37,677.04 39,320.94 73,485.21
-
%\r\nSource: Indiana Cast Metal Association (INCMA), American Foundry
-
Society (AFS), The North American Die Casting Association, NON-FERROUS FOUNDERS’
-
SOCIETY, Aluminium Casters’ Association of India, Casting Industry Suppliers
-
Association, International Trade Centre, World Trade Centre, Government Websites,
-
Press Releases, Journals, Annual Reports, Whitepapers, Company Websites, and MRFR
-
Analysis\r\nThe cast iron segment dominated the market with a share of 51.69%,
-
accounting for 19,476.63 kilo tons in 2020; it is projected to exhibit a CAGR of
-
%. The aluminium segment was the second-largest with a share of 23.10% in 2020,
-
sized at 8,703.87 kilo tons; it is projected to exhibit the highest CAGR of 8.21%.\r\nTABLE
-
CHINA: METAL CASTING MARKET, BY PROCESS TYPE, 2022-2030 (USD MILLION)\r\nProcess
-
Type 2019 2020 2021 2030 CAGR (2022-2030)\r\nSand Casting 46,401.53 43,650.98
-
,204.66 98,412.35 8.76%\r\nDie Casting 21,908.87 20,697.61 22,000.50 48,575.90
-
%\r\nShell Mold Casting 6,922.84 6,458.90 6,780.37 13,389.94 7.85%\r\nGravity
-
Casting 5,958.19 5,468.13 5,643.95 9,334.10 5.75%\r\nVacuum Casting 3,500.73
-
,226.96 3,346.00 5,825.97 6.36%\r\nInvestment Casting 5,328.51 4,989.47
-
,256.96 10,741.77 8.26%\r\nOthers 5,851.03 5,455.84 5,724.12 11,242.67 7.79%\r\nTotal
-
,871.71 89,947.90 94,956.58 197,522.70 8.48%\r\nSource: Indiana Cast Metal
-
Association (INCMA), American Foundry Society (AFS), The North American Die Casting
-
Association, NON-FERROUS FOUNDERS’ SOCIETY, Aluminium Casters’ Association
-
of India, Casting Industry Suppliers Association, International Trade Centre, World
-
Trade Centre, Government Websites, Press Releases, Journals, Annual Reports, Whitepapers,
-
Company Websites, and MRFR Analysis\r\nThe sand casting segment accounted
-
for the largest market share of 48.53% in 2020, with a market value of USD 43,651.0
-
million; it is expected to register a CAGR of 8.76% during the forecast period.
-
The die casting segment accounted for the second largest market share in 2020, valued
-
at USD 20,697.6 million; it is projected to register the highest CAGR of 9.20%.\r\n \r\nTABLE
-
CHINA: METAL CASTING MARKET, BY PROCESS TYPE, 2022-2030 (KILO TONS)\r\nProcess
-
Type 2019 2020 2021 2030 CAGR (2022-2030)\r\nSand Casting 20,305.49 18,956.23
-
,838.36 38,000.98 7.49%\r\nDie Casting 9,192.05 8,617.66 9,056.57 17,983.63
-
%\r\nShell Mold Casting 2,965.68 2,745.84 2,849.92 5,061.54 6.59%\r\nGravity
-
Casting 2,424.82 2,208.41 2,253.65 3,351.97 4.51%\r\nVacuum Casting 1,396.76
-
,277.72 1,309.87 2,051.14 5.11%\r\nInvestment Casting 2,190.46 2,035.45
-
,120.33 3,896.45 6.99%\r\nOthers 1,996.17 1,835.74 1,892.24 3,139.50 5.79%\r\nTotal
-
,471.43 37,677.04 39,320.94 73,485.21 7.20%\r\nSource: Indiana Cast Metal
-
Association (INCMA), American Foundry Society (AFS), The North American Die Casting
-
Association, NON-FERROUS FOUNDERS’ SOCIETY, Aluminium Casters’ Association
-
of India, Casting Industry Suppliers Association, International Trade Centre, World
-
Trade Centre, Government Websites, Press Releases, Journals, Annual Reports, Whitepapers,
-
Company Websites, and MRFR Analysis\r\nThe sand casting segment dominated
-
the market with a share of 50.31%, accounting for 18,956.23 kilo tons in 2020; it
-
is projected to exhibit a CAGR of 7.49%. The die casting segment was the second-largest
-
with a share of 22.87% in 2020, sized at 8,617.66 kilo tons; it is projected to
-
exhibit the highest CAGR of 7.92%.\r\nTABLE 205 CHINA: METAL CASTING MARKET,
-
BY END-USE INDUSTRY, 2022-2030 (USD MILLION)\r\nEnd-use Industry 2019 2020
-
2030 CAGR (2022-2030)\r\nAutomotive & Transportation 39,557.04 37,250.46
-
,469.96 84,818.96 8.87%\r\nBuilding & Construction 17,412.08 16,316.45
-
,204.17 35,397.10 8.35%\r\nMining 8,588.58 8,002.14 8,388.87 16,349.39
-
%\r\nEquipment & Machine 13,137.43 12,333.34 13,028.20 27,251.57
-
%\r\nConsumer Goods 11,334.40 10,605.16 11,165.18 22,654.56 8.18%\r\nOthers
-
,842.17 5,440.35 5,700.19 11,051.12 7.63%\r\nTotal 95,871.71 89,947.90 94,956.58
-
,522.70 8.48%\r\nSource: Indiana Cast Metal Association (INCMA), American
-
Foundry Society (AFS), The North American Die Casting Association, NON-FERROUS FOUNDERS’
-
SOCIETY, Aluminium Casters’ Association of India, Casting Industry Suppliers
-
Association, International Trade Centre, World Trade Centre, Government Websites,
-
Press Releases, Journals, Annual Reports, Whitepapers, Company Websites, and MRFR
-
Analysis\r\nThe automotive & transportation segment accounted for the
-
largest market share of 41.41% in 2020, with a market value of USD 37,250.5 million;
-
it is expected to register the highest CAGR of 8.87% during the forecast period.
-
The building & construction segment accounted for the second largest market
-
share in 2020, valued at USD 16,316.5 million; it is projected to exhibit a CAGR
-
of 8.35%.\r\n \r\nTABLE 206 CHINA: METAL CASTING MARKET, BY END-USE
-
INDUSTRY, 2022-2030 (KILO TONS)\r\nEnd-use Industry 2019 2020 2021 2030 CAGR
-
(2022-2030)\r\nAutomotive & Transportation 16,945.89 15,836.12 16,589.99
-
,062.50 7.60%\r\nBuilding & Construction 7,381.48 6,864.28 7,155.92
-
,241.11 7.08%\r\nMining 3,566.64 3,297.77 3,418.07 5,991.06 6.43%\r\nEquipment
-
& Machine 5,511.92 5,135.11 5,363.10 10,089.00 7.27%\r\nConsumer Goods
-
,659.38 4,326.36 4,503.33 8,217.67 6.91%\r\nOthers 2,406.13 2,217.39 2,290.54
-
,883.88 6.04%\r\nTotal 40,471.43 37,677.04 39,320.94 73,485.21 7.20%\r\nSource:
-
Indiana Cast Metal Association (INCMA), American Foundry Society (AFS), The North
-
American Die Casting Association, NON-FERROUS FOUNDERS’ SOCIETY, Aluminium
-
Casters’ Association of India, Casting Industry Suppliers Association, International
-
Trade Centre, World Trade Centre, Government Websites, Press Releases, Journals,
-
Annual Reports, Whitepapers, Company Websites, and MRFR Analysis\r\nThe automotive
-
& transportation segment dominated the market with a share of 42.03%, accounting
-
for 15,836.12 kilo tons in 2020; it is expected to register the highest CAGR of
-
% from 2021 to 2030. The building & construction segment was the second-largest
-
with a share of 18.22% in 2020, sized at 6,864.28 kilo tons; it is projected to
-
exhibit a CAGR of 7.08%.\r\nTABLE 207 CHINA: METAL CASTING MARKET, BY AUTOMOTIVE
-
& TRANSPORTATION, 2022-2030 (USD MILLION)\r\nAutomotive & Transportation
-
2020 2021 2030 CAGR (2022-2030)\r\nGearbox 7,695.51 7,303.41 7,798.56
-
,919.04 9.68%\r\nWheels 3,959.64 3,750.66 3,997.34 9,038.95 9.49%\r\nEngine
-
Blocks 5,985.30 5,643.44 5,987.28 13,012.92 9.01%\r\nCylinder Head 9,275.08
-
,680.05 9,139.81 18,530.29 8.17%\r\nExhaust Manifold 2,667.93 2,501.30 2,638.61
-
,443.52 8.38%\r\nSeat Frame 3,129.97 2,943.73 3,115.18 6,618.03 8.73%\r\nOthers
-
,843.61 6,427.87 6,793.18 14,256.21 8.59%\r\nTotal 39,557.04 37,250.46 39,469.96
-
,818.96 8.87%\r\nSource: Indiana Cast Metal Association (INCMA), American
-
Foundry Society (AFS), The North American Die Casting Association, NON-FERROUS FOUNDERS’
-
SOCIETY, Aluminium Casters’ Association of India, Casting Industry Suppliers
-
Association, International Trade Centre, World Trade Centre, Government Websites,
-
Press Releases, Journals, Annual Reports, Whitepapers, Company Websites, and MRFR
-
Analysis\r\nThe cylinder head segment accounted for the largest market share
-
of 23.30% in 2020, with a market value of USD 8,680.1 million; it is expected to
-
register a CAGR of 8.17% during the forecast period. The gearbox segment accounted
-
for the second largest market share in 2020, valued at USD 7,303.4 million; it is
-
projected to register the highest CAGR of 9.68%.\r\n \r\nTABLE
-
CHINA: METAL CASTING MARKET, BY AUTOMOTIVE & TRANSPORTATION, 2022-2030 (KILO
-
TONS)\r\nAutomotive & Transportation 2019 2020 2021 2030 CAGR (2022-2030)\r\nGearbox
-
,470.20 3,268.28 3,450.41 7,130.10 8.40%\r\nWheels 1,730.89 1,627.04 1,714.45
-
,486.55 8.21%\r\nEngine Blocks 2,670.88 2,499.14 2,621.43 5,123.99 7.73%\r\nCylinder
-
Head 4,096.25 3,804.24 3,960.45 7,221.29 6.90%\r\nExhaust Manifold 1,154.46
-
,074.11 1,120.26 2,078.49 7.11%\r\nSeat Frame 1,340.85 1,251.46 1,309.37
-
,501.69 7.46%\r\nOthers 2,482.35 2,311.86 2,413.62 4,520.39 7.22%\r\nTotal
-
,945.89 15,836.12 16,589.99 32,062.50 7.60%\r\nSource: Indiana Cast Metal
-
Association (INCMA), American Foundry Society (AFS), The North American Die Casting
-
Association, NON-FERROUS FOUNDERS’ SOCIETY, Aluminium Casters’ Association
-
of India, Casting Industry Suppliers Association, International Trade Centre, World
-
Trade Centre, Government Websites, Press Releases, Journals, Annual Reports, Whitepapers,
-
Company Websites, and MRFR Analysis\r\nThe cylinder head segment dominated
-
the market with a share of 24.02%, accounting for 3,804.24 kilo tons in 2020; it
-
is projected to exhibit a CAGR of 6.90%. The Gearbox segment was the second-largest
-
with a share of 20.64% in 2020, sized at 3,268.28 kilo tons; it is projected to
-
exhibit the highest CAGR of 8.40%.\r\nTABLE 209 CHINA: METAL CASTING MARKET,
-
BY EQUIPMENT & MACHINE, 2022-2030 (USD MILLION)\r\nEquipment & Machine
-
2020 2021 2030 CAGR (2022-2030)\r\nPumps & Valves 7,559.64 7,084.74
-
,470.99 15,384.54 8.36%\r\nOthers 5,577.79 5,248.61 5,557.21 11,867.04 8.80%\r\nTotal
-
,137.43 12,333.34 13,028.20 27,251.57 8.55%\r\nSource: Indiana Cast Metal
-
Association (INCMA), American Foundry Society (AFS), The North American Die Casting
-
Association, NON-FERROUS FOUNDERS’ SOCIETY, Aluminium Casters’ Association
-
of India, Casting Industry Suppliers Association, International Trade Centre, World
-
Trade Centre, Government Websites, Press Releases, Journals, Annual Reports, Whitepapers,
-
Company Websites, and MRFR Analysis\r\nThe pumps & valves segment accounted
-
for a larger market share of 57.44% in 2020, with a market value of USD 7,084.7
-
million; it is expected to register a CAGR of 8.36% during the forecast period.
-
The Others segment was valued at USD 5,248.6 million; it is projected to register
-
a higher CAGR of 8.80%.\r\n \r\nTABLE 210 CHINA: METAL CASTING
-
MARKET, BY EQUIPMENT & MACHINE, 2022-2030 (KILO TONS)\r\nEquipment &
-
Machine 2019 2020 2021 2030 CAGR (2022-2030)\r\nPumps & Valves 3,203.75
-
,979.60 3,106.52 5,753.15 7.09%\r\nOthers 2,308.17 2,155.51 2,256.58 4,335.85
-
%\r\nTotal 5,511.92 5,135.11 5,363.10 10,089.00 7.27%\r\nSource:
-
Indiana Cast Metal Association (INCMA), American Foundry Society (AFS), The North
-
American Die Casting Association, NON-FERROUS FOUNDERS’ SOCIETY, Aluminium
-
Casters’ Association of India, Casting Industry Suppliers Association, International
-
Trade Centre, World Trade Centre, Government Websites, Press Releases, Journals,
-
Annual Reports, Whitepapers, Company Websites, and MRFR Analysis\r\nThe pumps
-
& valves segment dominated the market with a share of 58.02%, accounting for
-
,979.60 kilo tons in 2020; it is projected to exhibit a CAGR of 7.09%. The Others
-
segment accounted for a share of 41.98% in 2020, sized at 2,155.51 kilo tons; it
-
is projected to exhibit a higher CAGR of 7.53%.\r\n9.4.2 JAPAN\r\nTABLE
-
JAPAN: METAL CASTING MARKET, BY MATERIAL TYPE, 2022-2030 (USD MILLION)\r\nMaterial
-
Type 2019 2020 2021 2030 CAGR (2022-2030)\r\nCast Iron 5,911.02 5,503.61
-
,765.86 11,194.99 7.65%\r\nAluminium 2,469.56 2,332.65 2,478.93 5,448.15
-
%\r\nStainless Steel 1,340.72 1,263.03 1,338.74 2,879.99 8.88%\r\nZinc
-
421.10 443.85 910.25 8.31%\r\nMagnesium 348.55 325.16 341.33 674.82
-
%\r\nCarbon Steel 143.29 131.68 136.12 231.10 6.06%\r\nHigh Steel
-
Alloy 315.74 293.54 307.06 587.76 7.48%\r\nOthers 856.22 786.49 812.67 1,373.63
-
%\r\nTotal 11,834.65 11,057.26 11,624.55 23,300.69 8.03%\r\nSource:
-
Indiana Cast Metal Association (INCMA), American Foundry Society (AFS), The North
-
American Die Casting Association, NON-FERROUS FOUNDERS’ SOCIETY, Aluminium
-
Casters’ Association of India, Casting Industry Suppliers Association, International
-
Trade Centre, World Trade Centre, Government Websites, Press Releases, Journals,
-
Annual Reports, Whitepapers, Company Websites, and MRFR Analysis\r\nThe cast
-
iron segment accounted for the largest market share of 49.77% in 2020, with a market
-
value of USD 5,503.6 million; it is expected to register a CAGR of 7.65% during
-
the forecast period. The aluminium segment accounted for the second largest market
-
share in 2020, valued at USD 2,332.7 million; it is projected to register the highest
-
CAGR of 9.14%.\r\n \r\nTABLE 212 JAPAN: METAL CASTING MARKET,
-
BY MATERIAL TYPE, 2022-2030 (KILO TONS)\r\nMaterial Type 2019 2020 2021 2030
-
CAGR (2022-2030)\r\nCast Iron 2,468.31 2,280.66 2,362.33 4,125.01 6.39%\r\nAluminium
-
,009.97 946.71 994.70 1,966.08 7.86%\r\nStainless Steel 521.43 487.47 510.85
-
7.61%\r\nZinc 180.13 167.45 174.50 321.85 7.04%\r\nMagnesium
-
128.52 133.39 237.17 6.60%\r\nCarbon Steel 59.52 54.28 55.48 84.71
-
%\r\nHigh Steel Alloy 130.47 120.37 124.49 214.32 6.22%\r\nOthers
-
325.92 332.96 506.14 4.76%\r\nTotal 4,866.20 4,511.39 4,688.70 8,443.63
-
%\r\nSource: Indiana Cast Metal Association (INCMA), American Foundry
-
Society (AFS), The North American Die Casting Association, NON-FERROUS FOUNDERS’
-
SOCIETY, Aluminium Casters’ Association of India, Casting Industry Suppliers
-
Association, International Trade Centre, World Trade Centre, Government Websites,
-
Press Releases, Journals, Annual Reports, Whitepapers, Company Websites, and MRFR
-
Analysis\r\nThe cast iron segment dominated the market with a share of 50.55%,
-
accounting for 2,280.66 kilo tons in 2020; it is projected to exhibit a CAGR of
-
%. The aluminium segment was the second-largest with a share of 20.98% in 2020,
-
sized at 946.71 kilo tons; it is projected to exhibit the highest CAGR of 7.86%.\r\nTABLE
-
JAPAN: METAL CASTING MARKET, BY PROCESS TYPE, 2022-2030 (USD MILLION)\r\nProcess
-
Type 2019 2020 2021 2030 CAGR (2022-2030)\r\nSand Casting 5,490.10 5,143.80
-
,422.78 11,141.27 8.33%\r\nDie Casting 2,949.84 2,773.55 2,934.21 6,212.41
-
%\r\nShell Mold Casting 1,024.64 952.87 997.07 1,914.04 7.52%\r\nGravity
-
Casting 514.99 466.21 474.41 667.75 3.87%\r\nVacuum Casting 302.66 275.73
-
432.76 4.85%\r\nInvestment Casting 865.22 807.16 847.29 1,675.12 7.87%\r\nOthers
-
637.92 666.31 1,257.34 7.31%\r\nTotal 11,834.65 11,057.26 11,624.55
-
,300.69 8.03%\r\nSource: Indiana Cast Metal Association (INCMA), American
-
Foundry Society (AFS), The North American Die Casting Association, NON-FERROUS FOUNDERS’
-
SOCIETY, Aluminium Casters’ Association of India, Casting Industry Suppliers
-
Association, International Trade Centre, World Trade Centre, Government Websites,
-
Press Releases, Journals, Annual Reports, Whitepapers, Company Websites, and MRFR
-
Analysis\r\nThe sand casting segment accounted for the largest market share
-
of 46.52% in 2020, with a market value of USD 5,143.8 million; it is expected to
-
register a CAGR of 8.33% during the forecast period. The die casting segment accounted
-
for the second largest market share in 2020, valued at USD 2,773.5 million; it is
-
projected to register the highest CAGR of 8.69%.\r\n \r\nTABLE
-
JAPAN: METAL CASTING MARKET, BY PROCESS TYPE, 2022-2030 (KILO TONS)\r\nProcess
-
Type 2019 2020 2021 2030 CAGR (2022-2030)\r\nSand Casting 2,341.84 2,177.40
-
,269.54 4,193.50 7.06%\r\nDie Casting 1,206.39 1,125.65 1,177.39 2,241.88
-
%\r\nShell Mold Casting 427.87 394.87 408.51 705.27 6.26%\r\nGravity
-
Casting 204.30 183.54 184.65 233.74 2.65%\r\nVacuum Casting 117.71 106.42
-
148.52 3.63%\r\nInvestment Casting 346.70 320.97 333.12 592.29 6.60%\r\nOthers
-
202.55 207.70 328.43 5.22%\r\nTotal 4,866.20 4,511.39 4,688.70 8,443.63
-
%\r\nSource: Indiana Cast Metal Association (INCMA), American Foundry
-
Society (AFS), The North American Die Casting Association, NON-FERROUS FOUNDERS’
-
SOCIETY, Aluminium Casters’ Association of India, Casting Industry Suppliers
-
Association, International Trade Centre, World Trade Centre, Government Websites,
-
Press Releases, Journals, Annual Reports, Whitepapers, Company Websites, and MRFR
-
Analysis\r\nThe sand casting segment dominated the market with a share of
-
%, accounting for 2,177.40 kilo tons in 2020; it is projected to exhibit a
-
CAGR of 7.06%. The die casting segment was the second-largest with a share of 24.95%
-
in 2020, sized at 1,125.65 kilo tons; it is projected to exhibit the highest CAGR
-
of 7.42%.\r\nTABLE 215 JAPAN: METAL CASTING MARKET, BY END-USE INDUSTRY,
-
2030 (USD MILLION)\r\nEnd-use Industry 2019 2020 2021 2030 CAGR (2022-2030)\r\nAutomotive
-
& Transportation 4,978.32 4,668.20 4,925.46 10,192.75 8.42%\r\nBuilding
-
& Construction 1,977.52 1,845.21 1,937.35 3,837.68 7.89%\r\nMining 1,169.66
-
,085.97 1,134.47 2,144.03 7.33%\r\nEquipment & Machine 1,759.75 1,645.08
-
,730.46 3,486.13 8.09%\r\nConsumer Goods 1,291.91 1,203.51 1,261.54 2,461.63
-
%\r\nOthers 657.48 609.28 635.27 1,178.48 7.11%\r\nTotal 11,834.65
-
,057.26 11,624.55 23,300.69 8.03%\r\nSource: Indiana Cast Metal Association
-
(INCMA), American Foundry Society (AFS), The North American Die Casting Association,
-
NON-FERROUS FOUNDERS’ SOCIETY, Aluminium Casters’ Association of India,
-
Casting Industry Suppliers Association, International Trade Centre, World Trade
-
Centre, Government Websites, Press Releases, Journals, Annual Reports, Whitepapers,
-
Company Websites, and MRFR Analysis\r\nThe automotive & transportation
-
segment accounted for the largest market share of 42.22% in 2020, with a market
-
value of USD 4,668.2 million; it is expected to register the highest CAGR of 8.42%
-
during the forecast period. The building & construction segment accounted for
-
the second largest market share in 2020, valued at USD 1,845.2 million; it is projected
-
to exhibit a CAGR of 7.89%.\r\n \r\nTABLE 216 JAPAN: METAL CASTING
-
MARKET, BY END-USE INDUSTRY, 2022-2030 (KILO TONS)\r\nEnd-use Industry 2019
-
2021 2030 CAGR (2022-2030)\r\nAutomotive & Transportation 2,078.83
-
,934.48 2,018.01 3,755.71 7.15%\r\nBuilding & Construction 817.17 756.68
-
1,399.33 6.63%\r\nMining 473.47 436.24 450.58 765.82 6.07%\r\nEquipment
-
& Machine 719.68 667.66 694.37 1,258.05 6.83%\r\nConsumer Goods 517.68
-
495.98 870.39 6.45%\r\nOthers 259.37 237.75 244.29 394.33 5.46%\r\nTotal
-
,866.20 4,511.39 4,688.70 8,443.63 6.75%\r\nSource: Indiana Cast Metal Association
-
(INCMA), American Foundry Society (AFS), The North American Die Casting Association,
-
NON-FERROUS FOUNDERS’ SOCIETY, Aluminium Casters’ Association of India,
-
Casting Industry Suppliers Association, International Trade Centre, World Trade
-
Centre, Government Websites, Press Releases, Journals, Annual Reports, Whitepapers,
-
Company Websites, and MRFR Analysis\r\nThe automotive & transportation
-
segment dominated the market with a share of 42.88%, accounting for 1,934.48 kilo
-
tons in 2020; it is expected to register the highest CAGR of 7.15% from 2021 to
-
The building & construction segment was the second-largest with a share
-
of 16.77% in 2020, sized at 756.68 kilo tons; it is projected to exhibit a CAGR
-
of 6.63%.\r\nTABLE 217 JAPAN: METAL CASTING MARKET, BY AUTOMOTIVE & TRANSPORTATION,
-
2030 (USD MILLION)\r\nAutomotive & Transportation 2019 2020 2021
-
CAGR (2022-2030)\r\nGearbox 918.60 868.47 923.82 2,051.19 9.27%\r\nWheels
-
491.46 521.44 1,133.00 9.01%\r\nEngine Blocks 754.23 708.14 748.11
-
,565.76 8.55%\r\nCylinder Head 1,188.82 1,107.97 1,161.87 2,270.89 7.73%\r\nExhaust
-
Manifold 383.52 358.24 376.52 751.92 7.99%\r\nSeat Frame 438.91 411.10 433.26
-
8.29%\r\nOthers 773.07 722.82 760.44 1,532.57 8.10%\r\nTotal
-
,978.32 4,668.20 4,925.46 10,192.75 8.42%\r\nSource: Indiana Cast Metal
-
Association (INCMA), American Foundry Society (AFS), The North American Die Casting
-
Association, NON-FERROUS FOUNDERS’ SOCIETY, Aluminium Casters’ Association
-
of India, Casting Industry Suppliers Association, International Trade Centre, World
-
Trade Centre, Government Websites, Press Releases, Journals, Annual Reports, Whitepapers,
-
Company Websites, and MRFR Analysis\r\nThe cylinder head segment accounted
-
for the largest market share of 23.73% in 2020, with a market value of USD 1,108.0
-
million; it is expected to register a CAGR of 7.73% during the forecast period.
-
The gearbox segment accounted for the second largest market share in 2020, valued
-
at USD 868.5 million; it is projected to register the highest CAGR of 9.27%.\r\n \r\nTABLE
-
JAPAN: METAL CASTING MARKET, BY AUTOMOTIVE & TRANSPORTATION, 2022-2030 (KILO
-
TONS)\r\nAutomotive & Transportation 2019 2020 2021 2030 CAGR (2022-2030)\r\nGearbox
-
378.83 398.42 795.58 7.99%\r\nWheels 222.07 207.81 218.00 426.00 7.73%\r\nEngine
-
Blocks 328.07 305.68 319.28 600.97 7.28%\r\nCylinder Head 511.78 473.34 490.75
-
6.47%\r\nExhaust Manifold 161.77 149.95 155.82 279.86 6.72%\r\nSeat
-
Frame 183.28 170.36 177.51 326.99 7.02%\r\nOthers 268.09 248.51 258.23 463.69
-
%\r\nTotal 2,078.83 1,934.48 2,018.01 3,755.71 7.15%\r\nSource:
-
Indiana Cast Metal Association (INCMA), American Foundry Society (AFS), The North
-
American Die Casting Association, NON-FERROUS FOUNDERS’ SOCIETY, Aluminium
-
Casters’ Association of India, Casting Industry Suppliers Association, International
-
Trade Centre, World Trade Centre, Government Websites, Press Releases, Journals,
-
Annual Reports, Whitepapers, Company Websites, and MRFR Analysis\r\nThe cylinder
-
head segment dominated the market with a share of 24.47%, accounting for 473.34
-
kilo tons in 2020; it is projected to exhibit a CAGR of 6.47%. The Gearbox segment
-
was the second-largest with a share of 19.58% in 2020, sized at 378.83 kilo tons;
-
it is projected to exhibit the highest CAGR of 7.99%.\r\nTABLE 219 JAPAN:
-
METAL CASTING MARKET, BY EQUIPMENT & MACHINE, 2022-2030 (USD MILLION)\r\nEquipment
-
& Machine 2019 2020 2021 2030 CAGR (2022-2030)\r\nPumps & Valves
-
,008.99 941.62 988.77 1,960.89 7.90%\r\nOthers 750.76 703.47 741.69 1,525.25
-
%\r\nTotal 1,759.75 1,645.08 1,730.46 3,486.13 8.09%\r\nSource:
-
Indiana Cast Metal Association (INCMA), American Foundry Society (AFS), The North
-
American Die Casting Association, NON-FERROUS FOUNDERS’ SOCIETY, Aluminium
-
Casters’ Association of India, Casting Industry Suppliers Association, International
-
Trade Centre, World Trade Centre, Government Websites, Press Releases, Journals,
-
Annual Reports, Whitepapers, Company Websites, and MRFR Analysis\r\nThe pumps
-
& valves segment accounted for a larger market share of 57.24% in 2020, with
-
a market value of USD 941.6 million; it is expected to register a CAGR of 7.90%
-
during the forecast period. The Others segment was valued at USD 703.5 million;
-
it is projected to register a higher CAGR of 8.34%.\r\n \r\nTABLE
-
JAPAN: METAL CASTING MARKET, BY EQUIPMENT & MACHINE, 2022-2030 (KILO TONS)\r\nEquipment
-
& Machine 2019 2020 2021 2030 CAGR (2022-2030)\r\nPumps & Valves
-
386.01 400.76 714.78 6.64%\r\nOthers 302.87 281.64 293.60 543.27 7.08%\r\nTotal
-
667.66 694.37 1,258.05 6.83%\r\nSource: Indiana Cast Metal Association
-
(INCMA), American Foundry Society (AFS), The North American Die Casting Association,
-
NON-FERROUS FOUNDERS’ SOCIETY, Aluminium Casters’ Association of India,
-
Casting Industry Suppliers Association, International Trade Centre, World Trade
-
Centre, Government Websites, Press Releases, Journals, Annual Reports, Whitepapers,
-
Company Websites, and MRFR Analysis\r\nThe pumps & valves segment dominated
-
the market with a share of 57.82%, accounting for 386.01 kilo tons in 2020; it is
-
projected to exhibit a CAGR of 6.64%. The Others segment accounted for a share of
-
% in 2020, sized at 281.64 kilo tons; it is projected to exhibit a higher CAGR
-
of 7.08%.\r\n9.4.3 INDIA\r\nTABLE 221 INDIA: METAL CASTING MARKET,
-
BY MATERIAL TYPE, 2022-2030 (USD MILLION)\r\nMaterial Type 2019 2020 2021
-
CAGR (2022-2030)\r\nCast Iron 12,897.64 12,039.64 12,645.88 25,130.14
-
%\r\nAluminium 5,408.00 5,117.32 5,448.01 12,175.26 9.35%\r\nStainless
-
Steel 2,118.12 2,005.32 2,136.00 4,793.51 9.40%\r\nZinc 859.54 807.27 853.11
-
,791.15 8.59%\r\nMagnesium 673.06 629.34 662.14 1,336.44 8.12%\r\nCarbon
-
Steel 424.53 393.01 409.34 749.51 6.95%\r\nHigh Steel Alloy 789.83 736.68
-
1,524.35 7.83%\r\nOthers 1,257.91 1,150.22 1,182.75 1,881.47 5.29%\r\nTotal
-
,428.64 22,878.79 24,110.35 49,381.83 8.29%\r\nSource: Indiana Cast Metal
-
Association (INCMA), American Foundry Society (AFS), The North American Die Casting
-
Association, NON-FERROUS FOUNDERS’ SOCIETY, Aluminium Casters’ Association
-
of India, Casting Industry Suppliers Association, International Trade Centre, World
-
Trade Centre, Government Websites, Press Releases, Journals, Annual Reports, Whitepapers,
-
Company Websites, and MRFR Analysis\r\nThe cast iron segment accounted for
-
the largest market share of 52.62% in 2020, with a market value of USD 12,039.6
-
million; it is expected to register a CAGR of 7.93% during the forecast period.
-
The aluminium segment accounted for the second largest market share in 2020, valued
-
at USD 5,117.3 million; it is projected to exhibit a CAGR of 9.35%. However, the
-
stainless steel segment is expected to register the highest CAGR of 7.93%.\r\n \r\nTABLE
-
INDIA: METAL CASTING MARKET, BY MATERIAL TYPE, 2022-2030 (KILO TONS)\r\nMaterial
-
Type 2019 2020 2021 2030 CAGR (2022-2030)\r\nCast Iron 5,503.31 5,098.05
-
,294.22 9,461.78 6.66%\r\nAluminium 2,259.97 2,122.19 2,233.79 4,489.60
-
%\r\nStainless Steel 841.76 790.86 832.87 1,680.95 8.12%\r\nZinc
-
328.02 342.72 647.14 7.32%\r\nMagnesium 273.92 254.18 264.41 479.94
-
%\r\nCarbon Steel 180.19 165.54 170.47 280.72 5.70%\r\nHigh Steel
-
Alloy 333.50 308.69 320.30 567.95 6.57%\r\nOthers 536.74 487.05 495.16 708.40
-
%\r\nTotal 10,281.34 9,554.57 9,953.94 18,316.48 7.01%\r\nSource:
-
Indiana Cast Metal Association (INCMA), American Foundry Society (AFS), The North
-
American Die Casting Association, NON-FERROUS FOUNDERS’ SOCIETY, Aluminium
-
Casters’ Association of India, Casting Industry Suppliers Association, International
-
Trade Centre, World Trade Centre, Government Websites, Press Releases, Journals,
-
Annual Reports, Whitepapers, Company Websites, and MRFR Analysis\r\nThe cast
-
iron segment dominated the market with a share of 53.36%, accounting for 5,098.05
-
kilo tons in 2020 and is projected to register a CAGR of 6.66%. The aluminium segment
-
was the second-largest with a share of 22.21% in 2020, sized at 2,122.19 kilo tons;
-
it is projected to exhibit a CAGR of 8.07%. However, the stainless steel segment
-
is expected to register the highest CAGR of 8.12%.\r\nTABLE 223 INDIA: METAL
-
CASTING MARKET, BY PROCESS TYPE, 2022-2030 (USD MILLION)\r\nProcess Type
-
2020 2021 2030 CAGR (2022-2030)\r\nSand Casting 12,670.83 11,896.53
-
,568.08 26,315.34 8.56%\r\nDie Casting 5,627.31 5,304.26 5,625.57 12,180.93
-
%\r\nShell Mold Casting 1,789.39 1,666.65 1,746.66 3,398.67 7.68%\r\nGravity
-
Casting 1,634.01 1,499.29 1,547.29 2,566.73 5.78%\r\nVacuum Casting 740.23
-
699.79 1,149.76 5.67%\r\nInvestment Casting 1,200.60 1,121.95 1,179.74
-
,368.20 8.05%\r\nOthers 766.26 711.46 743.23 1,402.20 7.31%\r\nTotal
-
,428.64 22,878.79 24,110.35 49,381.83 8.29%\r\nSource: Indiana Cast Metal
-
Association (INCMA), American Foundry Society (AFS), The North American Die Casting
-
Association, NON-FERROUS FOUNDERS’ SOCIETY, Aluminium Casters’ Association
-
of India, Casting Industry Suppliers Association, International Trade Centre, World
-
Trade Centre, Government Websites, Press Releases, Journals, Annual Reports, Whitepapers,
-
Company Websites, and MRFR Analysis\r\nThe sand casting segment accounted
-
for the largest market share of 52.00% in 2020, with a market value of USD 11,896.5
-
million; it is expected to register a CAGR of 8.56% during the forecast period.
-
The die casting segment accounted for the second largest market share in 2020, valued
-
at USD 5,304.3 million; it is projected to register the highest CAGR of 8.96%.\r\n \r\nTABLE
-
INDIA: METAL CASTING MARKET, BY PROCESS TYPE, 2022-2030 (KILO TONS)\r\nProcess
-
Type 2019 2020 2021 2030 CAGR (2022-2030)\r\nSand Casting 5,522.80 5,145.78
-
,374.80 10,121.09 7.29%\r\nDie Casting 2,351.62 2,199.72 2,306.59 4,491.69
-
%\r\nShell Mold Casting 763.52 705.72 731.24 1,279.64 6.42%\r\nGravity
-
Casting 662.36 603.12 615.38 918.08 4.55%\r\nVacuum Casting 294.17 267.65
-
403.19 4.43%\r\nInvestment Casting 491.59 455.88 473.94 855.63 6.78%\r\nOthers
-
176.70 179.11 247.17 3.64%\r\nTotal 10,281.34 9,554.57 9,953.94 18,316.48
-
%\r\nSource: Indiana Cast Metal Association (INCMA), American Foundry
-
Society (AFS), The North American Die Casting Association, NON-FERROUS FOUNDERS’
-
SOCIETY, Aluminium Casters’ Association of India, Casting Industry Suppliers
-
Association, International Trade Centre, World Trade Centre, Government Websites,
-
Press Releases, Journals, Annual Reports, Whitepapers, Company Websites, and MRFR
-
Analysis\r\nThe sand casting segment dominated the market with a share of
-
%, accounting for 5,145.78 kilo tons in 2020; it is projected to exhibit a
-
CAGR of 7.29%. The die casting segment was the second-largest with a share of 23.02%
-
in 2020, sized at 2,199.72 kilo tons; it is projected to exhibit the highest CAGR
-
of 7.69%.\r\nTABLE 225 INDIA: METAL CASTING MARKET, BY END-USE INDUSTRY,
-
2030 (USD MILLION)\r\nEnd-use Industry 2019 2020 2021 2030 CAGR (2022-2030)\r\nAutomotive
-
& Transportation 9,544.83 8,974.36 9,494.43 20,126.86 8.71%\r\nBuilding
-
& Construction 4,502.47 4,211.78 4,433.19 8,982.17 8.16%\r\nMining 3,114.19
-
,902.32 3,043.49 5,956.23 7.75%\r\nEquipment & Machine 3,656.67 3,426.59
-
,613.07 7,437.32 8.35%\r\nConsumer Goods 2,205.25 2,058.06 2,161.16 4,285.03
-
%\r\nOthers 1,405.22 1,305.68 1,365.01 2,594.22 7.40%\r\nTotal
-
,428.64 22,878.79 24,110.35 49,381.83 8.29%\r\nSource: Indiana Cast Metal
-
Association (INCMA), American Foundry Society (AFS), The North American Die Casting
-
Association, NON-FERROUS FOUNDERS’ SOCIETY, Aluminium Casters’ Association
-
of India, Casting Industry Suppliers Association, International Trade Centre, World
-
Trade Centre, Government Websites, Press Releases, Journals, Annual Reports, Whitepapers,
-
Company Websites, and MRFR Analysis\r\nThe automotive & transportation
-
segment accounted for the largest market share of 39.23% in 2020, with a market
-
value of USD 8,974.4 million; it is expected to register the highest CAGR of 8.71%
-
during the forecast period. The building & construction segment accounted for
-
the second largest market share in 2020, valued at USD 4,211.8 million; it is projected
-
to exhibit a CAGR of 8.16%.\r\n \r\nTABLE 226 INDIA: METAL CASTING
-
MARKET, BY END-USE INDUSTRY, 2022-2030 (KILO TONS)\r\nEnd-use Industry 2019
-
2021 2030 CAGR (2022-2030)\r\nAutomotive & Transportation 4,072.70
-
,800.09 3,974.85 7,577.99 7.43%\r\nBuilding & Construction 1,901.15
-
,764.85 1,836.63 3,346.66 6.89%\r\nMining 1,288.12 1,191.33 1,235.16 2,173.93
-
%\r\nEquipment & Machine 1,528.10 1,421.04 1,481.43 2,742.50 7.08%\r\nConsumer
-
Goods 902.94 836.25 868.22 1,548.17 6.64%\r\nOthers 588.33 541.01 557.65
-
5.81%\r\nTotal 10,281.34 9,554.57 9,953.94 18,316.48 7.01%\r\nSource:
-
Indiana Cast Metal Association (INCMA), American Foundry Society (AFS), The North
-
American Die Casting Association, NON-FERROUS FOUNDERS’ SOCIETY, Aluminium
-
Casters’ Association of India, Casting Industry Suppliers Association, International
-
Trade Centre, World Trade Centre, Government Websites, Press Releases, Journals,
-
Annual Reports, Whitepapers, Company Websites, and MRFR Analysis\r\nThe automotive
-
& transportation segment dominated the market with a share of 39.77%, accounting
-
for 3,800.09 kilo tons in 2020; it is expected to register the highest CAGR of 7.43%
-
from 2021 to 2030. The building & construction segment was the second-largest
-
with a share of 18.47% in 2020, sized at 1,764.85 kilo tons; it is projected to
-
exhibit a CAGR of 6.89%.\r\nTABLE 227 INDIA: METAL CASTING MARKET, BY AUTOMOTIVE
-
& TRANSPORTATION, 2022-2030 (USD MILLION)\r\nAutomotive & Transportation
-
2020 2021 2030 CAGR (2022-2030)\r\nGearbox 1,870.50 1,772.34 1,889.48
-
,280.77 9.51%\r\nWheels 1,068.81 1,010.20 1,074.33 2,383.94 9.26%\r\nEngine
-
Blocks 1,279.36 1,204.62 1,276.25 2,740.25 8.86%\r\nCylinder Head 2,298.45
-
,148.02 2,258.69 4,524.54 8.03%\r\nExhaust Manifold 639.28 598.40 630.26
-
,282.26 8.21%\r\nSeat Frame 760.97 714.59 755.05 1,582.48 8.57%\r\nOthers
-
,627.47 1,526.18 1,610.37 3,332.61 8.42%\r\nTotal 9,544.83 8,974.36 9,494.43
-
,126.86 8.71%\r\nSource: Indiana Cast Metal Association (INCMA), American
-
Foundry Society (AFS), The North American Die Casting Association, NON-FERROUS FOUNDERS’
-
SOCIETY, Aluminium Casters’ Association of India, Casting Industry Suppliers
-
Association, International Trade Centre, World Trade Centre, Government Websites,
-
Press Releases, Journals, Annual Reports, Whitepapers, Company Websites, and MRFR
-
Analysis\r\nThe cylinder head segment accounted for the largest market share
-
of 23.94% in 2020, with a market value of USD 2,148.0 million; it is expected to
-
register a CAGR of 8.03% during the forecast period. The gearbox segment accounted
-
for the second largest market share in 2020, valued at USD 1,772.3 million; it is
-
projected to register the highest CAGR of 9.51%.\r\n \r\nTABLE
-
INDIA: METAL CASTING MARKET, BY AUTOMOTIVE & TRANSPORTATION, 2022-2030 (KILO
-
TONS)\r\nAutomotive & Transportation 2019 2020 2021 2030 CAGR (2022-2030)\r\nGearbox
-
789.98 832.67 1,696.59 8.23%\r\nWheels 465.36 436.49 458.95 915.90
-
%\r\nEngine Blocks 568.64 531.34 556.57 1,074.72 7.59%\r\nCylinder
-
Head 1,011.06 937.69 974.85 1,756.23 6.76%\r\nExhaust Manifold 275.53 255.95
-
487.66 6.94%\r\nSeat Frame 324.70 302.58 316.10 595.82 7.30%\r\nOthers
-
546.07 569.20 1,051.07 7.05%\r\nTotal 4,072.70 3,800.09 3,974.85 7,577.99
-
%\r\nSource: Indiana Cast Metal Association (INCMA), American Foundry
-
Society (AFS), The North American Die Casting Association, NON-FERROUS FOUNDERS’
-
SOCIETY, Aluminium Casters’ Association of India, Casting Industry Suppliers
-
Association, International Trade Centre, World Trade Centre, Government Websites,
-
Press Releases, Journals, Annual Reports, Whitepapers, Company Websites, and MRFR
-
Analysis\r\nThe cylinder head segment dominated the market with a share of
-
%, accounting for 937.69 kilo tons in 2020; it is projected to exhibit a CAGR
-
of 6.76%. The Gearbox segment was the second-largest with a share of 20.79% in 2020,
-
sized at 789.98 kilo tons; it is projected to exhibit the highest CAGR of 8.23%.\r\nTABLE
-
INDIA: METAL CASTING MARKET, BY EQUIPMENT & MACHINE, 2022-2030 (USD MILLION)\r\nEquipment
-
& Machine 2019 2020 2021 2030 CAGR (2022-2030)\r\nPumps & Valves
-
,997.84 1,868.74 1,966.86 3,982.42 8.15%\r\nOthers 1,658.83 1,557.85 1,646.20
-
,454.90 8.59%\r\nTotal 3,656.67 3,426.59 3,613.07 7,437.32 8.35%\r\nSource:
-
Indiana Cast Metal Association (INCMA), American Foundry Society (AFS), The North
-
American Die Casting Association, NON-FERROUS FOUNDERS’ SOCIETY, Aluminium
-
Casters’ Association of India, Casting Industry Suppliers Association, International
-
Trade Centre, World Trade Centre, Government Websites, Press Releases, Journals,
-
Annual Reports, Whitepapers, Company Websites, and MRFR Analysis\r\nThe pumps
-
& valves segment accounted for a larger market share of 54.54% in 2020, with
-
a market value of USD 1,868.7 million; it is expected to register a CAGR of 8.15%
-
during the forecast period. The Others segment was valued at USD 1,557.9 million;
-
it is projected to register a higher CAGR of 8.59%.\r\n \r\nTABLE
-
INDIA: METAL CASTING MARKET, BY EQUIPMENT & MACHINE, 2022-2030 (KILO TONS)\r\nEquipment
-
& Machine 2019 2020 2021 2030 CAGR (2022-2030)\r\nPumps & Valves
-
782.81 814.60 1,483.34 6.89%\r\nOthers 684.78 638.22 666.83 1,259.15
-
%\r\nTotal 1,528.10 1,421.04 1,481.43 2,742.50 7.08%\r\nSource:
-
Indiana Cast Metal Association (INCMA), American Foundry Society (AFS), The North
-
American Die Casting Association, NON-FERROUS FOUNDERS’ SOCIETY, Aluminium
-
Casters’ Association of India, Casting Industry Suppliers Association, International
-
Trade Centre, World Trade Centre, Government Websites, Press Releases, Journals,
-
Annual Reports, Whitepapers, Company Websites, and MRFR Analysis\r\nThe pumps
-
& valves segment dominated the market with a share of 55.09%, accounting for
-
kilo tons in 2020; it is projected to exhibit a CAGR of 6.89%. The Others
-
segment accounted for a share of 44.91% in 2020, sized at 638.22 kilo tons; it is
-
projected to exhibit a higher CAGR of 7.32%.\r\n9.4.4 SOUTH KOREA\r\nTABLE
-
SOUTH KOREA: METAL CASTING MARKET, BY MATERIAL TYPE, 2022-2030 (USD MILLION)\r\nMaterial
-
Type 2019 2020 2021 2030 CAGR (2022-2030)\r\nCast Iron 3,173.07 2,931.82
-
,047.85 5,498.90 6.78%\r\nAluminium 1,306.76 1,224.77 1,291.41 2,635.15
-
%\r\nStainless Steel 701.94 656.22 690.20 1,379.63 8.00%\r\nZinc
-
227.60 238.02 452.99 7.41%\r\nMagnesium 136.00 125.84 131.00 239.45
-
%\r\nCarbon Steel 94.29 86.26 88.78 145.10 5.61%\r\nHigh Steel
-
Alloy 162.60 149.99 155.66 276.41 6.59%\r\nOthers 419.39 381.78 390.89 604.60
-
%\r\nTotal 6,238.94 5,784.28 6,033.80 11,232.24 7.15%\r\nSource:
-
Indiana Cast Metal Association (INCMA), American Foundry Society (AFS), The North
-
American Die Casting Association, NON-FERROUS FOUNDERS’ SOCIETY, Aluminium
-
Casters’ Association of India, Casting Industry Suppliers Association, International
-
Trade Centre, World Trade Centre, Government Websites, Press Releases, Journals,
-
Annual Reports, Whitepapers, Company Websites, and MRFR Analysis\r\nThe cast
-
iron segment accounted for the largest market share of 50.69% in 2020, with a market
-
value of USD 2,931.8 million; it is expected to register a CAGR of 6.78% during
-
the forecast period. The aluminium segment accounted for the second largest market
-
share in 2020, valued at USD 1,224.8 million; it is projected to register the highest
-
CAGR of 8.25%.\r\n \r\nTABLE 232 SOUTH KOREA: METAL CASTING MARKET,
-
BY MATERIAL TYPE, 2022-2030 (KILO TONS)\r\nMaterial Type 2019 2020 2021 2030
-
CAGR (2022-2030)\r\nCast Iron 1,340.62 1,229.25 1,263.45 2,050.06 5.53%\r\nAluminium
-
502.93 524.30 962.16 6.98%\r\nStainless Steel 276.22 256.26 266.48
-
6.73%\r\nZinc 99.28 91.57 94.68 162.06 6.15%\r\nMagnesium 54.81
-
51.80 85.15 5.68%\r\nCarbon Steel 39.63 35.98 36.61 53.81 4.37%\r\nHigh
-
Steel Alloy 67.98 62.23 63.86 101.98 5.34%\r\nOthers 177.19 160.07 162.04
-
3.74%\r\nTotal 2,596.46 2,388.62 2,463.21 4,119.66 5.88%\r\nSource:
-
Indiana Cast Metal Association (INCMA), American Foundry Society (AFS), The North
-
American Die Casting Association, NON-FERROUS FOUNDERS’ SOCIETY, Aluminium
-
Casters’ Association of India, Casting Industry Suppliers Association, International
-
Trade Centre, World Trade Centre, Government Websites, Press Releases, Journals,
-
Annual Reports, Whitepapers, Company Websites, and MRFR Analysis\r\nThe cast
-
iron segment dominated the market with a share of 51.46%, accounting for 1,229.25
-
kilo tons in 2020; it is projected to exhibit a CAGR of 5.53%. The aluminium segment
-
was the second-largest with a share of 21.06% in 2020, sized at 502.93 kilo tons;
-
it is projected to exhibit the highest CAGR of 6.98%.\r\nTABLE 233 SOUTH
-
KOREA: METAL CASTING MARKET, BY PROCESS TYPE, 2022-2030 (USD MILLION)\r\nProcess
-
Type 2019 2020 2021 2030 CAGR (2022-2030)\r\nSand Casting 3,045.24 2,830.81
-
,960.74 5,642.27 7.43%\r\nDie Casting 1,416.31 1,322.26 1,388.85 2,745.27
-
%\r\nShell Mold Casting 535.40 494.05 512.93 914.09 6.63%\r\nGravity
-
Casting 399.37 362.43 369.89 551.77 4.54%\r\nVacuum Casting 188.30 170.89
-
260.28 4.55%\r\nInvestment Casting 354.92 328.42 341.93 625.51 6.94%\r\nOthers
-
275.43 285.06 493.05 6.28%\r\nTotal 6,238.94 5,784.28 6,033.80 11,232.24
-
%\r\nSource: Indiana Cast Metal Association (INCMA), American Foundry
-
Society (AFS), The North American Die Casting Association, NON-FERROUS FOUNDERS’
-
SOCIETY, Aluminium Casters’ Association of India, Casting Industry Suppliers
-
Association, International Trade Centre, World Trade Centre, Government Websites,
-
Press Releases, Journals, Annual Reports, Whitepapers, Company Websites, and MRFR
-
Analysis\r\nThe sand casting segment accounted for the largest market share
-
of 48.94% in 2020, with a market value of USD 2,830.8 million; it is expected to
-
register a CAGR of 7.43% during the forecast period. The die casting segment accounted
-
for the second largest market share in 2020, valued at USD 1,322.3 million; it is
-
projected to register the highest CAGR of 7.87%.\r\n \r\nTABLE
-
SOUTH KOREA: METAL CASTING MARKET, BY PROCESS TYPE, 2022-2030 (KILO TONS)\r\nProcess
-
Type 2019 2020 2021 2030 CAGR (2022-2030)\r\nSand Casting 1,314.28 1,212.42
-
,253.73 2,148.75 6.17%\r\nDie Casting 586.05 542.97 563.86 1,002.37 6.60%\r\nShell
-
Mold Casting 226.21 207.14 212.63 340.78 5.38%\r\nGravity Casting 160.30
-
145.67 195.42 3.32%\r\nVacuum Casting 74.10 66.73 67.34 90.37 3.32%\r\nInvestment
-
Casting 143.89 132.14 136.02 223.78 5.69%\r\nOthers 91.63 82.86 83.97 118.19
-
%\r\nTotal 2,596.46 2,388.62 2,463.21 4,119.66 5.88%\r\nSource:
-
Indiana Cast Metal Association (INCMA), American Foundry Society (AFS), The North
-
American Die Casting Association, NON-FERROUS FOUNDERS’ SOCIETY, Aluminium
-
Casters’ Association of India, Casting Industry Suppliers Association, International
-
Trade Centre, World Trade Centre, Government Websites, Press Releases, Journals,
-
Annual Reports, Whitepapers, Company Websites, and MRFR Analysis\r\nThe sand
-
casting segment dominated the market with a share of 50.76%, accounting for 1,212.42
-
kilo tons in 2020; it is projected to exhibit a CAGR of 6.17%. The die casting segment
-
was the second-largest with a share of 22.73% in 2020, sized at 542.97 kilo tons;
-
it is projected to exhibit the highest CAGR of 6.60%.\r\nTABLE 235 SOUTH
-
KOREA: METAL CASTING MARKET, BY END-USE INDUSTRY, 2022-2030 (USD MILLION)\r\nEnd-use
-
Industry 2019 2020 2021 2030 CAGR (2022-2030)\r\nAutomotive & Transportation
-
,558.86 2,381.24 2,493.18 4,795.60 7.54%\r\nBuilding & Construction
-
,100.84 1,019.36 1,062.01 1,954.88 7.01%\r\nMining 617.42 568.84 589.63
-
,034.96 6.45%\r\nEquipment & Machine 980.02 909.08 948.80 1,774.60 7.20%\r\nConsumer
-
Goods 681.36 629.85 655.09 1,187.16 6.83%\r\nOthers 300.43 275.92 285.09
-
6.08%\r\nTotal 6,238.94 5,784.28 6,033.80 11,232.24 7.15%\r\nSource:
-
Indiana Cast Metal Association (INCMA), American Foundry Society (AFS), The North
-
American Die Casting Association, NON-FERROUS FOUNDERS’ SOCIETY, Aluminium
-
Casters’ Association of India, Casting Industry Suppliers Association, International
-
Trade Centre, World Trade Centre, Government Websites, Press Releases, Journals,
-
Annual Reports, Whitepapers, Company Websites, and MRFR Analysis\r\nThe automotive
-
& transportation segment accounted for the largest market share of 41.17% in
-
, with a market value of USD 2,381.2 million; it is expected to register the
-
highest CAGR of 7.54% during the forecast period. The building & construction
-
segment accounted for the second largest market share in 2020, valued at USD 1,019.4
-
million; it is projected to exhibit a CAGR of 7.01%.\r\n \r\nTABLE
-
SOUTH KOREA: METAL CASTING MARKET, BY END-USE INDUSTRY, 2022-2030 (KILO TONS)\r\nEnd-use
-
Industry 2019 2020 2021 2030 CAGR (2022-2030)\r\nAutomotive & Transportation
-
,081.12 998.40 1,033.52 1,787.86 6.28%\r\nBuilding & Construction 460.26
-
435.66 721.21 5.76%\r\nMining 252.88 231.20 236.94 374.03 5.20%\r\nEquipment
-
& Machine 405.52 373.30 385.21 647.95 5.95%\r\nConsumer Goods 276.24
-
260.59 424.70 5.58%\r\nOthers 120.43 109.36 111.30 163.90 4.39%\r\nTotal
-
,596.46 2,388.62 2,463.21 4,119.66 5.88%\r\nSource: Indiana Cast Metal Association
-
(INCMA), American Foundry Society (AFS), The North American Die Casting Association,
-
NON-FERROUS FOUNDERS’ SOCIETY, Aluminium Casters’ Association of India,
-
Casting Industry Suppliers Association, International Trade Centre, World Trade
-
Centre, Government Websites, Press Releases, Journals, Annual Reports, Whitepapers,
-
Company Websites, and MRFR Analysis\r\nThe automotive & transportation
-
segment dominated the market with a share of 41.80%, accounting for 998.40 kilo
-
tons in 2020; it is expected to register the highest CAGR of 6.28% from 2021 to
-
The building & construction segment was the second-largest with a share
-
of 17.71% in 2020, sized at 422.94 kilo tons; it is projected to exhibit a CAGR
-
of 5.76%.\r\nTABLE 237 SOUTH KOREA: METAL CASTING MARKET, BY AUTOMOTIVE &
-
TRANSPORTATION, 2022-2030\r\n(USD MILLION)\r\nAutomotive & Transportation
-
2020 2021 2030 CAGR (2022-2030)\r\nGearbox 471.15 442.07 466.64 963.18
-
%\r\nWheels 317.07 296.46 311.86 625.24 8.04%\r\nEngine Blocks
-
348.81 365.69 711.69 7.68%\r\nCylinder Head 607.19 561.58 584.35 1,061.19
-
%\r\nExhaust Manifold 130.81 121.03 125.98 229.49 6.89%\r\nSeat
-
Frame 211.46 196.55 205.54 391.03 7.41%\r\nOthers 446.84 414.75 433.13 813.79
-
%\r\nTotal 2,558.86 2,381.24 2,493.18 4,795.60 7.54%\r\nSource:
-
Indiana Cast Metal Association (INCMA), American Foundry Society (AFS), The North
-
American Die Casting Association, NON-FERROUS FOUNDERS’ SOCIETY, Aluminium
-
Casters’ Association of India, Casting Industry Suppliers Association, International
-
Trade Centre, World Trade Centre, Government Websites, Press Releases, Journals,
-
Annual Reports, Whitepapers, Company Websites, and MRFR Analysis\r\nThe cylinder
-
head segment accounted for the largest market share of 23.58% in 2020, with a market
-
value of USD 561.6 million; it is expected to register a CAGR of 6.85% during the
-
forecast period. The gearbox segment accounted for the second largest market share
-
in 2020, valued at USD 442.1 million; it is projected to register the highest CAGR
-
of 8.39%.\r\nTABLE 238 SOUTH KOREA: METAL CASTING MARKET, BY AUTOMOTIVE &
-
TRANSPORTATION, 2022-2030\r\n(KILO TONS)\r\nAutomotive & Transportation
-
2020 2021 2030 CAGR (2022-2030)\r\nGearbox 209.54 195.10 203.62 377.98
-
%\r\nWheels 136.69 126.84 131.92 237.85 6.77%\r\nEngine Blocks
-
152.34 157.91 276.38 6.42%\r\nCylinder Head 264.47 242.74 249.73 407.86
-
%\r\nExhaust Manifold 55.83 51.26 52.75 86.42 5.64%\r\nSeat Frame
-
82.41 85.20 145.78 6.15%\r\nOthers 160.49 147.72 152.40 255.58 5.91%\r\nTotal
-
,081.12 998.40 1,033.52 1,787.86 6.28%\r\nSource: Indiana Cast Metal Association
-
(INCMA), American Foundry Society (AFS), The North American Die Casting Association,
-
NON-FERROUS FOUNDERS’ SOCIETY, Aluminium Casters’ Association of India,
-
Casting Industry Suppliers Association, International Trade Centre, World Trade
-
Centre, Government Websites, Press Releases, Journals, Annual Reports, Whitepapers,
-
Company Websites, and MRFR Analysis\r\nThe cylinder head segment dominated
-
the market with a share of 24.31%, accounting for 242.74 kilo tons in 2020; it is
-
projected to exhibit a CAGR of 5.60%. The Gearbox segment was the second-largest
-
with a share of 19.54% in 2020, sized at 195.10 kilo tons; it is projected to exhibit
-
the highest CAGR of 7.11%.\r\nTABLE 239 SOUTH KOREA: METAL CASTING MARKET,
-
BY EQUIPMENT & MACHINE, 2022-2030 (USD MILLION)\r\nEquipment & Machine
-
2020 2021 2030 CAGR (2022-2030)\r\nPumps & Valves 535.26 495.61
-
949.90 7.01%\r\nOthers 444.77 413.47 432.48 824.70 7.44%\r\nTotal
-
909.08 948.80 1,774.60 7.20%\r\nSource: Indiana Cast Metal Association
-
(INCMA), American Foundry Society (AFS), The North American Die Casting Association,
-
NON-FERROUS FOUNDERS’ SOCIETY, Aluminium Casters’ Association of India,
-
Casting Industry Suppliers Association, International Trade Centre, World Trade
-
Centre, Government Websites, Press Releases, Journals, Annual Reports, Whitepapers,
-
Company Websites, and MRFR Analysis\r\nThe pumps & valves segment accounted
-
for a larger market share of 54.52% in 2020, with a market value of USD 495.6 million;
-
it is expected to register a CAGR of 7.01% during the forecast period. The Others
-
segment was valued at USD 413.5 million; it is projected to register a higher CAGR
-
of 7.44%.\r\n \r\nTABLE 240 SOUTH KOREA: METAL CASTING MARKET,
-
BY EQUIPMENT & MACHINE, 2022-2030 (KILO TONS)\r\nEquipment & Machine
-
2020 2021 2030 CAGR (2022-2030)\r\nPumps & Valves 223.72 205.57
-
350.34 5.75%\r\nOthers 181.80 167.73 173.46 297.62 6.18%\r\nTotal
-
373.30 385.21 647.95 5.95%\r\nSource: Indiana Cast Metal Association
-
(INCMA), American Foundry Society (AFS), The North American Die Casting Association,
-
NON-FERROUS FOUNDERS’ SOCIETY, Aluminium Casters’ Association of India,
-
Casting Industry Suppliers Association, International Trade Centre, World Trade
-
Centre, Government Websites, Press Releases, Journals, Annual Reports, Whitepapers,
-
Company Websites, and MRFR Analysis\r\nThe pumps & valves segment dominated
-
the market with a share of 55.07%, accounting for 205.57 kilo tons in 2020; it is
-
projected to exhibit a CAGR of 5.75%. The Others segment accounted for a share of
-
% in 2020, sized at 167.73 kilo tons; it is projected to exhibit a higher CAGR
-
of 6.18%.\r\n9.4.5 AUSTRALIA & NEW ZEALAND\r\nTABLE 241 AUSTRALIA
-
& NEW ZEALAND: METAL CASTING MARKET, BY MATERIAL TYPE, 2022-2030 (USD MILLION)\r\nMaterial
-
Type 2019 2020 2021 2030 CAGR (2022-2030)\r\nCast Iron 2,796.95 2,598.05
-
,715.42 5,158.61 7.39%\r\nAluminium 1,289.59 1,214.17 1,286.15 2,746.60
-
%\r\nStainless Steel 648.77 609.70 644.69 1,356.47 8.62%\r\nZinc
-
191.61 201.52 404.98 8.06%\r\nMagnesium 141.27 131.45 137.63 265.72
-
%\r\nCarbon Steel 76.91 70.64 72.99 123.72 6.04%\r\nHigh Steel
-
Alloy 182.08 169.02 176.54 333.39 7.32%\r\nOthers 324.28 295.85 303.56 476.70
-
%\r\nTotal 5,664.84 5,280.49 5,538.51 10,866.19 7.78%\r\nSource:
-
Indiana Cast Metal Association (INCMA), American Foundry Society (AFS), The North
-
American Die Casting Association, NON-FERROUS FOUNDERS’ SOCIETY, Aluminium
-
Casters’ Association of India, Casting Industry Suppliers Association, International
-
Trade Centre, World Trade Centre, Government Websites, Press Releases, Journals,
-
Annual Reports, Whitepapers, Company Websites, and MRFR Analysis\r\nThe cast
-
iron segment accounted for the largest market share of 49.20% in 2020, with a market
-
value of USD 2,598.0 million; it is expected to register a CAGR of 7.39% during
-
the forecast period. The aluminium segment accounted for the second largest market
-
share in 2020, valued at USD 1,214.2 million; it is projected to register the highest
-
CAGR of 8.80%.\r\n \r\nTABLE 242 AUSTRALIA & NEW ZEALAND:
-
METAL CASTING MARKET, BY MATERIAL TYPE, 2022-2030 (KILO TONS)\r\nMaterial
-
Type 2019 2020 2021 2030 CAGR (2022-2030)\r\nCast Iron 1,178.24 1,086.11
-
,122.34 1,917.54 6.13%\r\nAluminium 532.05 497.11 520.63 999.91 7.52%\r\nStainless
-
Steel 254.54 237.39 248.18 469.62 7.34%\r\nZinc 82.87 76.86 79.93 144.46
-
%\r\nMagnesium 56.76 52.42 54.26 94.21 6.32%\r\nCarbon Steel 32.23
-
30.01 45.75 4.80%\r\nHigh Steel Alloy 75.90 69.92 72.21 122.63 6.06%\r\nOthers
-
123.68 125.47 177.20 3.91%\r\nTotal 2,349.20 2,172.87 2,253.02 3,971.32
-
%\r\nSource: Indiana Cast Metal Association (INCMA), American Foundry
-
Society (AFS), The North American Die Casting Association, NON-FERROUS FOUNDERS’
-
SOCIETY, Aluminium Casters’ Association of India, Casting Industry Suppliers
-
Association, International Trade Centre, World Trade Centre, Government Websites,
-
Press Releases, Journals, Annual Reports, Whitepapers, Company Websites, and MRFR
-
Analysis\r\nThe cast iron segment dominated the market with a share of 49.98%,
-
accounting for 1,086.11 kilo tons in 2020; it is projected to exhibit a CAGR of
-
%. The aluminium segment was the second-largest with a share of 22.88% in 2020,
-
sized at 497.11 kilo tons; it is projected to exhibit the highest CAGR of 7.52%.\r\nTABLE
-
AUSTRALIA & NEW ZEALAND: METAL CASTING MARKET, BY PROCESS TYPE, 2022-2030
-
(USD MILLION)\r\nProcess Type 2019 2020 2021 2030 CAGR (2022-2030)\r\nSand
-
Casting 2,757.91 2,577.62 2,710.74 5,444.68 8.06%\r\nDie Casting 1,401.67
-
,314.91 1,387.91 2,877.32 8.44%\r\nShell Mold Casting 377.05 349.35 364.20
-
7.10%\r\nGravity Casting 301.95 274.32 280.23 417.66 4.53%\r\nVacuum
-
Casting 211.19 193.49 199.41 328.89 5.72%\r\nInvestment Casting 382.01 355.51
-
719.61 7.60%\r\nOthers 233.06 215.29 223.75 402.69 6.75%\r\nTotal
-
,664.84 5,280.49 5,538.51 10,866.19 7.78%\r\nSource: Indiana Cast Metal
-
Association (INCMA), American Foundry Society (AFS), The North American Die Casting
-
Association, NON-FERROUS FOUNDERS’ SOCIETY, Aluminium Casters’ Association
-
of India, Casting Industry Suppliers Association, International Trade Centre, World
-
Trade Centre, Government Websites, Press Releases, Journals, Annual Reports, Whitepapers,
-
Company Websites, and MRFR Analysis\r\nThe sand casting segment accounted
-
for the largest market share of 48.81% in 2020, with a market value of USD 2,577.6
-
million; it is expected to register a CAGR of 8.06% during the forecast period.
-
The die casting segment accounted for the second largest market share in 2020, valued
-
at USD 1,314.9 million; it is projected to register the highest CAGR of 8.44%.\r\n \r\nTABLE
-
AUSTRALIA & NEW ZEALAND: METAL CASTING MARKET, BY PROCESS TYPE, 2022-2030
-
(KILO TONS)\r\nProcess Type 2019 2020 2021 2030 CAGR (2022-2030)\r\nSand
-
Casting 1,186.78 1,100.74 1,144.50 2,067.40 6.79%\r\nDie Casting 578.29 538.36
-
1,047.50 7.17%\r\nShell Mold Casting 158.83 146.04 150.53 251.04 5.85%\r\nGravity
-
Casting 120.84 108.94 110.03 147.49 3.31%\r\nVacuum Casting 82.86 75.34 76.76
-
4.48%\r\nInvestment Casting 154.42 142.62 147.65 256.68 6.34%\r\nOthers
-
60.83 61.72 87.35 3.93%\r\nTotal 2,349.20 2,172.87 2,253.02 3,971.32
-
%\r\nSource: Indiana Cast Metal Association (INCMA), American Foundry
-
Society (AFS), The North American Die Casting Association, NON-FERROUS FOUNDERS’
-
SOCIETY, Aluminium Casters’ Association of India, Casting Industry Suppliers
-
Association, International Trade Centre, World Trade Centre, Government Websites,
-
Press Releases, Journals, Annual Reports, Whitepapers, Company Websites, and MRFR
-
Analysis\r\nThe sand casting segment dominated the market with a share of
-
%, accounting for 1,100.74 kilo tons in 2020; it is projected to exhibit a
-
CAGR of 6.79%. The die casting segment was the second-largest with a share of 24.78%
-
in 2020, sized at 538.36 kilo tons; it is projected to exhibit the highest CAGR
-
of 7.17%.\r\nTABLE 245 AUSTRALIA & NEW ZEALAND: METAL CASTING MARKET,
-
BY END-USE INDUSTRY, 2022-2030\r\n(USD MILLION)\r\nEnd-use Industry
-
2020 2021 2030 CAGR (2022-2030)\r\nAutomotive & Transportation 2,259.56
-
,114.33 2,226.11 4,516.91 8.18%\r\nBuilding & Construction 1,044.13
-
1,018.41 1,976.59 7.65%\r\nMining 715.54 663.70 692.67 1,298.09 7.23%\r\nEquipment
-
& Machine 894.69 834.43 875.66 1,726.06 7.83%\r\nConsumer Goods 560.06
-
544.04 1,036.23 7.42%\r\nOthers 190.86 175.53 181.61 312.32 6.21%\r\nTotal
-
,664.84 5,280.49 5,538.51 10,866.19 7.78%\r\nSource: Indiana Cast Metal
-
Association (INCMA), American Foundry Society (AFS), The North American Die Casting
-
Association, NON-FERROUS FOUNDERS’ SOCIETY, Aluminium Casters’ Association
-
of India, Casting Industry Suppliers Association, International Trade Centre, World
-
Trade Centre, Government Websites, Press Releases, Journals, Annual Reports, Whitepapers,
-
Company Websites, and MRFR Analysis\r\nThe automotive & transportation
-
segment accounted for the largest market share of 40.04% in 2020, with a market
-
value of USD 2,114.3 million; it is expected to register the highest CAGR of 8.18%
-
during the forecast period. The building & construction segment accounted for
-
the second largest market share in 2020, valued at USD 972.1 million; it is projected
-
to exhibit a CAGR of 7.65%.\r\n \r\nTABLE 246 AUSTRALIA &
-
NEW ZEALAND: METAL CASTING MARKET, BY END-USE INDUSTRY, 2022-2030\r\n(KILO
-
TONS)\r\nEnd-use Industry 2019 2020 2021 2030 CAGR (2022-2030)\r\nAutomotive
-
& Transportation 951.86 883.89 920.10 1,679.01 6.91%\r\nBuilding &
-
Construction 435.27 402.16 416.54 727.08 6.38%\r\nMining 292.20 268.96 277.53
-
5.97%\r\nEquipment & Machine 369.13 341.64 354.46 628.38 6.57%\r\nConsumer
-
Goods 226.40 208.75 215.78 369.62 6.16%\r\nOthers 74.35 67.47 68.60 99.48
-
%\r\nTotal 2,349.20 2,172.87 2,253.02 3,971.32 6.50%\r\nSource:
-
Indiana Cast Metal Association (INCMA), American Foundry Society (AFS), The North
-
American Die Casting Association, NON-FERROUS FOUNDERS’ SOCIETY, Aluminium
-
Casters’ Association of India, Casting Industry Suppliers Association, International
-
Trade Centre, World Trade Centre, Government Websites, Press Releases, Journals,
-
Annual Reports, Whitepapers, Company Websites, and MRFR Analysis\r\nThe automotive
-
& transportation segment dominated the market with a share of 40.68%, accounting
-
for 883.89 kilo tons in 2020; it is expected to register the highest CAGR of 6.91%
-
from 2021 to 2030. The building & construction segment was the second-largest
-
with a share of 18.51% in 2020, sized at 402.16 kilo tons; it is projected to exhibit
-
a CAGR of 6.38%.\r\nTABLE 247 AUSTRALIA & NEW ZEALAND: METAL CASTING
-
MARKET, BY AUTOMOTIVE & TRANSPORTATION,\r\n2022-2030 (USD MILLION)\r\nAutomotive
-
& Transportation 2019 2020 2021 2030 CAGR (2022-2030)\r\nGearbox 485.62
-
485.20 1,046.29 8.91%\r\nWheels 238.76 224.66 237.84 506.50 8.76%\r\nEngine
-
Blocks 293.55 275.09 290.06 596.35 8.34%\r\nCylinder Head 530.03 492.89 515.71
-
7.48%\r\nExhaust Manifold 154.96 144.38 151.35 295.02 7.70%\r\nSeat
-
Frame 178.79 167.09 175.70 352.44 8.04%\r\nOthers 377.84 352.60 370.25 733.04
-
%\r\nTotal 2,259.56 2,114.33 2,226.11 4,516.91 8.18%\r\nSource:
-
Indiana Cast Metal Association (INCMA), American Foundry Society (AFS), The North
-
American Die Casting Association, NON-FERROUS FOUNDERS’ SOCIETY, Aluminium
-
Casters’ Association of India, Casting Industry Suppliers Association, International
-
Trade Centre, World Trade Centre, Government Websites, Press Releases, Journals,
-
Annual Reports, Whitepapers, Company Websites, and MRFR Analysis\r\nThe cylinder
-
head segment accounted for the largest market share of 23.31% in 2020, with a market
-
value of USD 492.9 million; it is expected to register a CAGR of 7.48% during the
-
forecast period. The gearbox segment accounted for the second largest market share
-
in 2020, valued at USD 457.6 million; it is projected to register the highest CAGR
-
of 8.91%.\r\nTABLE 248 AUSTRALIA & NEW ZEALAND: METAL CASTING MARKET,
-
BY AUTOMOTIVE & TRANSPORTATION,\r\n2022-2030 (KILO TONS)\r\nAutomotive
-
& Transportation 2019 2020 2021 2030 CAGR (2022-2030)\r\nGearbox 215.34
-
211.10 409.39 7.64%\r\nWheels 102.63 95.83 100.31 192.12 7.49%\r\nEngine
-
Blocks 128.81 119.79 124.88 230.91 7.07%\r\nCylinder Head 230.19 212.42 219.74
-
6.22%\r\nExhaust Manifold 65.94 60.97 63.19 110.77 6.44%\r\nSeat
-
Frame 75.32 69.85 72.62 131.01 6.78%\r\nOthers 133.63 123.65 128.25 226.48
-
%\r\nTotal 951.86 883.89 920.10 1,679.01 6.91%\r\nSource: Indiana
-
Cast Metal Association (INCMA), American Foundry Society (AFS), The North American
-
Die Casting Association, NON-FERROUS FOUNDERS’ SOCIETY, Aluminium Casters’
-
Association of India, Casting Industry Suppliers Association, International Trade
-
Centre, World Trade Centre, Government Websites, Press Releases, Journals, Annual
-
Reports, Whitepapers, Company Websites, and MRFR Analysis\r\nThe cylinder
-
head segment dominated the market with a share of 24.03%, accounting for 212.42
-
kilo tons in 2020; it is projected to exhibit a CAGR of 6.22%. The Gearbox segment
-
was the second-largest with a share of 22.78% in 2020, sized at 201.38 kilo tons;
-
it is projected to exhibit the highest CAGR of 7.64%.\r\nTABLE 249 AUSTRALIA
-
& NEW ZEALAND: METAL CASTING MARKET, BY EQUIPMENT & MACHINE, 2022-2030\r\n(USD
-
MILLION)\r\nEquipment & Machine 2019 2020 2021 2030 CAGR (2022-2030)\r\nPumps
-
& Valves 508.74 473.65 496.18 962.68 7.64%\r\nOthers 385.95 360.78 379.47
-
8.08%\r\nTotal 894.69 834.43 875.66 1,726.06 7.83%\r\nSource:
-
Indiana Cast Metal Association (INCMA), American Foundry Society (AFS), The North
-
American Die Casting Association, NON-FERROUS FOUNDERS’ SOCIETY, Aluminium
-
Casters’ Association of India, Casting Industry Suppliers Association, International
-
Trade Centre, World Trade Centre, Government Websites, Press Releases, Journals,
-
Annual Reports, Whitepapers, Company Websites, and MRFR Analysis\r\nThe pumps
-
& valves segment accounted for a larger market share of 56.76% in 2020, with
-
a market value of USD 473.6 million; it is expected to register a CAGR of 7.64%
-
during the forecast period. The Others segment was valued at USD 360.8 million;
-
it is projected to register a higher CAGR of 8.08%.\r\n \r\nTABLE
-
AUSTRALIA & NEW ZEALAND: METAL CASTING MARKET, BY EQUIPMENT & MACHINE,
-
2030\r\n(KILO TONS)\r\nEquipment & Machine 2019 2020 2021
-
CAGR (2022-2030)\r\nPumps & Valves 212.01 195.88 202.88 354.01 6.38%\r\nOthers
-
145.75 151.58 274.37 6.82%\r\nTotal 369.13 341.64 354.46 628.38 6.57%\r\nSource:
-
Indiana Cast Metal Association (INCMA), American Foundry Society (AFS), The North
-
American Die Casting Association, NON-FERROUS FOUNDERS’ SOCIETY, Aluminium
-
Casters’ Association of India, Casting Industry Suppliers Association, International
-
Trade Centre, World Trade Centre, Government Websites, Press Releases, Journals,
-
Annual Reports, Whitepapers, Company Websites, and MRFR Analysis\r\nThe pumps
-
& valves segment dominated the market with a share of 57.34%, accounting for
-
kilo tons in 2020; it is projected to exhibit a CAGR of 6.38%. The Others
-
segment accounted for a share of 42.66% in 2020, sized at 145.75 kilo tons; it is
-
projected to exhibit a higher CAGR of 6.82%.\r\n9.4.6 REST OF ASIA-PACIFIC\r\nTABLE
-
REST OF ASIA-PACIFIC: METAL CASTING MARKET, BY MATERIAL TYPE, 2022-2030 (USD
-
MILLION)\r\nMaterial Type 2019 2020 2021 2030 CAGR (2022-2030)\r\nCast
-
Iron 4,607.79 4,183.83 4,271.48 6,317.53 4.44%\r\nAluminium 2,058.81 1,894.60
-
,960.21 3,255.88 5.80%\r\nStainless Steel 836.97 766.82 789.94 1,265.38
-
%\r\nZinc 391.15 357.18 366.74 570.93 5.04%\r\nMagnesium 243.94
-
226.93 341.15 4.63%\r\nCarbon Steel 178.64 161.11 163.36 226.10 3.68%\r\nHigh
-
Steel Alloy 330.48 300.00 306.20 451.79 4.42%\r\nOthers 390.03 348.58 350.16
-
2.55%\r\nTotal 9,037.81 8,234.00 8,435.02 12,867.90 4.80%\r\nSource:
-
Indiana Cast Metal Association (INCMA), American Foundry Society (AFS), The North
-
American Die Casting Association, NON-FERROUS FOUNDERS’ SOCIETY, Aluminium
-
Casters’ Association of India, Casting Industry Suppliers Association, International
-
Trade Centre, World Trade Centre, Government Websites, Press Releases, Journals,
-
Annual Reports, Whitepapers, Company Websites, and MRFR Analysis\r\nThe cast
-
iron segment accounted for the largest market share of 50.81% in 2020, with a market
-
value of USD 4,183.8 million; it is expected to register a CAGR of 4.44% during
-
the forecast period. The aluminium segment accounted for the second largest market
-
share in 2020, valued at USD 1,894.6 million; it is projected to register the highest
-
CAGR of 5.80%.\r\n \r\nTABLE 252 REST OF ASIA-PACIFIC: METAL
-
CASTING MARKET, BY MATERIAL TYPE, 2022-2030 (KILO TONS)\r\nMaterial Type
-
2020 2021 2030 CAGR (2022-2030)\r\nCast Iron 1,962.21 1,768.09 1,784.72
-
,373.91 3.22%\r\nAluminium 858.66 784.15 802.13 1,198.22 4.56%\r\nStainless
-
Steel 331.96 301.82 307.40 442.85 4.14%\r\nZinc 159.84 144.85 147.04 205.87
-
%\r\nMagnesium 99.08 89.44 90.44 122.27 3.41%\r\nCarbon Steel
-
67.73 67.90 84.51 2.46%\r\nHigh Steel Alloy 139.27 125.46 126.61 168.00
-
%\r\nOthers 166.09 147.31 146.30 165.01 1.35%\r\nTotal 3,792.79
-
,428.83 3,472.54 4,760.65 3.57%\r\nSource: Indiana Cast Metal Association
-
(INCMA), American Foundry Society (AFS), The North American Die Casting Association,
-
NON-FERROUS FOUNDERS’ SOCIETY, Aluminium Casters’ Association of India,
-
Casting Industry Suppliers Association, International Trade Centre, World Trade
-
Centre, Government Websites, Press Releases, Journals, Annual Reports, Whitepapers,
-
Company Websites, and MRFR Analysis\r\nThe cast iron segment dominated the
-
market with a share of 51.57%, accounting for 1,768.09 kilo tons in 2020; it is
-
projected to exhibit a CAGR of 3.22%. The aluminium segment was the second-largest
-
with a share of 22.87% in 2020, sized at 784.15 kilo tons; it is projected to exhibit
-
the highest CAGR of 4.56%.\r\nTABLE 253 REST OF ASIA-PACIFIC: METAL CASTING
-
MARKET, BY PROCESS TYPE, 2022-2030 (USD MILLION)\r\nProcess Type 2019 2020
-
2030 CAGR (2022-2030)\r\nSand Casting 4,316.70 3,943.56 4,050.89 6,331.38
-
%\r\nDie Casting 2,238.76 2,052.73 2,116.25 3,412.24 5.45%\r\nShell
-
Mold Casting 679.54 615.80 627.46 910.88 4.23%\r\nGravity Casting 392.57
-
350.57 426.39 2.20%\r\nVacuum Casting 274.78 245.09 245.70 301.09
-
%\r\nInvestment Casting 579.50 527.07 539.03 809.80 4.63%\r\nOthers
-
503.22 512.12 734.80 4.09%\r\nTotal 9,037.81 8,234.00 8,435.02 12,867.90
-
%\r\nSource: Indiana Cast Metal Association (INCMA), American Foundry
-
Society (AFS), The North American Die Casting Association, NON-FERROUS FOUNDERS’
-
SOCIETY, Aluminium Casters’ Association of India, Casting Industry Suppliers
-
Association, International Trade Centre, World Trade Centre, Government Websites,
-
Press Releases, Journals, Annual Reports, Whitepapers, Company Websites, and MRFR
-
Analysis\r\nThe sand casting segment accounted for the largest market share
-
of 47.89% in 2020, with a market value of USD 3,943.6 million; it is expected to
-
register a CAGR of 5.09% during the forecast period. The die casting segment accounted
-
for the second largest market share in 2020, valued at USD 2,052.7 million; it is
-
projected to register the highest CAGR of 5.45%.\r\n \r\nTABLE
-
REST OF ASIA-PACIFIC: METAL CASTING MARKET, BY PROCESS TYPE, 2022-2030 (KILO
-
TONS)\r\nProcess Type 2019 2020 2021 2030 CAGR (2022-2030)\r\nSand
-
Casting 1,877.78 1,702.39 1,728.95 2,430.28 3.86%\r\nDie Casting 933.71 849.60
-
1,255.77 4.22%\r\nShell Mold Casting 289.38 260.24 262.17 342.28 3.01%\r\nGravity
-
Casting 158.81 140.49 139.15 152.21 1.00%\r\nVacuum Casting 108.98 96.47
-
105.37 1.09%\r\nInvestment Casting 236.81 213.74 216.12 292.00 3.40%\r\nOthers
-
167.28 167.33 203.69 2.21%\r\nTotal 3,792.79 3,428.83 3,472.54 4,760.65
-
%\r\nSource: Indiana Cast Metal Association (INCMA), American Foundry
-
Society (AFS), The North American Die Casting Association, NON-FERROUS FOUNDERS’
-
SOCIETY, Aluminium Casters’ Association of India, Casting Industry Suppliers
-
Association, International Trade Centre, World Trade Centre, Government Websites,
-
Press Releases, Journals, Annual Reports, Whitepapers, Company Websites, and MRFR
-
Analysis\r\nThe sand casting segment dominated the market with a share of
-
%, accounting for 1,702.39 kilo tons in 2020; it is projected to exhibit a
-
CAGR of 3.86%. The die casting segment was the second-largest with a share of 24.78%
-
in 2020, sized at 849.60 kilo tons; it is projected to exhibit the highest CAGR
-
of 4.22%.\r\nTABLE 255 REST OF ASIA-PACIFIC: METAL CASTING MARKET, BY END-USE
-
INDUSTRY, 2022-2030 (USD MILLION)\r\nEnd-use Industry 2019 2020 2021 2030
-
CAGR (2022-2030)\r\nAutomotive & Transportation 3,585.65 3,279.46 3,372.54
-
,323.47 5.20%\r\nBuilding & Construction 1,590.63 1,447.40 1,480.93
-
,234.46 4.68%\r\nMining 1,060.02 960.64 978.87 1,421.59 4.23%\r\nEquipment
-
& Machine 1,294.87 1,180.43 1,210.00 1,856.14 4.87%\r\nConsumer Goods
-
822.97 840.40 1,245.44 4.47%\r\nOthers 600.46 543.09 552.29 786.79
-
%\r\nTotal 9,037.81 8,234.00 8,435.02 12,867.90 4.80%\r\nSource:
-
Indiana Cast Metal Association (INCMA), American Foundry Society (AFS), The North
-
American Die Casting Association, NON-FERROUS FOUNDERS’ SOCIETY, Aluminium
-
Casters’ Association of India, Casting Industry Suppliers Association, International
-
Trade Centre, World Trade Centre, Government Websites, Press Releases, Journals,
-
Annual Reports, Whitepapers, Company Websites, and MRFR Analysis\r\nThe automotive
-
& transportation segment accounted for the largest market share of 39.83% in
-
, with a market value of USD 3,279.5 million; it is expected to register the
-
highest CAGR of 5.20% during the forecast period. The building & construction
-
segment accounted for the second largest market share in 2020, valued at USD 1,447.4
-
million; it is projected to exhibit a CAGR of 4.68%.\r\n \r\nTABLE
-
REST OF ASIA-PACIFIC: METAL CASTING MARKET, BY END-USE INDUSTRY, 2022-2030 (KILO
-
TONS)\r\nEnd-use Industry 2019 2020 2021 2030 CAGR (2022-2030)\r\nAutomotive
-
& Transportation 1,526.94 1,385.90 1,409.12 2,000.38 3.97%\r\nBuilding
-
& Construction 670.31 605.30 612.32 830.89 3.45%\r\nMining 437.59 393.54
-
517.83 3.01%\r\nEquipment & Machine 540.05 488.57 495.14 683.09
-
%\r\nConsumer Goods 370.30 333.74 336.95 449.08 3.24%\r\nOthers
-
221.79 222.54 279.38 2.56%\r\nTotal 3,792.79 3,428.83 3,472.54 4,760.65
-
%\r\nSource: Indiana Cast Metal Association (INCMA), American Foundry
-
Society (AFS), The North American Die Casting Association, NON-FERROUS FOUNDERS’
-
SOCIETY, Aluminium Casters’ Association of India, Casting Industry Suppliers
-
Association, International Trade Centre, World Trade Centre, Government Websites,
-
Press Releases, Journals, Annual Reports, Whitepapers, Company Websites, and MRFR
-
Analysis\r\nThe automotive & transportation segment dominated the market
-
with a share of 40.42%, accounting for 1,385.90 kilo tons in 2020; it is expected
-
to register the highest CAGR of 3.97% from 2021 to 2030. The building & construction
-
segment was the second-largest with a share of 17.65% in 2020, sized at 605.30 kilo
-
tons; it is projected to exhibit a CAGR of 3.45%.\r\nTABLE 257 REST OF ASIA-PACIFIC:
-
METAL CASTING MARKET, BY AUTOMOTIVE & TRANSPORTATION, 2022-2030 (USD MILLION)\r\nAutomotive
-
& Transportation 2019 2020 2021 2030 CAGR (2022-2030)\r\nGearbox 658.25
-
629.38 1,066.28 6.03%\r\nWheels 375.42 345.29 357.07 591.80 5.77%\r\nEngine
-
Blocks 535.71 490.59 505.16 806.59 5.34%\r\nCylinder Head 849.53 772.22 789.23
-
,176.07 4.53%\r\nExhaust Manifold 283.32 258.15 264.48 403.24 4.80%\r\nSeat
-
Frame 309.38 282.64 290.32 453.47 5.08%\r\nOthers 574.04 523.55 536.90 826.03
-
%\r\nTotal 3,585.65 3,279.46 3,372.54 5,323.47 5.20%\r\nSource:
-
Indiana Cast Metal Association (INCMA), American Foundry Society (AFS), The North
-
American Die Casting Association, NON-FERROUS FOUNDERS’ SOCIETY, Aluminium
-
Casters’ Association of India, Casting Industry Suppliers Association, International
-
Trade Centre, World Trade Centre, Government Websites, Press Releases, Journals,
-
Annual Reports, Whitepapers, Company Websites, and MRFR Analysis\r\nThe cylinder
-
head segment accounted for the largest market share of 23.55% in 2020, with a market
-
value of USD 772.2 million; it is expected to register a CAGR of 4.53% during the
-
forecast period. The gearbox segment accounted for the second largest market share
-
in 2020, valued at USD 607.0 million; it is projected to register the highest CAGR
-
of 6.03%.\r\n.\r\nTABLE 258 REST OF ASIA-PACIFIC: METAL CASTING MARKET,
-
BY AUTOMOTIVE & TRANSPORTATION, 2022-2030 (KILO TONS)\r\nAutomotive &
-
Transportation 2019 2020 2021 2030 CAGR (2022-2030)\r\nGearbox 295.07 270.03
-
421.76 4.79%\r\nWheels 163.13 148.90 152.24 226.92 4.53%\r\nEngine
-
Blocks 237.63 215.96 219.86 315.72 4.10%\r\nCylinder Head 372.96 336.43 339.96
-
3.31%\r\nExhaust Manifold 121.87 110.20 111.62 153.05 3.57%\r\nSeat
-
Frame 131.75 119.44 121.30 170.40 3.85%\r\nOthers 204.53 184.94 187.34 256.94
-
%\r\nTotal 1,526.94 1,385.90 1,409.12 2,000.38 3.97%\r\nSource:
-
Indiana Cast Metal Association (INCMA), American Foundry Society (AFS), The North
-
American Die Casting Association, NON-FERROUS FOUNDERS’ SOCIETY, Aluminium
-
Casters’ Association of India, Casting Industry Suppliers Association, International
-
Trade Centre, World Trade Centre, Government Websites, Press Releases, Journals,
-
Annual Reports, Whitepapers, Company Websites, and MRFR Analysis\r\nThe cylinder
-
head segment dominated the market with a share of 24.28%, accounting for 336.43
-
kilo tons in 2020; it is projected to exhibit a CAGR of 3.31%. The Gearbox segment
-
was the second-largest with a share of 19.48% in 2020, sized at 270.03 kilo tons;
-
it is projected to exhibit the highest CAGR of 4.79%.\r\nTABLE 259 REST OF
-
ASIA-PACIFIC: METAL CASTING MARKET, BY EQUIPMENT & MACHINE, 2022-2030\r\n(USD
-
MILLION)\r\nEquipment & Machine 2019 2020 2021 2030 CAGR (2022-2030)\r\nPumps
-
& Valves 732.35 666.45 681.95 1,029.57 4.68%\r\nOthers 562.52 513.98
-
826.57 5.10%\r\nTotal 1,294.87 1,180.43 1,210.00 1,856.14 4.87%\r\nSource:
-
Indiana Cast Metal Association (INCMA), American Foundry Society (AFS), The North
-
American Die Casting Association, NON-FERROUS FOUNDERS’ SOCIETY, Aluminium
-
Casters’ Association of India, Casting Industry Suppliers Association, International
-
Trade Centre, World Trade Centre, Government Websites, Press Releases, Journals,
-
Annual Reports, Whitepapers, Company Websites, and MRFR Analysis\r\nThe pumps
-
& valves segment accounted for a larger market share of 56.46% in 2020, with
-
a market value of USD 666.5 million; it is expected to register a CAGR of 4.68%
-
during the forecast period. The Others segment was valued at USD 514.0 million;
-
it is projected to register a higher CAGR of 5.10%.\r\n \r\nTABLE
-
REST OF ASIA-PACIFIC: METAL CASTING MARKET, BY EQUIPMENT & MACHINE, 2022-2030
-
(KILO TONS)\r\nEquipment & Machine 2019 2020 2021 2030 CAGR (2022-2030)\r\nPumps
-
& Valves 308.52 278.62 281.88 382.73 3.46%\r\nOthers 231.52 209.94 213.26
-
3.88%\r\nTotal 540.05 488.57 495.14 683.09 3.64%\r\nSource:
-
Indiana Cast Metal Association (INCMA), American Foundry Society (AFS), The North
-
American Die Casting Association, NON-FERROUS FOUNDERS’ SOCIETY, Aluminium
-
Casters’ Association of India, Casting Industry Suppliers Association, International
-
Trade Centre, World Trade Centre, Government Websites, Press Releases, Journals,
-
Annual Reports, Whitepapers, Company Websites, and MRFR Analysis\r\nThe pumps
-
& valves segment dominated the market with a share of 57.03%, accounting for
-
kilo tons in 2020; it is projected to exhibit a CAGR of 3.46%. The Others
-
segment accounted for a share of 42.97% in 2020, sized at 209.94 kilo tons; it is
-
projected to exhibit a higher CAGR of 3.88%.\r\n \r\n9.1 LATIN
-
AMERICA\r\nFIGURE 26 LATIN AMERICA: METAL CASTING MARKET SHARE, BY COUNTRY,
-
(% SHARE)\r\nSource: Indiana Cast Metal Association (INCMA), American
-
Foundry Society (AFS), The North American Die Casting Association, NON-FERROUS FOUNDERS’
-
SOCIETY, Aluminium Casters’ Association of India, Casting Industry Suppliers
-
Association, International Trade Centre, World Trade Centre, Government Websites,
-
Press Releases, Journals, Annual Reports, Whitepapers, Company Websites, and MRFR
-
Analysis\r\nTABLE 261 LATIN AMERICA: METAL CASTING MARKET, BY COUNTRY, 2022-2030
-
(USD MILLION)\r\nCountry 2019 2020 2021 2030 CAGR (2022-2030)\r\nBrazil
-
,063.05 4,712.21 4,934.91 9,558.93 7.62%\r\nMexico 7,520.10 7,014.05 7,361.28
-
,532.36 7.85%\r\nArgentina 1,638.72 1,517.81 1,581.84 2,930.21 7.09%\r\nRest
-
of Latin America 1,234.65 1,137.15 1,178.38 2,065.15 6.43%\r\nTotal 15,456.52
-
,381.23 15,056.41 29,086.65 7.59%\r\nSource: Indiana Cast Metal Association
-
(INCMA), American Foundry Society (AFS), The North American Die Casting Association,
-
NON-FERROUS FOUNDERS’ SOCIETY, Aluminium Casters’ Association of India,
-
Casting Industry Suppliers Association, International Trade Centre, World Trade
-
Centre, Government Websites, Press Releases, Journals, Annual Reports, Whitepapers,
-
Company Websites, and MRFR Analysis\r\nMexico accounted for the largest market
-
share of 48.77% in 2020, with a market value of USD 7,014.1 million; the market
-
is expected to register the highest CAGR of 7.85% during the forecast period. Brazil
-
was the second-largest market in 2020, valued at USD 4,712.2 million; the market
-
is projected to exhibit a CAGR of 7.62%.\r\n \r\nTABLE 262 LATIN
-
AMERICA: METAL CASTING MARKET, BY COUNTRY, 2022-2030 (KILO TONS)\r\nCountry
-
2020 2021 2030 CAGR (2022-2030)\r\nBrazil 2,018.49 1,864.09 1,929.90
-
,358.53 6.35%\r\nMexico 3,056.82 2,829.06 2,935.21 5,206.03 6.57%\r\nArgentina
-
637.81 657.13 1,093.63 5.82%\r\nRest of Latin America 497.15 454.35
-
732.94 5.17%\r\nTotal 6,266.44 5,785.32 5,987.70 10,391.13 6.32%\r\nSource:
-
Indiana Cast Metal Association (INCMA), American Foundry Society (AFS), The North
-
American Die Casting Association, NON-FERROUS FOUNDERS’ SOCIETY, Aluminium
-
Casters’ Association of India, Casting Industry Suppliers Association, International
-
Trade Centre, World Trade Centre, Government Websites, Press Releases, Journals,
-
Annual Reports, Whitepapers, Company Websites, and MRFR Analysis\r\nMexico
-
market dominated with a share of 48.90%, accounting for 2,829.06 kilo tons in 2020
-
and is projected to register the highest CAGR of 6.57% from 2021 to 2030. The market
-
in Brazil was the second-largest with a share of 32.22% in 2020, sized at 1,864.09
-
kilo tons; it is projected to exhibit a CAGR of 6.35%.\r\nTABLE 263 LATIN
-
AMERICA: METAL CASTING MARKET, BY MATERIAL TYPE, 2022-2030 (USD MILLION)\r\nMaterial
-
Type 2019 2020 2021 2030 CAGR (2022-2030)\r\nCast Iron 7,727.71 7,164.71
-
,474.51 13,978.06 7.20%\r\nAluminium 3,519.39 3,306.92 3,496.06 7,343.44
-
%\r\nStainless Steel 1,550.98 1,456.70 1,539.36 3,221.54 8.55%\r\nZinc
-
531.16 557.52 1,101.69 7.86%\r\nMagnesium 463.90 431.08 450.75 860.89
-
%\r\nCarbon Steel 230.91 211.90 218.76 368.98 5.98%\r\nHigh Steel
-
Alloy 459.45 425.48 443.36 820.09 7.07%\r\nOthers 934.76 853.27 876.09 1,391.96
-
%\r\nTotal 15,456.52 14,381.23 15,056.41 29,086.65 7.59%\r\nSource:
-
Indiana Cast Metal Association (INCMA), American Foundry Society (AFS), The North
-
American Die Casting Association, NON-FERROUS FOUNDERS’ SOCIETY, Aluminium
-
Casters’ Association of India, Casting Industry Suppliers Association, International
-
Trade Centre, World Trade Centre, Government Websites, Press Releases, Journals,
-
Annual Reports, Whitepapers, Company Websites, and MRFR Analysis\r\nThe cast
-
iron segment accounted for the largest market share of 49.82% in 2020, with a market
-
value of USD 7,164.7 million; it is expected to register a CAGR of 7.20% during
-
the forecast period. The aluminium segment accounted for the second largest market
-
share in 2020, valued at USD 3,306.9 million; it is projected to register the highest
-
CAGR of 8.60%.\r\n \r\nTABLE 264 LATIN AMERICA: METAL CASTING
-
MARKET, BY MATERIAL TYPE, 2022-2030 (KILO TONS)\r\nMaterial Type 2019 2020
-
2030 CAGR (2022-2030)\r\nCast Iron 3,181.12 2,926.84 3,018.83 5,076.61
-
%\r\nAluminium 1,418.08 1,322.30 1,382.11 2,610.66 7.32%\r\nStainless
-
Steel 594.61 554.20 579.01 1,089.61 7.28%\r\nZinc 224.89 208.18 216.04 383.88
-
%\r\nMagnesium 181.92 167.76 173.43 297.88 6.19%\r\nCarbon Steel
-
85.84 87.61 132.84 4.73%\r\nHigh Steel Alloy 186.95 171.81 177.00 294.41
-
%\r\nOthers 384.61 348.39 353.66 505.23 4.04%\r\nTotal 6,266.44
-
,785.32 5,987.70 10,391.13 6.32%\r\nSource: Indiana Cast Metal Association
-
(INCMA), American Foundry Society (AFS), The North American Die Casting Association,
-
NON-FERROUS FOUNDERS’ SOCIETY, Aluminium Casters’ Association of India,
-
Casting Industry Suppliers Association, International Trade Centre, World Trade
-
Centre, Government Websites, Press Releases, Journals, Annual Reports, Whitepapers,
-
Company Websites, and MRFR Analysis\r\nThe cast iron segment dominated the
-
market with a share of 50.59%, accounting for 2,926.84 kilo tons in 2020; it is
-
projected to exhibit a CAGR of 5.95%. The aluminium segment was the second-largest
-
with a share of 22.86% in 2020, sized at 1,322.30 kilo tons; it is projected to
-
exhibit the highest CAGR of 7.32%.\r\nTABLE 265 LATIN AMERICA: METAL CASTING
-
MARKET, BY PROCESS TYPE, 2022-2030 (USD MILLION)\r\nProcess Type 2019 2020
-
2030 CAGR (2022-2030)\r\nSand Casting 7,593.13 7,083.36 7,435.26 14,699.60
-
%\r\nDie Casting 3,632.58 3,402.24 3,585.39 7,333.33 8.28%\r\nShell
-
Mold Casting 1,211.14 1,121.16 1,167.81 2,152.00 7.03%\r\nGravity Casting
-
861.43 881.98 1,357.88 4.91%\r\nVacuum Casting 594.76 544.32 560.39
-
5.64%\r\nInvestment Casting 880.82 817.97 854.73 1,622.58 7.38%\r\nOthers
-
550.74 570.86 1,003.40 6.47%\r\nTotal 15,456.52 14,381.23 15,056.41
-
,086.65 7.59%\r\nSource: Indiana Cast Metal Association (INCMA), American
-
Foundry Society (AFS), The North American Die Casting Association, NON-FERROUS FOUNDERS’
-
SOCIETY, Aluminium Casters’ Association of India, Casting Industry Suppliers
-
Association, International Trade Centre, World Trade Centre, Government Websites,
-
Press Releases, Journals, Annual Reports, Whitepapers, Company Websites, and MRFR
-
Analysis\r\nThe sand casting segment accounted for the largest market share
-
of 49.25% in 2020, with a market value of USD 7,083.4 million; it is expected to
-
register a CAGR of 7.87% during the forecast period. The die casting segment accounted
-
for the second largest market share in 2020, valued at USD 3,402.2 million; it is
-
projected to register the highest CAGR of 8.28%.\r\n \r\nTABLE
-
LATIN AMERICA: METAL CASTING MARKET, BY PROCESS TYPE, 2022-2030 (KILO TONS)\r\nProcess
-
Type 2019 2020 2021 2030 CAGR (2022-2030)\r\nSand Casting 3,191.88 2,954.86
-
,066.55 5,451.70 6.60%\r\nDie Casting 1,464.04 1,360.73 1,417.75 2,607.55
-
%\r\nShell Mold Casting 498.56 458.00 471.65 781.58 5.77%\r\nGravity
-
Casting 370.52 334.74 338.86 469.30 3.68%\r\nVacuum Casting 227.89 206.97
-
310.27 4.40%\r\nInvestment Casting 347.31 320.06 330.66 564.47 6.12%\r\nOthers
-
149.96 151.57 206.27 3.48%\r\nTotal 6,266.44 5,785.32 5,987.70 10,391.13
-
%\r\nSource: Indiana Cast Metal Association (INCMA), American Foundry
-
Society (AFS), The North American Die Casting Association, NON-FERROUS FOUNDERS’
-
SOCIETY, Aluminium Casters’ Association of India, Casting Industry Suppliers
-
Association, International Trade Centre, World Trade Centre, Government Websites,
-
Press Releases, Journals, Annual Reports, Whitepapers, Company Websites, and MRFR
-
Analysis\r\nThe sand casting segment dominated the market with a share of
-
%, accounting for 2,954.86 kilo tons in 2020; it is projected to exhibit a
-
CAGR of 6.60%. The die casting segment was the second-largest with a share of 23.52%
-
in 2020, sized at 1,360.73 kilo tons; it is projected to exhibit the highest CAGR
-
of 7.00%.\r\nTABLE 267 LATIN AMERICA: METAL CASTING MARKET, BY END-USE INDUSTRY,
-
2030 (USD MILLION)\r\nEnd-use Industry 2019 2020 2021 2030 CAGR (2022-2030)\r\nAutomotive
-
& Transportation 6,210.67 5,800.14 6,095.00 12,166.14 7.98%\r\nBuilding
-
& Construction 2,768.33 2,572.80 2,690.52 5,144.28 7.47%\r\nMining 1,671.69
-
,546.52 1,609.84 2,948.62 6.96%\r\nEquipment & Machine 2,367.96 2,204.64
-
,309.63 4,487.54 7.66%\r\nConsumer Goods 1,615.67 1,498.53 1,563.92 2,935.13
-
%\r\nOthers 822.20 758.60 787.51 1,404.95 6.64%\r\nTotal 15,456.52
-
,381.23 15,056.41 29,086.65 7.59%\r\nSource: Indiana Cast Metal Association
-
(INCMA), American Foundry Society (AFS), The North American Die Casting Association,
-
NON-FERROUS FOUNDERS’ SOCIETY, Aluminium Casters’ Association of India,
-
Casting Industry Suppliers Association, International Trade Centre, World Trade
-
Centre, Government Websites, Press Releases, Journals, Annual Reports, Whitepapers,
-
Company Websites, and MRFR Analysis\r\nThe automotive & transportation
-
segment accounted for the largest market share of 40.33% in 2020, with a market
-
value of USD 5,800.1 million; it is expected to register the highest CAGR of 7.98%
-
during the forecast period. The building & construction segment accounted for
-
the second largest market share in 2020, valued at USD 2,572.8 million; it is projected
-
to exhibit a CAGR of 7.47%.\r\n \r\nTABLE 268 LATIN AMERICA:
-
METAL CASTING MARKET, BY END-USE INDUSTRY, 2022-2030 (KILO TONS)\r\nEnd-use
-
Industry 2019 2020 2021 2030 CAGR (2022-2030)\r\nAutomotive & Transportation
-
,555.49 2,368.35 2,460.58 4,416.65 6.72%\r\nBuilding & Construction
-
,127.64 1,039.99 1,075.26 1,848.75 6.21%\r\nMining 667.13 612.46 630.32
-
,038.17 5.70%\r\nEquipment & Machine 954.52 881.90 913.44 1,595.93 6.40%\r\nConsumer
-
Goods 637.83 587.07 605.75 1,022.28 5.99%\r\nOthers 323.83 295.54 302.34
-
5.01%\r\nTotal 6,266.44 5,785.32 5,987.70 10,391.13 6.32%\r\nSource:
-
Indiana Cast Metal Association (INCMA), American Foundry Society (AFS), The North
-
American Die Casting Association, NON-FERROUS FOUNDERS’ SOCIETY, Aluminium
-
Casters’ Association of India, Casting Industry Suppliers Association, International
-
Trade Centre, World Trade Centre, Government Websites, Press Releases, Journals,
-
Annual Reports, Whitepapers, Company Websites, and MRFR Analysis\r\nThe automotive
-
& transportation segment dominated the market with a share of 40.94%, accounting
-
for 2,368.35 kilo tons in 2020; it is expected to register the highest CAGR of 6.72%
-
from 2021 to 2030. The building & construction segment was the second-largest
-
with a share of 17.98% in 2020, sized at 1,039.99 kilo tons; it is projected to
-
exhibit a CAGR of 6.21%.\r\nTABLE 269 LATIN AMERICA: METAL CASTING MARKET,
-
BY AUTOMOTIVE & TRANSPORTATION, 2022-2030\r\n(USD MILLION)\r\nAutomotive
-
& Transportation 2019 2020 2021 2030 CAGR (2022-2030)\r\nGearbox 1,226.18
-
,153.89 1,221.76 2,604.17 8.77%\r\nWheels 670.06 629.18 664.74 1,391.16
-
%\r\nEngine Blocks 862.66 806.81 849.06 1,716.90 8.14%\r\nCylinder
-
Head 1,483.49 1,377.02 1,438.17 2,711.78 7.30%\r\nExhaust Manifold 369.89
-
359.26 683.55 7.41%\r\nSeat Frame 499.14 465.58 488.65 964.70 7.85%\r\nOthers
-
,099.25 1,024.01 1,073.36 2,093.87 7.71%\r\nTotal 6,210.67 5,800.14 6,095.00
-
,166.14 7.98%\r\nSource: Indiana Cast Metal Association (INCMA), American
-
Foundry Society (AFS), The North American Die Casting Association, NON-FERROUS FOUNDERS’
-
SOCIETY, Aluminium Casters’ Association of India, Casting Industry Suppliers
-
Association, International Trade Centre, World Trade Centre, Government Websites,
-
Press Releases, Journals, Annual Reports, Whitepapers, Company Websites, and MRFR
-
Analysis\r\nThe cylinder head segment accounted for the largest market share
-
of 23.74% in 2020, with a market value of USD 1,377.0 million; it is expected to
-
register a CAGR of 7.30% during the forecast period. The gearbox segment accounted
-
for the second largest market share in 2020, valued at USD 1,153.9 million; it is
-
projected to register the highest CAGR of 8.77%.\r\nTABLE 270 LATIN AMERICA:
-
METAL CASTING MARKET, BY AUTOMOTIVE & TRANSPORTATION, 2022-2030\r\n(KILO
-
TONS)\r\nAutomotive & Transportation 2019 2020 2021 2030 CAGR (2022-2030)\r\nGearbox
-
495.81 519.03 994.87 7.50%\r\nWheels 281.11 261.94 273.62 514.95 7.28%\r\nEngine
-
Blocks 370.02 343.42 357.31 649.71 6.87%\r\nCylinder Head 629.13 579.52 598.40
-
,014.63 6.04%\r\nExhaust Manifold 153.87 141.87 146.63 250.89 6.15%\r\nSeat
-
Frame 205.33 190.06 197.22 350.13 6.59%\r\nOthers 385.10 355.73 368.36 641.47
-
%\r\nTotal 2,555.49 2,368.35 2,460.58 4,416.65 6.72%\r\nSource:
-
Indiana Cast Metal Association (INCMA), American Foundry Society (AFS), The North
-
American Die Casting Association, NON-FERROUS FOUNDERS’ SOCIETY, Aluminium
-
Casters’ Association of India, Casting Industry Suppliers Association, International
-
Trade Centre, World Trade Centre, Government Websites, Press Releases, Journals,
-
Annual Reports, Whitepapers, Company Websites, and MRFR Analysis\r\nThe cylinder
-
head segment dominated the market with a share of 24.47%, accounting for 579.52
-
kilo tons in 2020; it is projected to exhibit a CAGR of 6.04%. The Gearbox segment
-
was the second-largest with a share of 20.93% in 2020, sized at 495.81 kilo tons;
-
it is projected to exhibit the highest CAGR of 7.50%.\r\nTABLE 271 LATIN
-
AMERICA: METAL CASTING MARKET, BY EQUIPMENT & MACHINE, 2022-2030 (USD MILLION)\r\nEquipment
-
& Machine 2019 2020 2021 2030 CAGR (2022-2030)\r\nPumps & Valves
-
,340.87 1,246.19 1,303.23 2,491.84 7.47%\r\nOthers 1,027.09 958.45 1,006.40
-
,995.70 7.90%\r\nTotal 2,367.96 2,204.64 2,309.63 4,487.54 7.66%\r\nSource:
-
Indiana Cast Metal Association (INCMA), American Foundry Society (AFS), The North
-
American Die Casting Association, NON-FERROUS FOUNDERS’ SOCIETY, Aluminium
-
Casters’ Association of India, Casting Industry Suppliers Association, International
-
Trade Centre, World Trade Centre, Government Websites, Press Releases, Journals,
-
Annual Reports, Whitepapers, Company Websites, and MRFR Analysis\r\nThe pumps
-
& valves segment accounted for a larger market share of 56.53% in 2020, with
-
a market value of USD 1,246.2 million; it is expected to register a CAGR of 7.47%
-
during the forecast period. The Others segment was valued at USD 958.5 million;
-
it is projected to register a higher CAGR of 7.90%.\r\n \r\nTABLE
-
LATIN AMERICA: METAL CASTING MARKET, BY EQUIPMENT & MACHINE, 2022-2030 (KILO
-
TONS)\r\nEquipment & Machine 2019 2020 2021 2030 CAGR (2022-2030)\r\nPumps
-
& Valves 545.91 503.48 520.57 895.05 6.21%\r\nOthers 408.62 378.42 392.87
-
6.64%\r\nTotal 954.52 881.90 913.44 1,595.93 6.40%\r\nSource:
-
Indiana Cast Metal Association (INCMA), American Foundry Society (AFS), The North
-
American Die Casting Association, NON-FERROUS FOUNDERS’ SOCIETY, Aluminium
-
Casters’ Association of India, Casting Industry Suppliers Association, International
-
Trade Centre, World Trade Centre, Government Websites, Press Releases, Journals,
-
Annual Reports, Whitepapers, Company Websites, and MRFR Analysis\r\nThe pumps
-
& valves segment dominated the market with a share of 57.09%, accounting for
-
kilo tons in 2020; it is projected to exhibit a CAGR of 6.21%. The Others
-
segment accounted for a share of 42.91% in 2020, sized at 378.42 kilo tons; it is
-
projected to exhibit a higher CAGR of 6.64%.\r\n9.1.1 BRAZIL\r\nTABLE
-
BRAZIL: METAL CASTING MARKET, BY MATERIAL TYPE, 2022-2030 (USD MILLION)\r\nMaterial
-
Type 2019 2020 2021 2030 CAGR (2022-2030)\r\nCast Iron 2,500.46 2,319.05
-
,420.11 4,539.08 7.24%\r\nAluminium 1,179.83 1,108.85 1,172.54 2,467.70
-
%\r\nStainless Steel 510.24 479.32 506.61 1,062.11 8.57%\r\nZinc
-
165.55 173.86 345.24 7.92%\r\nMagnesium 138.65 128.83 134.70 257.10
-
%\r\nCarbon Steel 88.52 81.45 84.31 146.12 6.30%\r\nHigh Steel
-
Alloy 152.38 141.20 147.22 273.75 7.14%\r\nOthers 315.59 287.98 295.57 467.82
-
%\r\nTotal 5,063.05 4,712.21 4,934.91 9,558.93 7.62%\r\nSource:
-
Indiana Cast Metal Association (INCMA), American Foundry Society (AFS), The North
-
American Die Casting Association, NON-FERROUS FOUNDERS’ SOCIETY, Aluminium
-
Casters’ Association of India, Casting Industry Suppliers Association, International
-
Trade Centre, World Trade Centre, Government Websites, Press Releases, Journals,
-
Annual Reports, Whitepapers, Company Websites, and MRFR Analysis\r\nThe cast
-
iron segment accounted for the largest market share of 49.21% in 2020, with a market
-
value of USD 2,319.0 million; it is expected to register a CAGR of 7.24% during
-
the forecast period. The aluminium segment accounted for the second largest market
-
share in 2020, valued at USD 1,108.9 million; it is projected to register the highest
-
CAGR of 8.62%.\r\n \r\nTABLE 274 BRAZIL: METAL CASTING MARKET,
-
BY MATERIAL TYPE, 2022-2030 (KILO TONS)\r\nMaterial Type 2019 2020 2021 2030
-
CAGR (2022-2030)\r\nCast Iron 1,011.84 931.28 960.87 1,620.78 5.98%\r\nAluminium
-
436.11 455.94 862.98 7.35%\r\nStainless Steel 192.31 179.27 187.34
-
7.30%\r\nZinc 68.88 63.79 66.24 118.30 6.66%\r\nMagnesium 53.51
-
51.01 87.56 6.19%\r\nCarbon Steel 35.63 32.54 33.30 51.90 5.06%\r\nHigh
-
Steel Alloy 61.02 56.11 57.84 96.73 5.88%\r\nOthers 127.71 115.64 117.35
-
4.00%\r\nTotal 2,018.49 1,864.09 1,929.90 3,358.53 6.35%\r\nSource:
-
Indiana Cast Metal Association (INCMA), American Foundry Society (AFS), The North
-
American Die Casting Association, NON-FERROUS FOUNDERS’ SOCIETY, Aluminium
-
Casters’ Association of India, Casting Industry Suppliers Association, International
-
Trade Centre, World Trade Centre, Government Websites, Press Releases, Journals,
-
Annual Reports, Whitepapers, Company Websites, and MRFR Analysis\r\nThe cast
-
iron segment dominated the market with a share of 49.96%, accounting for 931.28
-
kilo tons in 2020; it is projected to exhibit a CAGR of 5.98%. The aluminium segment
-
was the second-largest with a share of 23.40% in 2020, sized at 436.11 kilo tons;
-
it is projected to exhibit the highest CAGR of 7.35%.\r\nTABLE 275 BRAZIL:
-
METAL CASTING MARKET, BY PROCESS TYPE, 2022-2030 (USD MILLION)\r\nProcess
-
Type 2019 2020 2021 2030 CAGR (2022-2030)\r\nSand Casting 2,481.84 2,315.97
-
,431.81 4,821.66 7.90%\r\nDie Casting 1,240.26 1,161.77 1,224.48 2,507.70
-
%\r\nShell Mold Casting 375.52 347.61 362.05 666.71 7.02%\r\nGravity
-
Casting 255.78 231.68 235.95 340.73 4.17%\r\nVacuum Casting 193.49 177.07
-
298.20 5.62%\r\nInvestment Casting 307.36 285.54 298.50 568.78 7.43%\r\nOthers
-
192.58 199.84 355.15 6.60%\r\nTotal 5,063.05 4,712.21 4,934.91 9,558.93
-
%\r\nSource: Indiana Cast Metal Association (INCMA), American Foundry
-
Society (AFS), The North American Die Casting Association, NON-FERROUS FOUNDERS’
-
SOCIETY, Aluminium Casters’ Association of India, Casting Industry Suppliers
-
Association, International Trade Centre, World Trade Centre, Government Websites,
-
Press Releases, Journals, Annual Reports, Whitepapers, Company Websites, and MRFR
-
Analysis\r\nThe sand casting segment accounted for the largest market share
-
of 49.15% in 2020, with a market value of USD 2,316.0 million; it is expected to
-
register a CAGR of 7.90% during the forecast period. The die casting segment accounted
-
for the second largest market share in 2020, valued at USD 1,161.8 million; it is
-
projected to register the highest CAGR of 8.29%.\r\n \r\nTABLE
-
BRAZIL: METAL CASTING MARKET, BY PROCESS TYPE, 2022-2030 (KILO TONS)\r\nProcess
-
Type 2019 2020 2021 2030 CAGR (2022-2030)\r\nSand Casting 1,025.91 950.04
-
1,758.71 6.64%\r\nDie Casting 491.54 456.92 476.14 876.97 7.02%\r\nShell
-
Mold Casting 151.96 139.59 143.75 238.07 5.77%\r\nGravity Casting 98.33 88.38
-
115.58 2.95%\r\nVacuum Casting 72.93 66.23 67.41 99.17 4.38%\r\nInvestment
-
Casting 119.35 110.04 113.73 194.89 6.17%\r\nOthers 58.48 52.89 53.60 75.14
-
%\r\nTotal 2,018.49 1,864.09 1,929.90 3,358.53 6.35%\r\nSource:
-
Indiana Cast Metal Association (INCMA), American Foundry Society (AFS), The North
-
American Die Casting Association, NON-FERROUS FOUNDERS’ SOCIETY, Aluminium
-
Casters’ Association of India, Casting Industry Suppliers Association, International
-
Trade Centre, World Trade Centre, Government Websites, Press Releases, Journals,
-
Annual Reports, Whitepapers, Company Websites, and MRFR Analysis\r\nThe sand
-
casting segment dominated the market with a share of 50.97%, accounting for 950.04
-
kilo tons in 2020; it is projected to exhibit a CAGR of 6.64%. The die casting segment
-
was the second-largest with a share of 24.51% in 2020, sized at 456.92 kilo tons;
-
it is projected to exhibit the highest CAGR of 7.02%.\r\nTABLE 277 BRAZIL:
-
METAL CASTING MARKET, BY END-USE INDUSTRY, 2022-2030 (USD MILLION)\r\nEnd-use
-
Industry 2019 2020 2021 2030 CAGR (2022-2030)\r\nAutomotive & Transportation
-
,038.70 1,904.64 2,002.21 4,009.78 8.02%\r\nBuilding & Construction
-
802.59 839.44 1,607.23 7.48%\r\nMining 549.22 508.23 529.18 971.59
-
%\r\nEquipment & Machine 770.58 717.57 751.90 1,463.59 7.68%\r\nConsumer
-
Goods 570.88 529.81 553.26 1,044.12 7.31%\r\nOthers 270.24 249.38 258.93
-
6.66%\r\nTotal 5,063.05 4,712.21 4,934.91 9,558.93 7.62%\r\nSource:
-
Indiana Cast Metal Association (INCMA), American Foundry Society (AFS), The North
-
American Die Casting Association, NON-FERROUS FOUNDERS’ SOCIETY, Aluminium
-
Casters’ Association of India, Casting Industry Suppliers Association, International
-
Trade Centre, World Trade Centre, Government Websites, Press Releases, Journals,
-
Annual Reports, Whitepapers, Company Websites, and MRFR Analysis\r\nThe automotive
-
& transportation segment accounted for the largest market share of 40.42% in
-
, with a market value of USD 1,904.6 million; it is expected to register the
-
highest CAGR of 8.02% during the forecast period. The building & construction
-
segment accounted for the second largest market share in 2020, valued at USD 802.6
-
million; it is projected to exhibit a CAGR of 7.48%.\r\n \r\nTABLE
-
BRAZIL: METAL CASTING MARKET, BY END-USE INDUSTRY, 2022-2030 (KILO TONS)\r\nEnd-use
-
Industry 2019 2020 2021 2030 CAGR (2022-2030)\r\nAutomotive & Transportation
-
764.86 794.95 1,431.79 6.76%\r\nBuilding & Construction 345.76
-
329.82 567.92 6.22%\r\nMining 215.44 197.85 203.67 336.31 5.73%\r\nEquipment
-
& Machine 305.39 282.22 292.38 511.83 6.42%\r\nConsumer Goods 221.68
-
210.79 357.76 6.05%\r\nOthers 105.23 96.06 98.29 152.92 5.03%\r\nTotal
-
,018.49 1,864.09 1,929.90 3,358.53 6.35%\r\nSource: Indiana Cast Metal Association
-
(INCMA), American Foundry Society (AFS), The North American Die Casting Association,
-
NON-FERROUS FOUNDERS’ SOCIETY, Aluminium Casters’ Association of India,
-
Casting Industry Suppliers Association, International Trade Centre, World Trade
-
Centre, Government Websites, Press Releases, Journals, Annual Reports, Whitepapers,
-
Company Websites, and MRFR Analysis\r\nThe automotive & transportation
-
segment dominated the market with a share of 41.03%, accounting for 764.86 kilo
-
tons in 2020; it is expected to register the highest CAGR of 6.76% from 2021 to
-
The building & construction segment was the second-largest with a share
-
of 17.11% in 2020, sized at 318.94 kilo tons; it is projected to exhibit a CAGR
-
of 6.22%.\r\nTABLE 279 BRAZIL: METAL CASTING MARKET, BY AUTOMOTIVE &
-
TRANSPORTATION, 2022-2030 (USD MILLION)\r\nAutomotive & Transportation
-
2020 2021 2030 CAGR (2022-2030)\r\nGearbox 416.88 392.36 415.50 886.97
-
%\r\nWheels 243.53 228.64 241.53 504.92 8.54%\r\nEngine Blocks
-
246.05 259.04 525.70 8.18%\r\nCylinder Head 500.28 464.62 485.50 919.80
-
%\r\nExhaust Manifold 109.63 101.85 106.48 202.52 7.40%\r\nSeat
-
Frame 160.90 150.13 157.62 312.06 7.88%\r\nOthers 344.50 320.99 336.54 657.81
-
%\r\nTotal 2,038.70 1,904.64 2,002.21 4,009.78 8.02%\r\nSource:
-
Indiana Cast Metal Association (INCMA), American Foundry Society (AFS), The North
-
American Die Casting Association, NON-FERROUS FOUNDERS’ SOCIETY, Aluminium
-
Casters’ Association of India, Casting Industry Suppliers Association, International
-
Trade Centre, World Trade Centre, Government Websites, Press Releases, Journals,
-
Annual Reports, Whitepapers, Company Websites, and MRFR Analysis\r\nThe cylinder
-
head segment accounted for the largest market share of 24.39% in 2020, with a market
-
value of USD 464.6 million; it is expected to register a CAGR of 7.36% during the
-
forecast period. The gearbox segment accounted for the second largest market share
-
in 2020, valued at USD 392.4 million; it is projected to register the highest CAGR
-
of 8.79%.\r\n \r\nTABLE 280 BRAZIL: METAL CASTING MARKET, BY
-
AUTOMOTIVE & TRANSPORTATION, 2022-2030 (KILO TONS)\r\nAutomotive &
-
Transportation 2019 2020 2021 2030 CAGR (2022-2030)\r\nGearbox 177.57 165.86
-
333.38 7.52%\r\nWheels 100.56 93.69 97.85 183.97 7.27%\r\nEngine
-
Blocks 110.85 102.93 107.13 195.54 6.91%\r\nCylinder Head 208.71 192.35 198.73
-
6.10%\r\nExhaust Manifold 44.81 41.32 42.70 73.05 6.15%\r\nSeat
-
Frame 65.11 60.29 62.58 111.43 6.62%\r\nOthers 117.37 108.44 112.31 195.83
-
%\r\nTotal 824.98 764.86 794.95 1,431.79 6.76%\r\nSource: Indiana
-
Cast Metal Association (INCMA), American Foundry Society (AFS), The North American
-
Die Casting Association, NON-FERROUS FOUNDERS’ SOCIETY, Aluminium Casters’
-
Association of India, Casting Industry Suppliers Association, International Trade
-
Centre, World Trade Centre, Government Websites, Press Releases, Journals, Annual
-
Reports, Whitepapers, Company Websites, and MRFR Analysis\r\nThe cylinder
-
head segment dominated the market with a share of 25.15%, accounting for 192.35
-
kilo tons in 2020; it is projected to exhibit a CAGR of 6.10%. The Gearbox segment
-
was the second-largest with a share of 21.68% in 2020, sized at 165.86 kilo tons;
-
it is projected to exhibit the highest CAGR of 7.52%.\r\nTABLE 281 BRAZIL:
-
METAL CASTING MARKET, BY EQUIPMENT & MACHINE, 2022-2030 (USD MILLION)\r\nEquipment
-
& Machine 2019 2020 2021 2030 CAGR (2022-2030)\r\nPumps & Valves
-
413.05 432.06 827.99 7.49%\r\nOthers 326.25 304.52 319.83 635.61 7.93%\r\nTotal
-
717.57 751.90 1,463.59 7.68%\r\nSource: Indiana Cast Metal Association
-
(INCMA), American Foundry Society (AFS), The North American Die Casting Association,
-
NON-FERROUS FOUNDERS’ SOCIETY, Aluminium Casters’ Association of India,
-
Casting Industry Suppliers Association, International Trade Centre, World Trade
-
Centre, Government Websites, Press Releases, Journals, Annual Reports, Whitepapers,
-
Company Websites, and MRFR Analysis\r\nThe pumps & valves segment accounted
-
for a larger market share of 57.56% in 2020, with a market value of USD 413.1 million;
-
it is expected to register a CAGR of 7.49% during the forecast period. The Others
-
segment was valued at USD 304.5 million; it is projected to register a higher CAGR
-
of 7.93%.\r\n \r\nTABLE 282 BRAZIL: METAL CASTING MARKET, BY
-
EQUIPMENT & MACHINE, 2022-2030 (KILO TONS)\r\nEquipment & Machine
-
2020 2021 2030 CAGR (2022-2030)\r\nPumps & Valves 177.87 164.09
-
292.48 6.23%\r\nOthers 127.52 118.13 122.67 219.35 6.67%\r\nTotal
-
282.22 292.38 511.83 6.42%\r\nSource: Indiana Cast Metal Association
-
(INCMA), American Foundry Society (AFS), The North American Die Casting Association,
-
NON-FERROUS FOUNDERS’ SOCIETY, Aluminium Casters’ Association of India,
-
Casting Industry Suppliers Association, International Trade Centre, World Trade
-
Centre, Government Websites, Press Releases, Journals, Annual Reports, Whitepapers,
-
Company Websites, and MRFR Analysis\r\nThe pumps & valves segment dominated
-
the market with a share of 58.14%, accounting for 164.09 kilo tons in 2020; it is
-
projected to exhibit a CAGR of 6.23%. The Others segment accounted for a share of
-
% in 2020, sized at 118.13 kilo tons; it is projected to exhibit a higher CAGR
-
of 6.67%.\r\n9.1.2 MEXICO\r\nTABLE 283 MEXICO: METAL CASTING MARKET,
-
BY MATERIAL TYPE, 2022-2030 (USD MILLION)\r\nMaterial Type 2019 2020 2021
-
CAGR (2022-2030)\r\nCast Iron 3,722.46 3,459.82 3,618.37 6,917.26 7.47%\r\nAluminium
-
,698.09 1,599.86 1,695.90 3,646.75 8.88%\r\nStainless Steel 758.59 714.14
-
1,616.11 8.80%\r\nZinc 279.87 261.73 275.41 556.56 8.13%\r\nMagnesium
-
234.98 246.28 480.31 7.70%\r\nCarbon Steel 98.37 90.35 93.35 158.23
-
%\r\nHigh Steel Alloy 216.42 200.93 209.90 397.06 7.34%\r\nOthers
-
452.24 465.66 760.08 5.60%\r\nTotal 7,520.10 7,014.05 7,361.28 14,532.36
-
%\r\nSource: Indiana Cast Metal Association (INCMA), American Foundry
-
Society (AFS), The North American Die Casting Association, NON-FERROUS FOUNDERS’
-
SOCIETY, Aluminium Casters’ Association of India, Casting Industry Suppliers
-
Association, International Trade Centre, World Trade Centre, Government Websites,
-
Press Releases, Journals, Annual Reports, Whitepapers, Company Websites, and MRFR
-
Analysis\r\nThe cast iron segment accounted for the largest market share
-
of 49.33% in 2020, with a market value of USD 3,459.8 million; it is expected to
-
register a CAGR of 7.47% during the forecast period. The aluminium segment accounted
-
for the second largest market share in 2020, valued at USD 1,599.9 million; it is
-
projected to register the highest CAGR of 8.88%.\r\n \r\nTABLE
-
MEXICO: METAL CASTING MARKET, BY MATERIAL TYPE, 2022-2030 (KILO TONS)\r\nMaterial
-
Type 2019 2020 2021 2030 CAGR (2022-2030)\r\nCast Iron 1,536.17 1,416.90
-
,465.08 2,518.88 6.21%\r\nAluminium 686.31 641.68 672.51 1,300.56 7.60%\r\nStainless
-
Steel 291.57 272.39 285.25 548.11 7.53%\r\nZinc 110.83 102.85 107.01 194.48
-
%\r\nMagnesium 99.30 91.79 95.11 166.83 6.44%\r\nCarbon Steel
-
36.81 37.60 57.32 4.80%\r\nHigh Steel Alloy 88.38 81.43 84.10 143.08
-
%\r\nOthers 203.88 185.21 188.54 276.78 4.36%\r\nTotal 3,056.82
-
,829.06 2,935.21 5,206.03 6.57%\r\nSource: Indiana Cast Metal Association
-
(INCMA), American Foundry Society (AFS), The North American Die Casting Association,
-
NON-FERROUS FOUNDERS’ SOCIETY, Aluminium Casters’ Association of India,
-
Casting Industry Suppliers Association, International Trade Centre, World Trade
-
Centre, Government Websites, Press Releases, Journals, Annual Reports, Whitepapers,
-
Company Websites, and MRFR Analysis\r\nThe cast iron segment dominated the
-
market with a share of 50.08%, accounting for 1,416.90 kilo tons in 2020; it is
-
projected to exhibit a CAGR of 6.21%. The aluminium segment was the second-largest
-
with a share of 22.68% in 2020, sized at 641.68 kilo tons; it is projected to exhibit
-
the highest CAGR of 7.60%.\r\nTABLE 285 MEXICO: METAL CASTING MARKET, BY
-
PROCESS TYPE, 2022-2030 (USD MILLION)\r\nProcess Type 2019 2020 2021 2030
-
CAGR (2022-2030)\r\nSand Casting 3,688.86 3,449.70 3,630.00 7,335.29 8.13%\r\nDie
-
Casting 1,692.54 1,589.75 1,680.10 3,523.63 8.58%\r\nShell Mold Casting 613.87
-
594.97 1,121.90 7.30%\r\nGravity Casting 523.42 478.69 492.41 795.04
-
%\r\nVacuum Casting 304.39 279.43 288.56 486.19 5.97%\r\nInvestment
-
Casting 422.02 392.85 411.50 798.14 7.64%\r\nOthers 275.01 253.90 263.74
-
6.68%\r\nTotal 7,520.10 7,014.05 7,361.28 14,532.36 7.85%\r\nSource:
-
Indiana Cast Metal Association (INCMA), American Foundry Society (AFS), The North
-
American Die Casting Association, NON-FERROUS FOUNDERS’ SOCIETY, Aluminium
-
Casters’ Association of India, Casting Industry Suppliers Association, International
-
Trade Centre, World Trade Centre, Government Websites, Press Releases, Journals,
-
Annual Reports, Whitepapers, Company Websites, and MRFR Analysis\r\nThe sand
-
casting segment accounted for the largest market share of 49.18% in 2020, with a
-
market value of USD 3,449.7 million; it is expected to register a CAGR of 8.13%
-
during the forecast period. The die casting segment accounted for the second largest
-
market share in 2020, valued at USD 1,589.7 million; it is projected to register
-
the highest CAGR of 8.58%.\r\nTABLE 286 MEXICO: METAL CASTING MARKET, BY
-
PROCESS TYPE, 2022-2030 (KILO TONS)\r\nProcess Type 2019 2020 2021 2030 CAGR
-
(2022-2030)\r\nSand Casting 1,555.04 1,443.14 1,501.40 2,728.54 6.86%\r\nDie
-
Casting 684.07 637.63 666.25 1,256.65 7.31%\r\nShell Mold Casting 253.33
-
240.90 408.53 6.04%\r\nGravity Casting 205.20 186.24 189.41 275.03
-
%\r\nVacuum Casting 117.00 106.58 108.82 164.89 4.73%\r\nInvestment
-
Casting 167.12 154.39 159.88 278.89 6.38%\r\nOthers 75.06 67.77 68.55 93.48
-
%\r\nTotal 3,056.82 2,829.06 2,935.21 5,206.03 6.57%\r\nSource:
-
Indiana Cast Metal Association (INCMA), American Foundry Society (AFS), The North
-
American Die Casting Association, NON-FERROUS FOUNDERS’ SOCIETY, Aluminium
-
Casters’ Association of India, Casting Industry Suppliers Association, International
-
Trade Centre, World Trade Centre, Government Websites, Press Releases, Journals,
-
Annual Reports, Whitepapers, Company Websites, and MRFR Analysis\r\nThe sand
-
casting segment dominated the market with a share of 51.01%, accounting for 1,443.14
-
kilo tons in 2020; it is projected to exhibit a CAGR of 6.86%. The die casting segment
-
was the second-largest with a share of 22.54% in 2020, sized at 637.63 kilo tons;
-
it is projected to exhibit the highest CAGR of 7.31%.\r\nTABLE 287 MEXICO:
-
METAL CASTING MARKET, BY END-USE INDUSTRY, 2022-2030 (USD MILLION)\r\nEnd-use
-
Industry 2019 2020 2021 2030 CAGR (2022-2030)\r\nAutomotive & Transportation
-
,981.73 2,791.82 2,941.29 6,006.56 8.26%\r\nBuilding & Construction
-
,404.54 1,308.48 1,371.63 2,679.07 7.72%\r\nMining 812.48 753.44 786.16
-
,470.80 7.21%\r\nEquipment & Machine 1,174.38 1,095.93 1,150.79 2,282.69
-
%\r\nConsumer Goods 736.18 684.40 715.94 1,371.71 7.49%\r\nOthers
-
379.99 395.46 721.52 6.91%\r\nTotal 7,520.10 7,014.05 7,361.28 14,532.36
-
%\r\nSource: Indiana Cast Metal Association (INCMA), American Foundry
-
Society (AFS), The North American Die Casting Association, NON-FERROUS FOUNDERS’
-
SOCIETY, Aluminium Casters’ Association of India, Casting Industry Suppliers
-
Association, International Trade Centre, World Trade Centre, Government Websites,
-
Press Releases, Journals, Annual Reports, Whitepapers, Company Websites, and MRFR
-
Analysis\r\nThe automotive & transportation segment accounted for the
-
largest market share of 39.80% in 2020, with a market value of USD 2,791.8 million;
-
it is expected to register the highest CAGR of 8.26% during the forecast period.
-
The building & construction segment accounted for the second largest market
-
share in 2020, valued at USD 1,308.5 million; it is projected to exhibit a CAGR
-
of 7.72%.\r\n \r\nTABLE 288 MEXICO: METAL CASTING MARKET, BY
-
END-USE INDUSTRY, 2022-2030 (KILO TONS)\r\nEnd-use Industry 2019 2020 2021
-
CAGR (2022-2030)\r\nAutomotive & Transportation 1,230.49 1,143.33
-
,190.93 2,187.25 6.99%\r\nBuilding & Construction 573.58 530.28 549.59
-
6.46%\r\nMining 325.03 299.11 308.57 519.19 5.95%\r\nEquipment
-
& Machine 474.64 439.56 456.35 814.09 6.64%\r\nConsumer Goods 291.53
-
278.17 479.32 6.23%\r\nOthers 161.55 147.82 151.60 240.77 5.27%\r\nTotal
-
,056.82 2,829.06 2,935.21 5,206.03 6.57%\r\nSource: Indiana Cast Metal Association
-
(INCMA), American Foundry Society (AFS), The North American Die Casting Association,
-
NON-FERROUS FOUNDERS’ SOCIETY, Aluminium Casters’ Association of India,
-
Casting Industry Suppliers Association, International Trade Centre, World Trade
-
Centre, Government Websites, Press Releases, Journals, Annual Reports, Whitepapers,
-
Company Websites, and MRFR Analysis\r\nThe automotive & transportation
-
segment dominated the market with a share of 40.41%, accounting for 1,143.33 kilo
-
tons in 2020; it is expected to register the highest CAGR of 6.99% from 2021 to
-
The building & construction segment was the second-largest with a share
-
of 18.74% in 2020, sized at 530.28 kilo tons; it is projected to exhibit a CAGR
-
of 6.46%.\r\nTABLE 289 MEXICO: METAL CASTING MARKET, BY AUTOMOTIVE &
-
TRANSPORTATION, 2022-2030 (USD MILLION)\r\nAutomotive & Transportation
-
2020 2021 2030 CAGR (2022-2030)\r\nGearbox 573.09 540.83 574.26 1,254.89
-
%\r\nWheels 302.81 285.17 302.16 648.85 8.86%\r\nEngine Blocks
-
406.41 428.73 885.91 8.40%\r\nCylinder Head 704.32 655.40 686.21 1,322.69
-
%\r\nExhaust Manifold 181.11 168.75 176.91 345.22 7.71%\r\nSeat
-
Frame 245.13 229.24 241.22 487.19 8.12%\r\nOthers 541.79 506.03 531.80 1,061.80
-
%\r\nTotal 2,981.73 2,791.82 2,941.29 6,006.56 8.26%\r\nSource:
-
Indiana Cast Metal Association (INCMA), American Foundry Society (AFS), The North
-
American Die Casting Association, NON-FERROUS FOUNDERS’ SOCIETY, Aluminium
-
Casters’ Association of India, Casting Industry Suppliers Association, International
-
Trade Centre, World Trade Centre, Government Websites, Press Releases, Journals,
-
Annual Reports, Whitepapers, Company Websites, and MRFR Analysis\r\nThe cylinder
-
head segment accounted for the largest market share of 23.48% in 2020, with a market
-
value of USD 655.4 million; it is expected to register a CAGR of 7.56% during the
-
forecast period. The gearbox segment accounted for the second largest market share
-
in 2020, valued at USD 540.8 million; it is projected to register the highest CAGR
-
of 9.07%.\r\n \r\nTABLE 290 MEXICO: METAL CASTING MARKET, BY
-
AUTOMOTIVE & TRANSPORTATION, 2022-2030 (KILO TONS)\r\nAutomotive &
-
Transportation 2019 2020 2021 2030 CAGR (2022-2030)\r\nGearbox 248.95 233.14
-
481.01 7.80%\r\nWheels 127.51 119.17 124.84 241.10 7.59%\r\nEngine
-
Blocks 186.34 173.37 180.83 336.04 7.13%\r\nCylinder Head 299.65 276.71 286.44
-
6.30%\r\nExhaust Manifold 75.50 69.80 72.35 126.98 6.45%\r\nSeat
-
Frame 101.16 93.88 97.67 177.41 6.86%\r\nOthers 191.39 177.26 184.04 328.17
-
%\r\nTotal 1,230.49 1,143.33 1,190.93 2,187.25 6.99%\r\nSource:
-
Indiana Cast Metal Association (INCMA), American Foundry Society (AFS), The North
-
American Die Casting Association, NON-FERROUS FOUNDERS’ SOCIETY, Aluminium
-
Casters’ Association of India, Casting Industry Suppliers Association, International
-
Trade Centre, World Trade Centre, Government Websites, Press Releases, Journals,
-
Annual Reports, Whitepapers, Company Websites, and MRFR Analysis\r\nThe cylinder
-
head segment dominated the market with a share of 24.20%, accounting for 276.71
-
kilo tons in 2020; it is projected to exhibit a CAGR of 6.30%. The Gearbox segment
-
was the second-largest with a share of 20.39% in 2020, sized at 233.14 kilo tons;
-
it is projected to exhibit the highest CAGR of 7.80%.\r\nTABLE 291 MEXICO:
-
METAL CASTING MARKET, BY EQUIPMENT & MACHINE, 2022-2030 (USD MILLION)\r\nEquipment
-
& Machine 2019 2020 2021 2030 CAGR (2022-2030)\r\nPumps & Valves
-
611.75 641.23 1,251.59 7.71%\r\nOthers 517.68 484.18 509.56 1,031.09
-
%\r\nTotal 1,174.38 1,095.93 1,150.79 2,282.69 7.91%\r\nSource:
-
Indiana Cast Metal Association (INCMA), American Foundry Society (AFS), The North
-
American Die Casting Association, NON-FERROUS FOUNDERS’ SOCIETY, Aluminium
-
Casters’ Association of India, Casting Industry Suppliers Association, International
-
Trade Centre, World Trade Centre, Government Websites, Press Releases, Journals,
-
Annual Reports, Whitepapers, Company Websites, and MRFR Analysis\r\nThe pumps
-
& valves segment accounted for a larger market share of 55.82% in 2020, with
-
a market value of USD 611.7 million; it is expected to register a CAGR of 7.71%
-
during the forecast period. The Others segment was valued at USD 484.2 million;
-
it is projected to register a higher CAGR of 8.15%.\r\n \r\nTABLE
-
MEXICO: METAL CASTING MARKET, BY EQUIPMENT & MACHINE, 2022-2030 (KILO TONS)\r\nEquipment
-
& Machine 2019 2020 2021 2030 CAGR (2022-2030)\r\nPumps & Valves
-
247.84 256.85 450.87 6.45%\r\nOthers 206.55 191.72 199.50 363.22 6.88%\r\nTotal
-
439.56 456.35 814.09 6.64%\r\nSource: Indiana Cast Metal Association
-
(INCMA), American Foundry Society (AFS), The North American Die Casting Association,
-
NON-FERROUS FOUNDERS’ SOCIETY, Aluminium Casters’ Association of India,
-
Casting Industry Suppliers Association, International Trade Centre, World Trade
-
Centre, Government Websites, Press Releases, Journals, Annual Reports, Whitepapers,
-
Company Websites, and MRFR Analysis\r\nThe pumps & valves segment dominated
-
the market with a share of 56.38%, accounting for 247.84 kilo tons in 2020; it is
-
projected to exhibit a CAGR of 6.45%. The Others segment accounted for a share of
-
% in 2020, sized at 191.72 kilo tons; it is projected to exhibit a higher CAGR
-
of 6.88%.\r\n9.1.3 ARGENTINA\r\nTABLE 293 ARGENTINA: METAL CASTING
-
MARKET, BY MATERIAL TYPE, 2022-2030 (USD MILLION)\r\nMaterial Type 2019 2020
-
2030 CAGR (2022-2030)\r\nCast Iron 864.37 797.96 828.88 1,489.73 6.73%\r\nAluminium
-
338.34 356.24 720.19 8.14%\r\nStainless Steel 170.86 159.69 167.91
-
8.01%\r\nZinc 59.28 55.05 57.53 109.17 7.38%\r\nMagnesium 33.08
-
31.80 57.75 6.86%\r\nCarbon Steel 16.93 15.38 15.71 23.85 4.75%\r\nHigh
-
Steel Alloy 43.04 39.67 41.13 72.70 6.53%\r\nOthers 89.61 81.15 82.65 121.01
-
%\r\nTotal 1,638.72 1,517.81 1,581.84 2,930.21 7.09%\r\nSource:
-
Indiana Cast Metal Association (INCMA), American Foundry Society (AFS), The North
-
American Die Casting Association, NON-FERROUS FOUNDERS’ SOCIETY, Aluminium
-
Casters’ Association of India, Casting Industry Suppliers Association, International
-
Trade Centre, World Trade Centre, Government Websites, Press Releases, Journals,
-
Annual Reports, Whitepapers, Company Websites, and MRFR Analysis\r\nThe cast
-
iron segment accounted for the largest market share of 52.57% in 2020, with a market
-
value of USD 798.0 million; it is expected to register a CAGR of 6.73% during the
-
forecast period. The aluminium segment accounted for the second largest market share
-
in 2020, valued at USD 338.3 million; it is projected to register the highest CAGR
-
of 8.14%.\r\n \r\nTABLE 294 ARGENTINA: METAL CASTING MARKET,
-
BY MATERIAL TYPE, 2022-2030 (KILO TONS)\r\nMaterial Type 2019 2020 2021 2030
-
CAGR (2022-2030)\r\nCast Iron 371.41 340.26 349.45 564.85 5.48%\r\nAluminium
-
141.30 147.09 267.44 6.87%\r\nStainless Steel 68.38 63.42 65.93 118.59
-
%\r\nZinc 24.44 22.53 23.27 39.72 6.12%\r\nMagnesium 13.56 12.44
-
20.89 5.60%\r\nCarbon Steel 7.24 6.52 6.59 9.00 3.52%\r\nHigh
-
Steel Alloy 18.30 16.74 17.16 27.28 5.29%\r\nOthers 38.51 34.60 34.84 45.88
-
%\r\nTotal 693.99 637.81 657.13 1,093.63 5.82%\r\nSource: Indiana
-
Cast Metal Association (INCMA), American Foundry Society (AFS), The North American
-
Die Casting Association, NON-FERROUS FOUNDERS’ SOCIETY, Aluminium Casters’
-
Association of India, Casting Industry Suppliers Association, International Trade
-
Centre, World Trade Centre, Government Websites, Press Releases, Journals, Annual
-
Reports, Whitepapers, Company Websites, and MRFR Analysis\r\nThe cast iron
-
segment dominated the market with a share of 53.35%, accounting for 340.26 kilo
-
tons in 2020; it is projected to exhibit a CAGR of 5.48%. The aluminium segment
-
was the second-largest with a share of 22.15% in 2020, sized at 141.30 kilo tons;
-
it is projected to exhibit the highest CAGR of 6.87%.\r\nTABLE 295 ARGENTINA:
-
METAL CASTING MARKET, BY PROCESS TYPE, 2022-2030 (USD MILLION)\r\nProcess
-
Type 2019 2020 2021 2030 CAGR (2022-2030)\r\nSand Casting 798.88 741.91 775.25
-
,470.20 7.37%\r\nDie Casting 405.89 378.34 396.80 776.71 7.75%\r\nShell
-
Mold Casting 126.18 116.26 120.53 212.66 6.51%\r\nGravity Casting 106.74
-
98.74 147.20 4.54%\r\nVacuum Casting 56.08 50.97 52.11 79.71 4.84%\r\nInvestment
-
Casting 71.78 66.32 68.95 124.89 6.82%\r\nOthers 73.16 67.20 69.45 118.84
-
%\r\nTotal 1,638.72 1,517.81 1,581.84 2,930.21 7.09%\r\nSource:
-
Indiana Cast Metal Association (INCMA), American Foundry Society (AFS), The North
-
American Die Casting Association, NON-FERROUS FOUNDERS’ SOCIETY, Aluminium
-
Casters’ Association of India, Casting Industry Suppliers Association, International
-
Trade Centre, World Trade Centre, Government Websites, Press Releases, Journals,
-
Annual Reports, Whitepapers, Company Websites, and MRFR Analysis\r\nThe sand
-
casting segment accounted for the largest market share of 48.88% in 2020, with a
-
market value of USD 741.9 million; it is expected to register a CAGR of 7.37% during
-
the forecast period. The die casting segment accounted for the second largest market
-
share in 2020, valued at USD 378.3 million; it is projected to register the highest
-
CAGR of 7.75%.\r\n \r\nTABLE 296 ARGENTINA: METAL CASTING MARKET,
-
BY PROCESS TYPE, 2022-2030 (KILO TONS)\r\nProcess Type 2019 2020 2021 2030
-
CAGR (2022-2030)\r\nSand Casting 350.66 323.17 333.87 569.43 6.11%\r\nDie
-
Casting 170.81 158.01 163.84 288.42 6.49%\r\nShell Mold Casting 54.22 49.58
-
80.63 5.26%\r\nGravity Casting 43.57 39.21 39.55 53.02 3.31%\r\nVacuum
-
Casting 22.44 20.24 20.46 28.15 3.61%\r\nInvestment Casting 29.60 27.14 27.89
-
5.57%\r\nOthers 22.69 20.47 20.69 28.53 3.63%\r\nTotal 693.99
-
657.13 1,093.63 5.82%\r\nSource: Indiana Cast Metal Association (INCMA),
-
American Foundry Society (AFS), The North American Die Casting Association, NON-FERROUS
-
FOUNDERS’ SOCIETY, Aluminium Casters’ Association of India, Casting
-
Industry Suppliers Association, International Trade Centre, World Trade Centre,
-
Government Websites, Press Releases, Journals, Annual Reports, Whitepapers, Company
-
Websites, and MRFR Analysis\r\nThe sand casting segment dominated the market
-
with a share of 50.67%, accounting for 323.17 kilo tons in 2020; it is projected
-
to exhibit a CAGR of 6.11%. The die casting segment was the second-largest with
-
a share of 24.77% in 2020, sized at 158.01 kilo tons; it is projected to exhibit
-
the highest CAGR of 6.49%.\r\nTABLE 297 ARGENTINA: METAL CASTING MARKET,
-
BY END-USE INDUSTRY, 2022-2030 (USD MILLION)\r\nEnd-use Industry 2019 2020
-
2030 CAGR (2022-2030)\r\nAutomotive & Transportation 648.09 602.60
-
1,208.18 7.49%\r\nBuilding & Construction 286.08 264.64 275.46
-
6.95%\r\nMining 189.15 174.24 180.61 318.16 6.49%\r\nEquipment
-
& Machine 251.79 233.34 243.31 452.91 7.15%\r\nConsumer Goods 178.81
-
171.59 309.42 6.77%\r\nOthers 84.80 77.86 80.43 137.05 6.10%\r\nTotal
-
,638.72 1,517.81 1,581.84 2,930.21 7.09%\r\nSource: Indiana Cast Metal Association
-
(INCMA), American Foundry Society (AFS), The North American Die Casting Association,
-
NON-FERROUS FOUNDERS’ SOCIETY, Aluminium Casters’ Association of India,
-
Casting Industry Suppliers Association, International Trade Centre, World Trade
-
Centre, Government Websites, Press Releases, Journals, Annual Reports, Whitepapers,
-
Company Websites, and MRFR Analysis\r\nThe automotive & transportation
-
segment accounted for the largest market share of 39.70% in 2020, with a market
-
value of USD 602.6 million; it is expected to register the highest CAGR of 7.49%
-
during the forecast period. The building & construction segment accounted for
-
the second largest market share in 2020, valued at USD 264.6 million; it is projected
-
to exhibit a CAGR of 6.95%.\r\n \r\nTABLE 298 ARGENTINA: METAL
-
CASTING MARKET, BY END-USE INDUSTRY, 2022-2030 (KILO TONS)\r\nEnd-use Industry
-
2020 2021 2030 CAGR (2022-2030)\r\nAutomotive & Transportation 278.48
-
265.79 458.09 6.24%\r\nBuilding & Construction 121.65 111.67 114.92
-
5.70%\r\nMining 78.79 72.03 73.81 116.94 5.25%\r\nEquipment
-
& Machine 105.96 97.45 100.47 168.18 5.89%\r\nConsumer Goods 73.73 67.57
-
112.58 5.52%\r\nOthers 35.38 32.14 32.72 48.54 4.48%\r\nTotal
-
637.81 657.13 1,093.63 5.82%\r\nSource: Indiana Cast Metal Association
-
(INCMA), American Foundry Society (AFS), The North American Die Casting Association,
-
NON-FERROUS FOUNDERS’ SOCIETY, Aluminium Casters’ Association of India,
-
Casting Industry Suppliers Association, International Trade Centre, World Trade
-
Centre, Government Websites, Press Releases, Journals, Annual Reports, Whitepapers,
-
Company Websites, and MRFR Analysis\r\nThe automotive & transportation
-
segment dominated the market with a share of 40.29%, accounting for 256.96 kilo
-
tons in 2020; it is expected to register the highest CAGR of 6.24% from 2021 to
-
The building & construction segment was the second-largest with a share
-
of 17.51% in 2020, sized at 111.67 kilo tons; it is projected to exhibit a CAGR
-
of 5.70%.\r\nTABLE 299 ARGENTINA: METAL CASTING MARKET, BY AUTOMOTIVE &
-
TRANSPORTATION, 2022-2030\r\n(USD MILLION)\r\nAutomotive & Transportation
-
2020 2021 2030 CAGR (2022-2030)\r\nGearbox 126.38 118.43 124.86 255.81
-
%\r\nWheels 67.57 63.18 66.47 133.78 8.08%\r\nEngine Blocks 94.80
-
92.46 179.28 7.63%\r\nCylinder Head 151.66 140.14 145.69 263.39 6.80%\r\nExhaust
-
Manifold 42.16 39.02 40.64 74.65 6.99%\r\nSeat Frame 47.95 44.52 46.52 88.06
-
%\r\nOthers 117.56 109.04 113.80 213.21 7.23%\r\nTotal 648.09
-
630.44 1,208.18 7.49%\r\nSource: Indiana Cast Metal Association (INCMA),
-
American Foundry Society (AFS), The North American Die Casting Association, NON-FERROUS
-
FOUNDERS’ SOCIETY, Aluminium Casters’ Association of India, Casting
-
Industry Suppliers Association, International Trade Centre, World Trade Centre,
-
Government Websites, Press Releases, Journals, Annual Reports, Whitepapers, Company
-
Websites, and MRFR Analysis\r\nThe cylinder head segment accounted for the
-
largest market share of 23.26% in 2020, with a market value of USD 140.1 million;
-
it is expected to register a CAGR of 6.80% during the forecast period. The gearbox
-
segment accounted for the second largest market share in 2020, valued at USD 118.4
-
million; it is projected to register the highest CAGR of 8.30%.\r\n \r\nTABLE
-
ARGENTINA: METAL CASTING MARKET, BY AUTOMOTIVE & TRANSPORTATION, 2022-2030
-
(KILO TONS)\r\nAutomotive & Transportation 2019 2020 2021 2030 CAGR (2022-2030)\r\nGearbox
-
53.16 55.41 102.10 7.03%\r\nWheels 29.63 27.49 28.60 51.76 6.81%\r\nEngine
-
Blocks 42.43 39.21 40.61 70.81 6.37%\r\nCylinder Head 67.18 61.60 63.32 102.96
-
%\r\nExhaust Manifold 18.30 16.81 17.31 28.59 5.74%\r\nSeat Frame
-
18.98 19.61 33.39 6.09%\r\nOthers 43.17 39.71 40.94 68.49 5.89%\r\nTotal
-
256.96 265.79 458.09 6.24%\r\nSource: Indiana Cast Metal Association
-
(INCMA), American Foundry Society (AFS), The North American Die Casting Association,
-
NON-FERROUS FOUNDERS’ SOCIETY, Aluminium Casters’ Association of India,
-
Casting Industry Suppliers Association, International Trade Centre, World Trade
-
Centre, Government Websites, Press Releases, Journals, Annual Reports, Whitepapers,
-
Company Websites, and MRFR Analysis\r\nThe cylinder head segment dominated
-
the market with a share of 23.97%, accounting for 61.60 kilo tons in 2020; it is
-
projected to exhibit a CAGR of 5.55%. The Gearbox segment was the second-largest
-
with a share of 20.69% in 2020, sized at 53.16 kilo tons; it is projected to exhibit
-
the highest CAGR of 7.03%.\r\nTABLE 301 ARGENTINA: METAL CASTING MARKET,
-
BY EQUIPMENT & MACHINE, 2022-2030 (USD MILLION)\r\nEquipment & Machine
-
2020 2021 2030 CAGR (2022-2030)\r\nPumps & Valves 143.01 132.30
-
252.31 6.96%\r\nOthers 108.78 101.04 105.60 200.59 7.39%\r\nTotal
-
233.34 243.31 452.91 7.15%\r\nSource: Indiana Cast Metal Association
-
(INCMA), American Foundry Society (AFS), The North American Die Casting Association,
-
NON-FERROUS FOUNDERS’ SOCIETY, Aluminium Casters’ Association of India,
-
Casting Industry Suppliers Association, International Trade Centre, World Trade
-
Centre, Government Websites, Press Releases, Journals, Annual Reports, Whitepapers,
-
Company Websites, and MRFR Analysis\r\nThe pumps & valves segment accounted
-
for a larger market share of 56.70% in 2020, with a market value of USD 132.3 million;
-
it is expected to register a CAGR of 6.96% during the forecast period. The Others
-
segment was valued at USD 101.0 million; it is projected to register a higher CAGR
-
of 7.39%.\r\n \r\nTABLE 302 ARGENTINA: METAL CASTING MARKET,
-
BY EQUIPMENT & MACHINE, 2022-2030 (KILO TONS)\r\nEquipment & Machine
-
2020 2021 2030 CAGR (2022-2030)\r\nPumps & Valves 60.79 55.81 57.44
-
5.71%\r\nOthers 45.17 41.64 43.03 73.54 6.14%\r\nTotal 105.96
-
100.47 168.18 5.89%\r\nSource: Indiana Cast Metal Association (INCMA),
-
American Foundry Society (AFS), The North American Die Casting Association, NON-FERROUS
-
FOUNDERS’ SOCIETY, Aluminium Casters’ Association of India, Casting
-
Industry Suppliers Association, International Trade Centre, World Trade Centre,
-
Government Websites, Press Releases, Journals, Annual Reports, Whitepapers, Company
-
Websites, and MRFR Analysis\r\nThe pumps & valves segment dominated the
-
market with a share of 57.27%, accounting for 55.81 kilo tons in 2020; it is projected
-
to exhibit a CAGR of 5.71%. The Others segment accounted for a share of 42.73% in
-
, sized at 41.64 kilo tons; it is projected to exhibit a higher CAGR of 6.14%.\r\n9.1.4
-
REST OF LATIN AMERICA\r\nTABLE 303 REST OF LATIN AMERICA: METAL CASTING MARKET,
-
BY MATERIAL TYPE, 2022-2030 (USD MILLION)\r\nMaterial Type 2019 2020 2021
-
CAGR (2022-2030)\r\nCast Iron 640.42 587.88 607.16 1,031.99 6.07%\r\nAluminium
-
259.86 271.39 508.81 7.23%\r\nStainless Steel 111.27 103.56 108.42
-
7.48%\r\nZinc 52.91 48.84 50.73 90.72 6.67%\r\nMagnesium 39.90
-
37.97 65.72 6.28%\r\nCarbon Steel 27.09 24.73 25.39 40.77 5.41%\r\nHigh
-
Steel Alloy 47.59 43.68 45.11 76.58 6.06%\r\nOthers 35.53 31.90 32.21 43.04
-
%\r\nTotal 1,234.65 1,137.15 1,178.38 2,065.15 6.43%\r\nSource:
-
Indiana Cast Metal Association (INCMA), American Foundry Society (AFS), The North
-
American Die Casting Association, NON-FERROUS FOUNDERS’ SOCIETY, Aluminium
-
Casters’ Association of India, Casting Industry Suppliers Association, International
-
Trade Centre, World Trade Centre, Government Websites, Press Releases, Journals,
-
Annual Reports, Whitepapers, Company Websites, and MRFR Analysis\r\nThe cast
-
iron segment accounted for the largest market share of 51.70% in 2020, with a market
-
value of USD 587.9 million; it is expected to register a CAGR of 6.07% during the
-
forecast period. The aluminium segment accounted for the second largest market share
-
in 2020, valued at USD 259.9 million; it is projected to exhibit a CAGR of 7.23%.
-
However, the stainless steel segment is expected to register the highest CAGR of
-
%.\r\n \r\nTABLE 304 REST OF LATIN AMERICA: METAL CASTING
-
MARKET, BY MATERIAL TYPE, 2022-2030 (KILO TONS)\r\nMaterial Type 2019 2020
-
2030 CAGR (2022-2030)\r\nCast Iron 261.69 238.39 243.43 372.11 4.83%\r\nAluminium
-
103.21 106.57 179.68 5.98%\r\nStainless Steel 42.35 39.11 40.49 69.69
-
%\r\nZinc 20.75 19.00 19.52 31.39 5.42%\r\nMagnesium 15.55 14.19
-
22.60 5.04%\r\nCarbon Steel 11.01 9.97 10.13 14.62 4.17%\r\nHigh
-
Steel Alloy 19.25 17.53 17.90 27.33 4.81%\r\nOthers 14.52 12.94 12.91 15.52
-
%\r\nTotal 497.15 454.35 465.46 732.94 5.17%\r\nSource: Indiana
-
Cast Metal Association (INCMA), American Foundry Society (AFS), The North American
-
Die Casting Association, NON-FERROUS FOUNDERS’ SOCIETY, Aluminium Casters’
-
Association of India, Casting Industry Suppliers Association, International Trade
-
Centre, World Trade Centre, Government Websites, Press Releases, Journals, Annual
-
Reports, Whitepapers, Company Websites, and MRFR Analysis\r\nThe cast iron
-
segment dominated the market with a share of 52.47%, accounting for 238.39 kilo
-
tons in 2020 and is projected to register a CAGR of 4.83%. The aluminium segment
-
was the second-largest with a share of 22.71% in 2020, sized at 103.21 kilo tons;
-
it is projected to exhibit a CAGR of 5.98%. However, the stainless steel segment
-
is expected to register the highest CAGR of 6.22%.\r\nTABLE 305 REST OF LATIN
-
AMERICA: METAL CASTING MARKET, BY PROCESS TYPE, 2022-2030 (USD MILLION)\r\nProcess
-
Type 2019 2020 2021 2030 CAGR (2022-2030)\r\nSand Casting 623.55 575.78 598.19
-
,072.45 6.70%\r\nDie Casting 293.90 272.38 284.01 525.29 7.07%\r\nShell
-
Mold Casting 95.56 87.56 90.26 150.72 5.86%\r\nGravity Casting 60.33 54.26
-
74.91 3.52%\r\nVacuum Casting 40.79 36.84 37.43 53.75 4.10%\r\nInvestment
-
Casting 79.67 73.25 75.78 130.78 6.25%\r\nOthers 40.85 37.07 37.84 57.25
-
%\r\nTotal 1,234.65 1,137.15 1,178.38 2,065.15 6.43%\r\nSource:
-
Indiana Cast Metal Association (INCMA), American Foundry Society (AFS), The North
-
American Die Casting Association, NON-FERROUS FOUNDERS’ SOCIETY, Aluminium
-
Casters’ Association of India, Casting Industry Suppliers Association, International
-
Trade Centre, World Trade Centre, Government Websites, Press Releases, Journals,
-
Annual Reports, Whitepapers, Company Websites, and MRFR Analysis\r\nThe sand
-
casting segment accounted for the largest market share of 50.63% in 2020, with a
-
market value of USD 575.8 million; it is expected to register a CAGR of 6.70% during
-
the forecast period. The die casting segment accounted for the second largest market
-
share in 2020, valued at USD 272.4 million; it is projected to register the highest
-
CAGR of 7.07%.\r\n \r\nTABLE 306 REST OF LATIN AMERICA: METAL
-
CASTING MARKET, BY PROCESS TYPE, 2022-2030 (KILO TONS)\r\nProcess Type 2019
-
2021 2030 CAGR (2022-2030)\r\nSand Casting 260.28 238.51 244.99 395.01
-
%\r\nDie Casting 117.62 108.18 111.52 185.50 5.82%\r\nShell Mold
-
Casting 39.05 35.51 36.19 54.35 4.62%\r\nGravity Casting 23.42 20.90 20.90
-
2.30%\r\nVacuum Casting 15.52 13.92 13.98 18.05 2.88%\r\nInvestment
-
Casting 31.24 28.50 29.15 45.25 5.01%\r\nOthers 10.01 8.83 8.72 9.12 0.49%\r\nTotal
-
454.35 465.46 732.94 5.17%\r\nSource: Indiana Cast Metal Association
-
(INCMA), American Foundry Society (AFS), The North American Die Casting Association,
-
NON-FERROUS FOUNDERS’ SOCIETY, Aluminium Casters’ Association of India,
-
Casting Industry Suppliers Association, International Trade Centre, World Trade
-
Centre, Government Websites, Press Releases, Journals, Annual Reports, Whitepapers,
-
Company Websites, and MRFR Analysis\r\nThe sand casting segment dominated
-
the market with a share of 52.49%, accounting for 238.51 kilo tons in 2020; it is
-
projected to exhibit a CAGR of 5.45%. The die casting segment was the second-largest
-
with a share of 23.81% in 2020, sized at 108.18 kilo tons; it is projected to exhibit
-
the highest CAGR of 5.82%.\r\nTABLE 307 REST OF LATIN AMERICA: METAL CASTING
-
MARKET, BY END-USE INDUSTRY, 2022-2030 (USD MILLION)\r\nEnd-use Industry
-
2020 2021 2030 CAGR (2022-2030)\r\nAutomotive & Transportation 542.16
-
521.06 941.61 6.80%\r\nBuilding & Construction 214.27 197.10 203.99
-
6.30%\r\nMining 120.85 110.60 113.88 188.08 5.73%\r\nEquipment
-
& Machine 171.22 157.80 163.62 288.35 6.50%\r\nConsumer Goods 129.80
-
123.13 209.87 6.10%\r\nOthers 56.35 51.37 52.69 83.76 5.29%\r\nTotal
-
,234.65 1,137.15 1,178.38 2,065.15 6.43%\r\nSource: Indiana Cast Metal Association
-
(INCMA), American Foundry Society (AFS), The North American Die Casting Association,
-
NON-FERROUS FOUNDERS’ SOCIETY, Aluminium Casters’ Association of India,
-
Casting Industry Suppliers Association, International Trade Centre, World Trade
-
Centre, Government Websites, Press Releases, Journals, Annual Reports, Whitepapers,
-
Company Websites, and MRFR Analysis\r\nThe automotive & transportation
-
segment accounted for the largest market share of 44.07% in 2020, with a market
-
value of USD 501.1 million; it is expected to register the highest CAGR of 6.80%
-
during the forecast period. The building & construction segment accounted for
-
the second largest market share in 2020, valued at USD 197.1 million; it is projected
-
to exhibit a CAGR of 6.30%.\r\n \r\nTABLE 308 REST OF LATIN AMERICA:
-
METAL CASTING MARKET, BY END-USE INDUSTRY, 2022-2030 (KILO TONS)\r\nEnd-use
-
Industry 2019 2020 2021 2030 CAGR (2022-2030)\r\nAutomotive & Transportation
-
203.20 208.91 339.52 5.54%\r\nBuilding & Construction 86.65 79.10
-
126.13 5.05%\r\nMining 47.87 43.48 44.26 65.74 4.49%\r\nEquipment
-
& Machine 68.52 62.67 64.25 101.83 5.25%\r\nConsumer Goods 50.90 46.38
-
72.62 4.86%\r\nOthers 21.67 19.53 19.73 27.11 3.59%\r\nTotal
-
454.35 465.46 732.94 5.17%\r\nSource: Indiana Cast Metal Association
-
(INCMA), American Foundry Society (AFS), The North American Die Casting Association,
-
NON-FERROUS FOUNDERS’ SOCIETY, Aluminium Casters’ Association of India,
-
Casting Industry Suppliers Association, International Trade Centre, World Trade
-
Centre, Government Websites, Press Releases, Journals, Annual Reports, Whitepapers,
-
Company Websites, and MRFR Analysis\r\nThe automotive & transportation
-
segment dominated the market with a share of 44.72%, accounting for 203.20 kilo
-
tons in 2020; it is expected to register the highest CAGR of 5.54% from 2021 to
-
The building & construction segment was the second-largest with a share
-
of 17.41% in 2020, sized at 79.10 kilo tons; it is projected to exhibit a CAGR of
-
%.\r\nTABLE 309 REST OF LATIN AMERICA: METAL CASTING MARKET, BY AUTOMOTIVE
-
& TRANSPORTATION, 2022-2030 (USD MILLION)\r\nAutomotive & Transportation
-
2020 2021 2030 CAGR (2022-2030)\r\nGearbox 109.83 102.27 107.14 206.49
-
%\r\nWheels 56.15 52.19 54.58 103.61 7.38%\r\nEngine Blocks 71.41
-
68.83 126.00 6.95%\r\nCylinder Head 127.23 116.86 120.76 205.90 6.11%\r\nExhaust
-
Manifold 36.99 34.04 35.24 61.16 6.32%\r\nSeat Frame 45.16 41.69 43.30 77.40
-
%\r\nOthers 95.40 87.94 91.22 161.04 6.52%\r\nTotal 542.16 501.09
-
941.61 6.80%\r\nSource: Indiana Cast Metal Association (INCMA), American
-
Foundry Society (AFS), The North American Die Casting Association, NON-FERROUS FOUNDERS’
-
SOCIETY, Aluminium Casters’ Association of India, Casting Industry Suppliers
-
Association, International Trade Centre, World Trade Centre, Government Websites,
-
Press Releases, Journals, Annual Reports, Whitepapers, Company Websites, and MRFR
-
Analysis\r\nThe cylinder head segment accounted for the largest market share
-
of 23.32% in 2020, with a market value of USD 116.9 million; it is expected to register
-
a CAGR of 6.11% during the forecast period. The gearbox segment accounted for the
-
second largest market share in 2020, valued at USD 102.3 million; it is projected
-
to register the highest CAGR of 7.56%.\r\nTABLE 310 REST OF LATIN AMERICA:
-
METAL CASTING MARKET, BY AUTOMOTIVE & TRANSPORTATION, 2022-2030 (KILO TONS)\r\nAutomotive
-
& Transportation 2019 2020 2021 2030 CAGR (2022-2030)\r\nGearbox 47.24
-
45.22 78.37 6.30%\r\nWheels 23.41 21.60 22.33 38.12 6.12%\r\nEngine
-
Blocks 30.39 27.92 28.74 47.33 5.70%\r\nCylinder Head 53.60 48.85 49.91 76.54
-
%\r\nExhaust Manifold 15.27 13.94 14.27 22.28 5.07%\r\nSeat Frame
-
16.91 17.36 27.91 5.42%\r\nOthers 33.18 30.33 31.07 48.97 5.18%\r\nTotal
-
203.20 208.91 339.52 5.54%\r\nSource: Indiana Cast Metal Association
-
(INCMA), American Foundry Society (AFS), The North American Die Casting Association,
-
NON-FERROUS FOUNDERS’ SOCIETY, Aluminium Casters’ Association of India,
-
Casting Industry Suppliers Association, International Trade Centre, World Trade
-
Centre, Government Websites, Press Releases, Journals, Annual Reports, Whitepapers,
-
Company Websites, and MRFR Analysis\r\nThe cylinder head segment dominated
-
the market with a share of 24.04%, accounting for 48.85 kilo tons in 2020; it is
-
projected to exhibit a CAGR of 4.86%. The Gearbox segment was the second-largest
-
with a share of 21.48% in 2020, sized at 43.66 kilo tons; it is projected to exhibit
-
the highest CAGR of 6.30%.\r\nTABLE 311 REST OF LATIN AMERICA: METAL CASTING
-
MARKET, BY EQUIPMENT & MACHINE, 2022-2030\r\n(USD MILLION)\r\nEquipment
-
& Machine 2019 2020 2021 2030 CAGR (2022-2030)\r\nPumps & Valves
-
89.09 92.22 159.95 6.31%\r\nOthers 74.38 68.71 71.40 128.41 6.74%\r\nTotal
-
157.80 163.62 288.35 6.50%\r\nSource: Indiana Cast Metal Association
-
(INCMA), American Foundry Society (AFS), The North American Die Casting Association,
-
NON-FERROUS FOUNDERS’ SOCIETY, Aluminium Casters’ Association of India,
-
Casting Industry Suppliers Association, International Trade Centre, World Trade
-
Centre, Government Websites, Press Releases, Journals, Annual Reports, Whitepapers,
-
Company Websites, and MRFR Analysis\r\nThe pumps & valves segment accounted
-
for a larger market share of 56.46% in 2020, with a market value of USD 89.1 million;
-
it is expected to register a CAGR of 6.31% during the forecast period. The Others
-
segment was valued at USD 68.7 million; it is projected to register a higher CAGR
-
of 6.74%.\r\n \r\nTABLE 312 REST OF LATIN AMERICA: METAL CASTING
-
MARKET, BY EQUIPMENT & MACHINE, 2022-2030\r\n(KILO TONS)\r\nEquipment
-
& Machine 2019 2020 2021 2030 CAGR (2022-2030)\r\nPumps & Valves
-
35.74 36.58 57.05 5.06%\r\nOthers 29.38 26.93 27.67 44.78 5.49%\r\nTotal
-
62.67 64.25 101.83 5.25%\r\nSource: Indiana Cast Metal Association
-
(INCMA), American Foundry Society (AFS), The North American Die Casting Association,
-
NON-FERROUS FOUNDERS’ SOCIETY, Aluminium Casters’ Association of India,
-
Casting Industry Suppliers Association, International Trade Centre, World Trade
-
Centre, Government Websites, Press Releases, Journals, Annual Reports, Whitepapers,
-
Company Websites, and MRFR Analysis\r\nThe pumps & valves segment dominated
-
the market with a share of 57.03%, accounting for 35.74 kilo tons in 2020; it is
-
projected to exhibit a CAGR of 5.06%. The Others segment accounted for a share of
-
% in 2020, sized at 26.93 kilo tons; it is projected to exhibit a higher CAGR
-
of 5.49%.\r\n \r\n9.2 MIDDLE EAST & AFRICA\r\nFIGURE
-
MIDDLE EAST & AFRICA: METAL CASTING MARKET SHARE, BY COUNTRY, 2020 (% SHARE)\r\nSource:
-
Indiana Cast Metal Association (INCMA), American Foundry Society (AFS), The North
-
American Die Casting Association, NON-FERROUS FOUNDERS’ SOCIETY, Aluminium
-
Casters’ Association of India, Casting Industry Suppliers Association, International
-
Trade Centre, World Trade Centre, Government Websites, Press Releases, Journals,
-
Annual Reports, Whitepapers, Company Websites, and MRFR Analysis\r\nTABLE
-
MIDDLE EAST & AFRICA: METAL CASTING MARKET, BY COUNTRY, 2022-2030 (USD MILLION)\r\nCountry
-
2020 2021 2030 CAGR (2022-2030)\r\nGCC Countries 8,169.4 7,616.1 7,989.5
-
,713.7 7.81%\r\nSouth Africa 1,934.0 1,795.5 1,875.7 3,550.7 7.35%\r\nTurkey
-
,725.8 6,288.6 6,616.1 13,351.8 8.11%\r\nRest of the Middle East & Africa
-
,345.0 2,171.8 2,263.2 4,186.0 7.07%\r\nTotal 19,174.2 17,872.0 18,744.5
-
,802.3 7.78%\r\nSource: Indiana Cast Metal Association (INCMA), American
-
Foundry Society (AFS), The North American Die Casting Association, NON-FERROUS FOUNDERS’
-
SOCIETY, Aluminium Casters’ Association of India, Casting Industry Suppliers
-
Association, International Trade Centre, World Trade Centre, Government Websites,
-
Press Releases, Journals, Annual Reports, Whitepapers, Company Websites, and MRFR
-
Analysis\r\nGCC Countries accounted for the largest market share of 42.61%
-
in 2020, with a market value of USD 7,616.1 million; the market is expected to register
-
a CAGR of 7.81% during the forecast period. Turkey was the second-largest market
-
in 2020, valued at USD 6,288.6 million; it is projected to register at the highest
-
CAGR of 8.11%.\r\n \r\nTABLE 314 MIDDLE EAST & AFRICA: METAL
-
CASTING MARKET, BY COUNTRY, 2022-2030 (KILO TONS)\r\nCountry 2019 2020 2021
-
CAGR (2022-2030)\r\nGCC Countries 3,220.23 2,978.90 3,089.26 5,458.83
-
%\r\nSouth Africa 778.77 717.42 740.90 1,260.08 6.08%\r\nTurkey
-
,650.13 2,458.69 2,557.20 4,636.49 6.84%\r\nRest of the Middle East &
-
Africa 963.47 885.42 912.17 1,515.74 5.80%\r\nTotal 7,612.60 7,040.44 7,299.53
-
,871.14 6.50%\r\nSource: Indiana Cast Metal Association (INCMA), American
-
Foundry Society (AFS), The North American Die Casting Association, NON-FERROUS FOUNDERS’
-
SOCIETY, Aluminium Casters’ Association of India, Casting Industry Suppliers
-
Association, International Trade Centre, World Trade Centre, Government Websites,
-
Press Releases, Journals, Annual Reports, Whitepapers, Company Websites, and MRFR
-
Analysis\r\nGCC Countries market dominated with a share of 42.31%, accounting
-
for 2,978.90 kilo tons in 2020 and is projected to register a CAGR of 6.53%. The
-
market in Turkey was the second-largest with a share of 34.92% in 2020, sized at
-
,458.69 kilo tons; it is projected to exhibit the highest CAGR of 6.84%.\r\nTABLE
-
MIDDLE EAST & AFRICA: METAL CASTING MARKET, BY MATERIAL TYPE, 2022-2030
-
(USD MILLION)\r\nMaterial Type 2019 2020 2021 2030 CAGR (2022-2030)\r\nCast
-
Iron 9,740.26 9,047.70 9,456.79 17,991.87 7.41%\r\nAluminium 4,116.39 3,877.59
-
,109.62 8,822.91 8.86%\r\nStainless Steel 1,829.09 1,722.11 1,824.24 3,900.56
-
%\r\nZinc 898.25 839.00 881.80 1,763.71 8.01%\r\nMagnesium 642.09
-
625.87 1,212.69 7.63%\r\nCarbon Steel 352.34 324.90 337.08 596.87
-
%\r\nHigh Steel Alloy 544.19 504.87 527.05 991.18 7.27%\r\nOthers
-
,051.57 958.24 982.04 1,522.49 4.99%\r\nTotal 19,174.17 17,872.02 18,744.49
-
,802.28 7.78%\r\nSource: Indiana Cast Metal Association (INCMA), American
-
Foundry Society (AFS), The North American Die Casting Association, NON-FERROUS FOUNDERS’
-
SOCIETY, Aluminium Casters’ Association of India, Casting Industry Suppliers
-
Association, International Trade Centre, World Trade Centre, Government Websites,
-
Press Releases, Journals, Annual Reports, Whitepapers, Company Websites, and MRFR
-
Analysis\r\nThe cast iron segment accounted for the largest market share
-
of 50.62% in 2020, with a market value of USD 9,047.7 million; it is expected to
-
register a CAGR of 7.41% during the forecast period. The aluminium segment accounted
-
for the second largest market share in 2020, valued at USD 3,877.6 million; it is
-
projected to register the highest CAGR of 8.86%.\r\n \r\nTABLE
-
MIDDLE EAST & AFRICA: METAL CASTING MARKET, BY MATERIAL TYPE, 2022-2030
-
(KILO TONS)\r\nMaterial Type 2019 2020 2021 2030 CAGR (2022-2030)\r\nCast
-
Iron 3,925.40 3,618.35 3,739.05 6,395.30 6.15%\r\nAluminium 1,624.67 1,518.70
-
,591.31 3,071.36 7.58%\r\nStainless Steel 686.17 641.09 671.41 1,290.69
-
%\r\nZinc 347.44 322.04 334.62 601.69 6.74%\r\nMagnesium 246.94
-
236.15 411.34 6.36%\r\nCarbon Steel 141.31 129.31 132.64 211.15 5.30%\r\nHigh
-
Steel Alloy 217.05 199.83 206.24 348.69 6.01%\r\nOthers 423.61 383.06 388.11
-
3.76%\r\nTotal 7,612.60 7,040.44 7,299.53 12,871.14 6.50%\r\nSource:
-
Indiana Cast Metal Association (INCMA), American Foundry Society (AFS), The North
-
American Die Casting Association, NON-FERROUS FOUNDERS’ SOCIETY, Aluminium
-
Casters’ Association of India, Casting Industry Suppliers Association, International
-
Trade Centre, World Trade Centre, Government Websites, Press Releases, Journals,
-
Annual Reports, Whitepapers, Company Websites, and MRFR Analysis\r\nThe cast
-
iron segment dominated the market with a share of 51.39%, accounting for 3,618.35
-
kilo tons in 2020; it is projected to exhibit a CAGR of 6.15%. The aluminium segment
-
was the second-largest with a share of 21.57% in 2020, sized at 1,518.70 kilo tons;
-
it is projected to exhibit the highest CAGR of 7.58%.\r\nTABLE 317 MIDDLE
-
EAST & AFRICA: METAL CASTING MARKET, BY PROCESS TYPE, 2022-2030 (USD MILLION)\r\nProcess
-
Type 2019 2020 2021 2030 CAGR (2022-2030)\r\nSand Casting 9,429.65 8,812.50
-
,267.06 18,624.53 8.06%\r\nDie Casting 4,580.61 4,297.93 4,537.53 9,434.48
-
%\r\nShell Mold Casting 1,498.07 1,388.93 1,448.97 2,707.81 7.19%\r\nGravity
-
Casting 1,044.84 949.59 970.46 1,455.60 4.61%\r\nVacuum Casting 609.28 556.63
-
914.43 5.35%\r\nInvestment Casting 1,195.29 1,112.26 1,164.62 2,252.25
-
%\r\nOthers 816.43 754.18 783.87 1,413.18 6.77%\r\nTotal 19,174.17
-
,872.02 18,744.49 36,802.28 7.78%\r\nSource: Indiana Cast Metal Association
-
(INCMA), American Foundry Society (AFS), The North American Die Casting Association,
-
NON-FERROUS FOUNDERS’ SOCIETY, Aluminium Casters’ Association of India,
-
Casting Industry Suppliers Association, International Trade Centre, World Trade
-
Centre, Government Websites, Press Releases, Journals, Annual Reports, Whitepapers,
-
Company Websites, and MRFR Analysis\r\nThe sand casting segment accounted
-
for the largest market share of 49.31% in 2020, with a market value of USD 8,812.5
-
million; it is expected to register a CAGR of 8.06% during the forecast period.
-
The die casting segment accounted for the second largest market share in 2020, valued
-
at USD 4,297.9 million; it is projected to register the highest CAGR of 8.47%.\r\n \r\nTABLE
-
MIDDLE EAST & AFRICA: METAL CASTING MARKET, BY PROCESS TYPE, 2022-2030 (KILO
-
TONS)\r\nProcess Type 2019 2020 2021 2030 CAGR (2022-2030)\r\nSand
-
Casting 3,881.11 3,599.30 3,742.02 6,761.17 6.79%\r\nDie Casting 1,808.07
-
,683.49 1,757.17 3,284.54 7.20%\r\nShell Mold Casting 603.85 555.57 573.01
-
5.93%\r\nGravity Casting 400.53 361.23 364.99 492.34 3.38%\r\nVacuum
-
Casting 228.77 207.41 210.71 302.86 4.11%\r\nInvestment Casting 462.03 426.64
-
767.87 6.34%\r\nOthers 228.24 206.80 209.96 299.66 4.03%\r\nTotal
-
,612.60 7,040.44 7,299.53 12,871.14 6.50%\r\nSource: Indiana Cast Metal
-
Association (INCMA), American Foundry Society (AFS), The North American Die Casting
-
Association, NON-FERROUS FOUNDERS’ SOCIETY, Aluminium Casters’ Association
-
of India, Casting Industry Suppliers Association, International Trade Centre, World
-
Trade Centre, Government Websites, Press Releases, Journals, Annual Reports, Whitepapers,
-
Company Websites, and MRFR Analysis\r\nThe sand casting segment dominated
-
the market with a share of 51.12%, accounting for 3,599.30 kilo tons in 2020; it
-
is projected to exhibit a CAGR of 6.79%. The die casting segment was the second-largest
-
with a share of 23.91% in 2020, sized at 1,683.49 kilo tons; it is projected to
-
exhibit the highest CAGR of 7.20%.\r\nTABLE 319 MIDDLE EAST & AFRICA:
-
METAL CASTING MARKET, BY END-USE INDUSTRY, 2022-2030 (USD MILLION)\r\nEnd-use
-
Industry 2019 2020 2021 2030 CAGR (2022-2030)\r\nAutomotive & Transportation
-
,653.55 7,161.29 7,539.73 15,312.36 8.19%\r\nBuilding & Construction
-
,486.75 3,246.36 3,401.06 6,610.92 7.66%\r\nMining 2,098.65 1,944.70 2,027.65
-
,769.51 7.13%\r\nEquipment & Machine 2,811.96 2,622.79 2,752.71 5,437.82
-
%\r\nConsumer Goods 1,846.69 1,715.11 1,792.38 3,404.96 7.39%\r\nOthers
-
,276.57 1,181.77 1,230.95 2,266.70 7.02%\r\nTotal 19,174.17 17,872.02 18,744.49
-
,802.28 7.78%\r\nSource: Indiana Cast Metal Association (INCMA), American
-
Foundry Society (AFS), The North American Die Casting Association, NON-FERROUS FOUNDERS’
-
SOCIETY, Aluminium Casters’ Association of India, Casting Industry Suppliers
-
Association, International Trade Centre, World Trade Centre, Government Websites,
-
Press Releases, Journals, Annual Reports, Whitepapers, Company Websites, and MRFR
-
Analysis\r\nThe automotive & transportation segment accounted for the
-
largest market share of 40.07% in 2020, with a market value of USD 7,161.3 million;
-
it is expected to register the highest CAGR of 8.19% during the forecast period.
-
The building & construction segment accounted for the second largest market
-
share in 2020, valued at USD 3,246.4 million; it is projected to exhibit a CAGR
-
of 7.66%.\r\n \r\nTABLE 320 MIDDLE EAST & AFRICA: METAL CASTING
-
MARKET, BY END-USE INDUSTRY, 2022-2030 (KILO TONS)\r\nEnd-use Industry 2019
-
2021 2030 CAGR (2022-2030)\r\nAutomotive & Transportation 3,084.20
-
,863.72 2,980.85 5,442.45 6.92%\r\nBuilding & Construction 1,389.97
-
,284.22 1,330.16 2,324.46 6.40%\r\nMining 820.43 754.42 777.67 1,299.74
-
%\r\nEquipment & Machine 1,109.64 1,027.06 1,065.71 1,892.67 6.59%\r\nConsumer
-
Goods 714.73 658.71 680.58 1,162.33 6.13%\r\nOthers 493.64 452.30 464.56
-
5.46%\r\nTotal 7,612.60 7,040.44 7,299.53 12,871.14 6.50%\r\nSource:
-
Indiana Cast Metal Association (INCMA), American Foundry Society (AFS), The North
-
American Die Casting Association, NON-FERROUS FOUNDERS’ SOCIETY, Aluminium
-
Casters’ Association of India, Casting Industry Suppliers Association, International
-
Trade Centre, World Trade Centre, Government Websites, Press Releases, Journals,
-
Annual Reports, Whitepapers, Company Websites, and MRFR Analysis\r\nThe automotive
-
& transportation segment dominated the market with a share of 40.68%, accounting
-
for 2,863.72 kilo tons in 2020; it is expected to register the highest CAGR of 6.92%
-
from 2021 to 2030. The building & construction segment was the second-largest
-
with a share of 18.24% in 2020, sized at 1,284.22 kilo tons; it is projected to
-
exhibit a CAGR of 6.40%.\r\nTABLE 321 MIDDLE EAST & AFRICA: METAL CASTING
-
MARKET, BY AUTOMOTIVE & TRANSPORTATION, 2022-2030 (USD MILLION)\r\nAutomotive
-
& Transportation 2019 2020 2021 2030 CAGR (2022-2030)\r\nGearbox 1,421.97
-
,341.19 1,423.30 3,096.04 9.02%\r\nWheels 858.23 807.46 854.80 1,821.27
-
%\r\nEngine Blocks 1,117.29 1,046.82 1,103.60 2,267.99 8.33%\r\nCylinder
-
Head 1,798.73 1,672.68 1,750.17 3,355.04 7.50%\r\nExhaust Manifold 467.67
-
456.12 884.31 7.63%\r\nSeat Frame 612.15 572.05 601.50 1,207.49 8.05%\r\nOthers
-
,377.51 1,285.69 1,350.24 2,680.21 7.92%\r\nTotal 7,653.55 7,161.29 7,539.73
-
,312.36 8.19%\r\nSource: Indiana Cast Metal Association (INCMA), American
-
Foundry Society (AFS), The North American Die Casting Association, NON-FERROUS FOUNDERS’
-
SOCIETY, Aluminium Casters’ Association of India, Casting Industry Suppliers
-
Association, International Trade Centre, World Trade Centre, Government Websites,
-
Press Releases, Journals, Annual Reports, Whitepapers, Company Websites, and MRFR
-
Analysis\r\nThe cylinder head segment accounted for the largest market share
-
of 23.36% in 2020, with a market value of USD 1,672.7 million; it is expected to
-
register a CAGR of 7.50% during the forecast period. The gearbox segment accounted
-
for the second largest market share in 2020, valued at USD 1,341.2 million; it is
-
projected to register the highest CAGR of 9.02%.\r\nTABLE 322 MIDDLE EAST
-
& AFRICA: METAL CASTING MARKET, BY AUTOMOTIVE & TRANSPORTATION, 2022-2030
-
(KILO TONS)\r\nAutomotive & Transportation 2019 2020 2021 2030 CAGR (2022-2030)\r\nGearbox
-
564.83 592.61 1,158.85 7.74%\r\nWheels 352.66 329.26 344.61 660.12
-
%\r\nEngine Blocks 468.89 435.95 454.39 839.52 7.06%\r\nCylinder
-
Head 747.39 689.69 713.45 1,229.57 6.23%\r\nExhaust Manifold 190.50 176.00
-
317.72 6.37%\r\nSeat Frame 246.69 228.76 237.81 429.19 6.78%\r\nOthers
-
439.23 455.70 807.50 6.56%\r\nTotal 3,084.20 2,863.72 2,980.85 5,442.45
-
%\r\nSource: Indiana Cast Metal Association (INCMA), American Foundry
-
Society (AFS), The North American Die Casting Association, NON-FERROUS FOUNDERS’
-
SOCIETY, Aluminium Casters’ Association of India, Casting Industry Suppliers
-
Association, International Trade Centre, World Trade Centre, Government Websites,
-
Press Releases, Journals, Annual Reports, Whitepapers, Company Websites, and MRFR
-
Analysis\r\nThe cylinder head segment dominated the market with a share of
-
%, accounting for 689.69 kilo tons in 2020; it is projected to exhibit a CAGR
-
of 6.23%. The Gearbox segment was the second-largest with a share of 19.72% in 2020,
-
sized at 564.83 kilo tons; it is projected to exhibit the highest CAGR of 7.74%.\r\nTABLE
-
MIDDLE EAST & AFRICA: METAL CASTING MARKET, BY EQUIPMENT & MACHINE,
-
2030 (USD MILLION)\r\nEquipment & Machine 2019 2020 2021 2030 CAGR
-
(2022-2030)\r\nPumps & Valves 1,561.17 1,453.51 1,522.74 2,958.87 7.66%\r\nOthers
-
,250.78 1,169.28 1,229.97 2,478.95 8.10%\r\nTotal 2,811.96 2,622.79 2,752.71
-
,437.82 7.86%\r\nSource: Indiana Cast Metal Association (INCMA), American
-
Foundry Society (AFS), The North American Die Casting Association, NON-FERROUS FOUNDERS’
-
SOCIETY, Aluminium Casters’ Association of India, Casting Industry Suppliers
-
Association, International Trade Centre, World Trade Centre, Government Websites,
-
Press Releases, Journals, Annual Reports, Whitepapers, Company Websites, and MRFR
-
Analysis\r\nThe pumps & valves segment accounted for a larger market
-
share of 55.42% in 2020, with a market value of USD 1,453.5 million; it is expected
-
to register a CAGR of 7.66% during the forecast period. The Others segment was valued
-
at USD 1,169.3 million; it is projected to register a higher CAGR of 8.10%.\r\n \r\nTABLE
-
MIDDLE EAST & AFRICA: METAL CASTING MARKET, BY EQUIPMENT & MACHINE,
-
2030 (KILO TONS)\r\nEquipment & Machine 2019 2020 2021 2030 CAGR
-
(2022-2030)\r\nPumps & Valves 622.39 575.03 595.59 1,040.43 6.39%\r\nOthers
-
452.03 470.12 852.23 6.83%\r\nTotal 1,109.64 1,027.06 1,065.71 1,892.67
-
%\r\nSource: Indiana Cast Metal Association (INCMA), American Foundry
-
Society (AFS), The North American Die Casting Association, NON-FERROUS FOUNDERS’
-
SOCIETY, Aluminium Casters’ Association of India, Casting Industry Suppliers
-
Association, International Trade Centre, World Trade Centre, Government Websites,
-
Press Releases, Journals, Annual Reports, Whitepapers, Company Websites, and MRFR
-
Analysis\r\nThe pumps & valves segment dominated the market with a share
-
of 55.99%, accounting for 575.03 kilo tons in 2020; it is projected to exhibit a
-
CAGR of 6.39%. The Others segment accounted for a share of 44.01% in 2020, sized
-
at 452.03 kilo tons; it is projected to exhibit a higher CAGR of 6.83%.\r\n9.2.1
-
GCC COUNTRIES\r\nTABLE 325 GCC COUNTRIES: METAL CASTING MARKET, BY MATERIAL
-
TYPE, 2022-2030 (USD MILLION)\r\nMaterial Type 2019 2020 2021 2030 CAGR (2022-2030)\r\nCast
-
Iron 4,137.69 3,844.25 4,018.86 7,659.59 7.43%\r\nAluminium 1,823.06 1,717.02
-
,819.48 3,901.89 8.85%\r\nStainless Steel 714.51 673.29 713.83 1,537.07
-
%\r\nZinc 362.96 339.12 356.53 715.02 8.04%\r\nMagnesium 271.53
-
264.83 514.50 7.66%\r\nCarbon Steel 117.54 108.06 111.76 191.60 6.17%\r\nHigh
-
Steel Alloy 221.63 205.61 214.63 403.41 7.26%\r\nOthers 520.52 475.97 489.57
-
5.47%\r\nTotal 8,169.44 7,616.12 7,989.48 15,713.73 7.81%\r\nSource:
-
Indiana Cast Metal Association (INCMA), American Foundry Society (AFS), The North
-
American Die Casting Association, NON-FERROUS FOUNDERS’ SOCIETY, Aluminium
-
Casters’ Association of India, Casting Industry Suppliers Association, International
-
Trade Centre, World Trade Centre, Government Websites, Press Releases, Journals,
-
Annual Reports, Whitepapers, Company Websites, and MRFR Analysis\r\nThe cast
-
iron segment accounted for the largest market share of 50.48% in 2020, with a market
-
value of USD 3,844.2 million; it is expected to register a CAGR of 7.43% during
-
the forecast period. The aluminium segment accounted for the second largest market
-
share in 2020, valued at USD 1,717.0 million; it is projected to exhibit a CAGR
-
of 8.85%. However, the stainless steel segment is expected to register the highest
-
CAGR of 7.43%.\r\n \r\nTABLE 326 GCC COUNTRIES: METAL CASTING
-
MARKET, BY MATERIAL TYPE, 2022-2030 (KILO TONS)\r\nMaterial Type 2019 2020
-
2030 CAGR (2022-2030)\r\nCast Iron 1,654.64 1,525.58 1,576.84 2,702.82
-
%\r\nAluminium 714.00 667.34 699.17 1,348.46 7.57%\r\nStainless
-
Steel 266.12 248.86 260.86 505.16 7.62%\r\nZinc 139.28 129.14 134.24 242.11
-
%\r\nMagnesium 103.57 95.69 99.11 173.16 6.40%\r\nCarbon Steel
-
42.66 43.62 67.25 4.93%\r\nHigh Steel Alloy 87.70 80.74 83.33 140.87
-
%\r\nOthers 208.15 188.89 192.09 278.99 4.23%\r\nTotal 3,220.23
-
,978.90 3,089.26 5,458.83 6.53%\r\nSource: Indiana Cast Metal Association
-
(INCMA), American Foundry Society (AFS), The North American Die Casting Association,
-
NON-FERROUS FOUNDERS’ SOCIETY, Aluminium Casters’ Association of India,
-
Casting Industry Suppliers Association, International Trade Centre, World Trade
-
Centre, Government Websites, Press Releases, Journals, Annual Reports, Whitepapers,
-
Company Websites, and MRFR Analysis\r\nThe cast iron segment dominated the
-
market with a share of 51.21%, accounting for 1,525.58 kilo tons in 2020 and is
-
projected to register a CAGR of 6.17%. The aluminium segment was the second-largest
-
with a share of 22.40% in 2020, sized at 667.34 kilo tons; it is projected to exhibit
-
a CAGR of 7.57%. However, the stainless steel segment is expected to register the
-
highest CAGR of 7.62%.\r\nTABLE 327 GCC COUNTRIES: METAL CASTING MARKET,
-
BY PROCESS TYPE, 2022-2030 (USD MILLION)\r\nProcess Type 2019 2020 2021 2030
-
CAGR (2022-2030)\r\nSand Casting 4,129.08 3,859.27 4,058.79 8,165.56 8.08%\r\nDie
-
Casting 1,880.79 1,765.47 1,864.67 3,891.17 8.52%\r\nShell Mold Casting 677.45
-
656.08 1,233.38 7.27%\r\nGravity Casting 365.70 330.62 336.02 469.68
-
%\r\nVacuum Casting 193.49 175.52 179.04 262.08 4.32%\r\nInvestment
-
Casting 523.54 487.24 510.25 988.03 7.62%\r\nOthers 399.39 369.50 384.63
-
6.94%\r\nTotal 8,169.44 7,616.12 7,989.48 15,713.73 7.81%\r\nSource:
-
Indiana Cast Metal Association (INCMA), American Foundry Society (AFS), The North
-
American Die Casting Association, NON-FERROUS FOUNDERS’ SOCIETY, Aluminium
-
Casters’ Association of India, Casting Industry Suppliers Association, International
-
Trade Centre, World Trade Centre, Government Websites, Press Releases, Journals,
-
Annual Reports, Whitepapers, Company Websites, and MRFR Analysis\r\nThe sand
-
casting segment accounted for the largest market share of 50.67% in 2020, with a
-
market value of USD 3,859.3 million; it is expected to register a CAGR of 8.08%
-
during the forecast period. The die casting segment accounted for the second largest
-
market share in 2020, valued at USD 1,765.5 million; it is projected to register
-
the highest CAGR of 8.52%.\r\n \r\nTABLE 328 GCC COUNTRIES: METAL
-
CASTING MARKET, BY PROCESS TYPE, 2022-2030 (KILO TONS)\r\nProcess Type 2019
-
2021 2030 CAGR (2022-2030)\r\nSand Casting 1,686.71 1,564.48 1,626.76
-
,943.32 6.81%\r\nDie Casting 736.61 686.18 716.54 1,344.75 7.25%\r\nShell
-
Mold Casting 270.91 249.42 257.42 435.22 6.01%\r\nGravity Casting 138.93
-
125.25 157.45 2.57%\r\nVacuum Casting 72.06 64.88 65.43 86.13 3.10%\r\nInvestment
-
Casting 200.90 185.55 192.11 334.56 6.36%\r\nOthers 114.10 103.77 105.76
-
4.52%\r\nTotal 3,220.23 2,978.90 3,089.26 5,458.83 6.53%\r\nSource:
-
Indiana Cast Metal Association (INCMA), American Foundry Society (AFS), The North
-
American Die Casting Association, NON-FERROUS FOUNDERS’ SOCIETY, Aluminium
-
Casters’ Association of India, Casting Industry Suppliers Association, International
-
Trade Centre, World Trade Centre, Government Websites, Press Releases, Journals,
-
Annual Reports, Whitepapers, Company Websites, and MRFR Analysis\r\nThe sand
-
casting segment dominated the market with a share of 52.52%, accounting for 1,564.48
-
kilo tons in 2020; it is projected to exhibit a CAGR of 6.81%. The die casting segment
-
was the second-largest with a share of 23.03% in 2020, sized at 686.18 kilo tons;
-
it is projected to exhibit the highest CAGR of 7.25%.\r\nTABLE 329 GCC COUNTRIES:
-
METAL CASTING MARKET, BY END-USE INDUSTRY, 2022-2030 (USD MILLION)\r\nEnd-use
-
Industry 2019 2020 2021 2030 CAGR (2022-2030)\r\nAutomotive & Transportation
-
,231.29 3,024.10 3,184.59 6,479.87 8.21%\r\nBuilding & Construction
-
,483.98 1,381.79 1,447.78 2,816.46 7.67%\r\nMining 894.11 828.81 864.47
-
,612.35 7.17%\r\nEquipment & Machine 1,120.54 1,045.29 1,097.22 2,170.03
-
%\r\nConsumer Goods 811.59 754.19 788.61 1,505.93 7.45%\r\nOthers
-
581.93 606.81 1,129.09 7.14%\r\nTotal 8,169.44 7,616.12 7,989.48 15,713.73
-
%\r\nSource: Indiana Cast Metal Association (INCMA), American Foundry
-
Society (AFS), The North American Die Casting Association, NON-FERROUS FOUNDERS’
-
SOCIETY, Aluminium Casters’ Association of India, Casting Industry Suppliers
-
Association, International Trade Centre, World Trade Centre, Government Websites,
-
Press Releases, Journals, Annual Reports, Whitepapers, Company Websites, and MRFR
-
Analysis\r\nThe automotive & transportation segment accounted for the
-
largest market share of 39.71% in 2020, with a market value of USD 3,024.1 million;
-
it is expected to register the highest CAGR of 8.21% during the forecast period.
-
The building & construction segment accounted for the second largest market
-
share in 2020, valued at USD 1,381.8 million; it is projected to exhibit a CAGR
-
of 7.67%.\r\n \r\nTABLE 330 GCC COUNTRIES: METAL CASTING MARKET,
-
BY END-USE INDUSTRY, 2022-2030 (KILO TONS)\r\nEnd-use Industry 2019 2020
-
2030 CAGR (2022-2030)\r\nAutomotive & Transportation 1,292.18 1,200.11
-
,249.51 2,286.53 6.94%\r\nBuilding & Construction 587.25 542.65 562.13
-
6.41%\r\nMining 346.61 318.84 328.80 551.53 5.92%\r\nEquipment
-
& Machine 438.86 406.27 421.63 749.94 6.61%\r\nConsumer Goods 311.44
-
296.92 509.92 6.19%\r\nOthers 243.90 223.83 230.27 377.42 5.64%\r\nTotal
-
,220.23 2,978.90 3,089.26 5,458.83 6.53%\r\nSource: Indiana Cast Metal Association
-
(INCMA), American Foundry Society (AFS), The North American Die Casting Association,
-
NON-FERROUS FOUNDERS’ SOCIETY, Aluminium Casters’ Association of India,
-
Casting Industry Suppliers Association, International Trade Centre, World Trade
-
Centre, Government Websites, Press Releases, Journals, Annual Reports, Whitepapers,
-
Company Websites, and MRFR Analysis\r\nThe automotive & transportation
-
segment dominated the market with a share of 40.29%, accounting for 1,200.11 kilo
-
tons in 2020; it is expected to register the highest CAGR of 6.94% from 2021 to
-
The building & construction segment was the second-largest with a share
-
of 18.22% in 2020, sized at 542.65 kilo tons; it is projected to exhibit a CAGR
-
of 6.41%.\r\nTABLE 331 GCC COUNTRIES: METAL CASTING MARKET, BY AUTOMOTIVE
-
& TRANSPORTATION, 2022-2030 (USD MILLION)\r\nAutomotive & Transportation
-
2020 2021 2030 CAGR (2022-2030)\r\nGearbox 621.21 585.97 621.91 1,354.08
-
%\r\nWheels 336.42 316.63 335.30 716.55 8.80%\r\nEngine Blocks
-
455.59 480.38 988.65 8.35%\r\nCylinder Head 712.91 662.80 693.34 1,325.92
-
%\r\nExhaust Manifold 187.82 174.88 183.21 355.48 7.64%\r\nSeat
-
Frame 262.63 245.49 258.20 519.55 8.08%\r\nOthers 624.12 582.75 612.25 1,219.65
-
%\r\nTotal 3,231.29 3,024.10 3,184.59 6,479.87 8.21%\r\nSource:
-
Indiana Cast Metal Association (INCMA), American Foundry Society (AFS), The North
-
American Die Casting Association, NON-FERROUS FOUNDERS’ SOCIETY, Aluminium
-
Casters’ Association of India, Casting Industry Suppliers Association, International
-
Trade Centre, World Trade Centre, Government Websites, Press Releases, Journals,
-
Annual Reports, Whitepapers, Company Websites, and MRFR Analysis\r\nThe cylinder
-
head segment accounted for the largest market share of 21.92% in 2020, with a market
-
value of USD 662.8 million; it is expected to register a CAGR of 7.47% during the
-
forecast period. The gearbox segment accounted for the second largest market share
-
in 2020, valued at USD 586.0 million; it is projected to register the highest CAGR
-
of 9.03%.\r\n \r\nTABLE 332 GCC COUNTRIES: METAL CASTING MARKET,
-
BY AUTOMOTIVE & TRANSPORTATION, 2022-2030 (KILO TONS)\r\nAutomotive &
-
Transportation 2019 2020 2021 2030 CAGR (2022-2030)\r\nGearbox 261.49 244.78
-
502.96 7.75%\r\nWheels 137.28 128.22 134.24 258.01 7.53%\r\nEngine
-
Blocks 202.52 188.33 196.33 363.40 7.08%\r\nCylinder Head 293.91 271.16 280.45
-
6.21%\r\nExhaust Manifold 75.87 70.10 72.61 126.70 6.38%\r\nSeat
-
Frame 105.03 97.42 101.31 183.33 6.81%\r\nOthers 216.09 200.09 207.70 369.79
-
%\r\nTotal 1,292.18 1,200.11 1,249.51 2,286.53 6.94%\r\nSource:
-
Indiana Cast Metal Association (INCMA), American Foundry Society (AFS), The North
-
American Die Casting Association, NON-FERROUS FOUNDERS’ SOCIETY, Aluminium
-
Casters’ Association of India, Casting Industry Suppliers Association, International
-
Trade Centre, World Trade Centre, Government Websites, Press Releases, Journals,
-
Annual Reports, Whitepapers, Company Websites, and MRFR Analysis\r\nThe cylinder
-
head segment dominated the market with a share of 22.60%, accounting for 271.16
-
kilo tons in 2020; it is projected to exhibit a CAGR of 6.21%. The Gearbox segment
-
was the second-largest with a share of 20.40% in 2020, sized at 244.78 kilo tons;
-
it is projected to exhibit the highest CAGR of 7.75%.\r\nTABLE 333 GCC COUNTRIES:
-
METAL CASTING MARKET, BY EQUIPMENT & MACHINE, 2022-2030 (USD MILLION)\r\nEquipment
-
& Machine 2019 2020 2021 2030 CAGR (2022-2030)\r\nPumps & Valves
-
569.45 596.65 1,160.70 7.67%\r\nOthers 508.99 475.84 500.57 1,009.34
-
%\r\nTotal 1,120.54 1,045.29 1,097.22 2,170.03 7.87%\r\nSource:
-
Indiana Cast Metal Association (INCMA), American Foundry Society (AFS), The North
-
American Die Casting Association, NON-FERROUS FOUNDERS’ SOCIETY, Aluminium
-
Casters’ Association of India, Casting Industry Suppliers Association, International
-
Trade Centre, World Trade Centre, Government Websites, Press Releases, Journals,
-
Annual Reports, Whitepapers, Company Websites, and MRFR Analysis\r\nThe pumps
-
& valves segment accounted for a larger market share of 54.48% in 2020, with
-
a market value of USD 569.5 million; it is expected to register a CAGR of 7.67%
-
during the forecast period. The Others segment was valued at USD 475.8 million;
-
it is projected to register a higher CAGR of 8.10%.\r\n \r\nTABLE
-
GCC COUNTRIES: METAL CASTING MARKET, BY EQUIPMENT & MACHINE, 2022-2030 (KILO
-
TONS)\r\nEquipment & Machine 2019 2020 2021 2030 CAGR (2022-2030)\r\nPumps
-
& Valves 241.93 223.56 231.59 405.18 6.41%\r\nOthers 196.93 182.71 190.04
-
6.84%\r\nTotal 438.86 406.27 421.63 749.94 6.61%\r\nSource:
-
Indiana Cast Metal Association (INCMA), American Foundry Society (AFS), The North
-
American Die Casting Association, NON-FERROUS FOUNDERS’ SOCIETY, Aluminium
-
Casters’ Association of India, Casting Industry Suppliers Association, International
-
Trade Centre, World Trade Centre, Government Websites, Press Releases, Journals,
-
Annual Reports, Whitepapers, Company Websites, and MRFR Analysis\r\nThe pumps
-
& valves segment dominated the market with a share of 55.03%, accounting for
-
kilo tons in 2020; it is projected to exhibit a CAGR of 6.41%. The Others
-
segment accounted for a share of 44.97% in 2020, sized at 182.71 kilo tons; it is
-
projected to exhibit a higher CAGR of 6.84%.\r\n9.2.2 SOUTH AFRICA\r\nTABLE
-
SOUTH AFRICA: METAL CASTING MARKET, BY MATERIAL TYPE, 2022-2030 (USD MILLION)\r\nMaterial
-
Type 2019 2020 2021 2030 CAGR (2022-2030)\r\nCast Iron 1,012.94 937.30 975.91
-
,792.05 6.99%\r\nAluminium 391.83 367.89 388.62 808.81 8.48%\r\nStainless
-
Steel 174.77 163.95 173.03 357.63 8.40%\r\nZinc 90.65 84.33 88.28 170.23
-
%\r\nMagnesium 63.26 58.65 61.19 114.39 7.20%\r\nCarbon Steel
-
28.79 29.70 49.85 5.92%\r\nHigh Steel Alloy 54.26 50.14 52.13 94.45
-
%\r\nOthers 114.85 104.44 106.82 163.30 4.83%\r\nTotal 1,933.96
-
,795.50 1,875.68 3,550.70 7.35%\r\nSource: Indiana Cast Metal Association
-
(INCMA), American Foundry Society (AFS), The North American Die Casting Association,
-
NON-FERROUS FOUNDERS’ SOCIETY, Aluminium Casters’ Association of India,
-
Casting Industry Suppliers Association, International Trade Centre, World Trade
-
Centre, Government Websites, Press Releases, Journals, Annual Reports, Whitepapers,
-
Company Websites, and MRFR Analysis\r\nThe cast iron segment accounted for
-
the largest market share of 52.20% in 2020, with a market value of USD 937.3 million;
-
it is expected to register a CAGR of 6.99% during the forecast period. The aluminium
-
segment accounted for the second largest market share in 2020, valued at USD 367.9
-
million; it is projected to register the highest CAGR of 8.48%.\r\n \r\nTABLE
-
SOUTH AFRICA: METAL CASTING MARKET, BY MATERIAL TYPE, 2022-2030 (KILO TONS)\r\nMaterial
-
Type 2019 2020 2021 2030 CAGR (2022-2030)\r\nCast Iron 413.75 379.94 391.11
-
5.73%\r\nAluminium 156.75 146.05 152.54 285.51 7.21%\r\nStainless
-
Steel 66.49 61.89 64.59 120.05 7.13%\r\nZinc 35.53 32.80 33.95 58.87 6.31%\r\nMagnesium
-
22.68 23.39 39.33 5.94%\r\nCarbon Steel 12.76 11.61 11.84 17.87 4.68%\r\nHigh
-
Steel Alloy 21.93 20.11 20.67 33.69 5.57%\r\nOthers 46.91 42.34 42.81 58.86
-
%\r\nTotal 778.77 717.42 740.90 1,260.08 6.08%\r\nSource: Indiana
-
Cast Metal Association (INCMA), American Foundry Society (AFS), The North American
-
Die Casting Association, NON-FERROUS FOUNDERS’ SOCIETY, Aluminium Casters’
-
Association of India, Casting Industry Suppliers Association, International Trade
-
Centre, World Trade Centre, Government Websites, Press Releases, Journals, Annual
-
Reports, Whitepapers, Company Websites, and MRFR Analysis\r\nThe cast iron
-
segment dominated the market with a share of 52.96%, accounting for 379.94 kilo
-
tons in 2020; it is projected to exhibit a CAGR of 5.73%. The aluminium segment
-
was the second-largest with a share of 20.36% in 2020, sized at 146.05 kilo tons;
-
it is projected to exhibit the highest CAGR of 7.21%.\r\nTABLE 337 SOUTH
-
AFRICA: METAL CASTING MARKET, BY PROCESS TYPE, 2022-2030 (USD MILLION)\r\nProcess
-
Type 2019 2020 2021 2030 CAGR (2022-2030)\r\nSand Casting 916.94 853.62 894.17
-
,734.09 7.64%\r\nDie Casting 452.39 422.85 444.70 892.38 8.05%\r\nShell
-
Mold Casting 156.61 144.67 150.37 271.79 6.80%\r\nGravity Casting 125.19
-
116.33 176.93 4.77%\r\nVacuum Casting 64.03 58.30 59.70 92.64 5.00%\r\nInvestment
-
Casting 102.88 95.32 99.37 184.65 7.13%\r\nOthers 115.92 106.95 111.03 198.23
-
%\r\nTotal 1,933.96 1,795.50 1,875.68 3,550.70 7.35%\r\nSource:
-
Indiana Cast Metal Association (INCMA), American Foundry Society (AFS), The North
-
American Die Casting Association, NON-FERROUS FOUNDERS’ SOCIETY, Aluminium
-
Casters’ Association of India, Casting Industry Suppliers Association, International
-
Trade Centre, World Trade Centre, Government Websites, Press Releases, Journals,
-
Annual Reports, Whitepapers, Company Websites, and MRFR Analysis\r\nThe sand
-
casting segment accounted for the largest market share of 47.54% in 2020, with a
-
market value of USD 853.6 million; it is expected to register a CAGR of 7.64% during
-
the forecast period. The die casting segment accounted for the second largest market
-
share in 2020, valued at USD 422.8 million; it is projected to register the highest
-
CAGR of 8.05%.\r\n \r\nTABLE 338 SOUTH AFRICA: METAL CASTING
-
MARKET, BY PROCESS TYPE, 2022-2030 (KILO TONS)\r\nProcess Type 2019 2020
-
2030 CAGR (2022-2030)\r\nSand Casting 382.59 353.46 366.06 638.46 6.38%\r\nDie
-
Casting 180.98 167.87 174.55 315.01 6.78%\r\nShell Mold Casting 63.97 58.64
-
97.96 5.55%\r\nGravity Casting 48.58 43.82 44.29 60.58 3.54%\r\nVacuum
-
Casting 24.36 22.01 22.29 31.10 3.77%\r\nInvestment Casting 40.33 37.08 38.22
-
5.87%\r\nOthers 37.97 34.55 35.23 53.12 4.67%\r\nTotal 778.77
-
740.90 1,260.08 6.08%\r\nSource: Indiana Cast Metal Association (INCMA),
-
American Foundry Society (AFS), The North American Die Casting Association, NON-FERROUS
-
FOUNDERS’ SOCIETY, Aluminium Casters’ Association of India, Casting
-
Industry Suppliers Association, International Trade Centre, World Trade Centre,
-
Government Websites, Press Releases, Journals, Annual Reports, Whitepapers, Company
-
Websites, and MRFR Analysis\r\nThe sand casting segment dominated the market
-
with a share of 49.27%, accounting for 353.46 kilo tons in 2020; it is projected
-
to exhibit a CAGR of 6.38%. The die casting segment was the second-largest with
-
a share of 23.40% in 2020, sized at 167.87 kilo tons; it is projected to exhibit
-
the highest CAGR of 6.78%.\r\nTABLE 339 SOUTH AFRICA: METAL CASTING MARKET,
-
BY END-USE INDUSTRY, 2022-2030 (USD MILLION)\r\nEnd-use Industry 2019 2020
-
2030 CAGR (2022-2030)\r\nAutomotive & Transportation 767.18 715.01
-
1,468.31 7.75%\r\nBuilding & Construction 332.13 307.96 321.30
-
7.21%\r\nMining 209.04 192.95 200.40 359.51 6.71%\r\nEquipment
-
& Machine 297.53 276.38 288.88 549.51 7.41%\r\nConsumer Goods 215.30
-
207.61 382.78 7.03%\r\nOthers 112.77 103.88 107.67 189.34 6.47%\r\nTotal
-
,933.96 1,795.50 1,875.68 3,550.70 7.35%\r\nSource: Indiana Cast Metal Association
-
(INCMA), American Foundry Society (AFS), The North American Die Casting Association,
-
NON-FERROUS FOUNDERS’ SOCIETY, Aluminium Casters’ Association of India,
-
Casting Industry Suppliers Association, International Trade Centre, World Trade
-
Centre, Government Websites, Press Releases, Journals, Annual Reports, Whitepapers,
-
Company Websites, and MRFR Analysis\r\nThe automotive & transportation
-
segment accounted for the largest market share of 39.82% in 2020, with a market
-
value of USD 715.0 million; it is expected to register the highest CAGR of 7.75%
-
during the forecast period. The building & construction segment accounted for
-
the second largest market share in 2020, valued at USD 308.0 million; it is projected
-
to exhibit a CAGR of 7.21%.\r\n \r\nTABLE 340 SOUTH AFRICA: METAL
-
CASTING MARKET, BY END-USE INDUSTRY, 2022-2030 (KILO TONS)\r\nEnd-use Industry
-
2020 2021 2030 CAGR (2022-2030)\r\nAutomotive & Transportation 313.37
-
300.50 529.22 6.49%\r\nBuilding & Construction 134.25 123.53 127.43
-
5.95%\r\nMining 82.77 75.82 77.86 125.61 5.46%\r\nEquipment
-
& Machine 119.03 109.72 113.39 193.98 6.15%\r\nConsumer Goods 84.39 77.53
-
132.39 5.78%\r\nOthers 44.96 40.99 41.89 64.44 4.90%\r\nTotal
-
717.42 740.90 1,260.08 6.08%\r\nSource: Indiana Cast Metal Association
-
(INCMA), American Foundry Society (AFS), The North American Die Casting Association,
-
NON-FERROUS FOUNDERS’ SOCIETY, Aluminium Casters’ Association of India,
-
Casting Industry Suppliers Association, International Trade Centre, World Trade
-
Centre, Government Websites, Press Releases, Journals, Annual Reports, Whitepapers,
-
Company Websites, and MRFR Analysis\r\nThe automotive & transportation
-
segment dominated the market with a share of 40.40%, accounting for 289.83 kilo
-
tons in 2020; it is expected to register the highest CAGR of 6.49% from 2021 to
-
The building & construction segment was the second-largest with a share
-
of 17.22% in 2020, sized at 123.53 kilo tons; it is projected to exhibit a CAGR
-
of 5.95%.\r\nTABLE 341 SOUTH AFRICA: METAL CASTING MARKET, BY AUTOMOTIVE
-
& TRANSPORTATION, 2022-2030 (USD MILLION)\r\nAutomotive & Transportation
-
2020 2021 2030 CAGR (2022-2030)\r\nGearbox 141.13 132.62 140.21 294.66
-
%\r\nWheels 77.65 72.79 76.77 158.11 8.36%\r\nEngine Blocks 112.35
-
110.09 218.13 7.89%\r\nCylinder Head 183.61 170.08 177.27 327.91 7.07%\r\nExhaust
-
Manifold 52.51 48.72 50.87 95.70 7.27%\r\nSeat Frame 62.36 58.04 60.79 117.73
-
%\r\nOthers 137.58 127.91 133.80 256.09 7.48%\r\nTotal 767.18
-
749.81 1,468.31 7.75%\r\nSource: Indiana Cast Metal Association (INCMA),
-
American Foundry Society (AFS), The North American Die Casting Association, NON-FERROUS
-
FOUNDERS’ SOCIETY, Aluminium Casters’ Association of India, Casting
-
Industry Suppliers Association, International Trade Centre, World Trade Centre,
-
Government Websites, Press Releases, Journals, Annual Reports, Whitepapers, Company
-
Websites, and MRFR Analysis\r\nThe cylinder head segment accounted for the
-
largest market share of 23.79% in 2020, with a market value of USD 170.1 million;
-
it is expected to register a CAGR of 7.07% during the forecast period. The gearbox
-
segment accounted for the second largest market share in 2020, valued at USD 132.6
-
million; it is projected to register the highest CAGR of 8.60%.\r\nTABLE
-
SOUTH AFRICA: METAL CASTING MARKET, BY AUTOMOTIVE & TRANSPORTATION, 2022-2030
-
(KILO TONS)\r\nAutomotive & Transportation 2019 2020 2021 2030 CAGR (2022-2030)\r\nGearbox
-
56.59 59.15 111.79 7.33%\r\nWheels 32.36 30.11 31.40 58.15 7.09%\r\nEngine
-
Blocks 47.80 44.27 45.96 81.90 6.63%\r\nCylinder Head 77.32 71.07 73.24 121.84
-
%\r\nExhaust Manifold 21.66 19.95 20.59 34.84 6.02%\r\nSeat Frame
-
23.53 24.36 42.43 6.36%\r\nOthers 48.07 44.31 45.79 78.27 6.14%\r\nTotal
-
289.83 300.50 529.22 6.49%\r\nSource: Indiana Cast Metal Association
-
(INCMA), American Foundry Society (AFS), The North American Die Casting Association,
-
NON-FERROUS FOUNDERS’ SOCIETY, Aluminium Casters’ Association of India,
-
Casting Industry Suppliers Association, International Trade Centre, World Trade
-
Centre, Government Websites, Press Releases, Journals, Annual Reports, Whitepapers,
-
Company Websites, and MRFR Analysis\r\nThe cylinder head segment dominated
-
the market with a share of 24.52%, accounting for 71.07 kilo tons in 2020; it is
-
projected to exhibit a CAGR of 5.82%. The Gearbox segment was the second-largest
-
with a share of 19.52% in 2020, sized at 56.59 kilo tons; it is projected to exhibit
-
the highest CAGR of 7.33%.\r\nTABLE 343 SOUTH AFRICA: METAL CASTING MARKET,
-
BY EQUIPMENT & MACHINE, 2022-2030 (USD MILLION)\r\nEquipment & Machine
-
2020 2021 2030 CAGR (2022-2030)\r\nPumps & Valves 171.22 158.78
-
310.25 7.22%\r\nOthers 126.31 117.60 123.21 239.27 7.65%\r\nTotal
-
276.38 288.88 549.51 7.41%\r\nSource: Indiana Cast Metal Association
-
(INCMA), American Foundry Society (AFS), The North American Die Casting Association,
-
NON-FERROUS FOUNDERS’ SOCIETY, Aluminium Casters’ Association of India,
-
Casting Industry Suppliers Association, International Trade Centre, World Trade
-
Centre, Government Websites, Press Releases, Journals, Annual Reports, Whitepapers,
-
Company Websites, and MRFR Analysis\r\nThe pumps & valves segment accounted
-
for a larger market share of 57.45% in 2020, with a market value of USD 158.8 million;
-
it is expected to register a CAGR of 7.22% during the forecast period. The Others
-
segment was valued at USD 117.6 million; it is projected to register a higher CAGR
-
of 7.65%.\r\n \r\nTABLE 344 SOUTH AFRICA: METAL CASTING MARKET,
-
BY EQUIPMENT & MACHINE, 2022-2030 (KILO TONS)\r\nEquipment & Machine
-
2020 2021 2030 CAGR (2022-2030)\r\nPumps & Valves 69.19 63.67 65.68
-
5.96%\r\nOthers 49.84 46.05 47.70 83.35 6.40%\r\nTotal 119.03
-
113.39 193.98 6.15%\r\nSource: Indiana Cast Metal Association (INCMA),
-
American Foundry Society (AFS), The North American Die Casting Association, NON-FERROUS
-
FOUNDERS’ SOCIETY, Aluminium Casters’ Association of India, Casting
-
Industry Suppliers Association, International Trade Centre, World Trade Centre,
-
Government Websites, Press Releases, Journals, Annual Reports, Whitepapers, Company
-
Websites, and MRFR Analysis\r\nThe pumps & valves segment dominated the
-
market with a share of 58.03%, accounting for 63.67 kilo tons in 2020; it is projected
-
to exhibit a CAGR of 5.96%. The Others segment accounted for a share of 41.97% in
-
, sized at 46.05 kilo tons; it is projected to exhibit a higher CAGR of 6.40%.\r\n9.2.3
-
TURKEY\r\nTABLE 345 TURKEY: METAL CASTING MARKET, BY MATERIAL TYPE, 2022-2030
-
(USD MILLION)\r\nMaterial Type 2019 2020 2021 2030 CAGR (2022-2030)\r\nCast
-
Iron 3,402.81 3,170.73 3,324.41 6,501.32 7.74%\r\nAluminium 1,383.93 1,308.36
-
,391.63 3,083.02 9.24%\r\nStainless Steel 735.45 693.54 735.87 1,597.70
-
%\r\nZinc 330.03 309.19 325.93 669.40 8.33%\r\nMagnesium 219.60
-
215.42 429.35 7.96%\r\nCarbon Steel 154.82 143.50 149.64 277.94 7.12%\r\nHigh
-
Steel Alloy 199.68 185.86 194.66 376.93 7.62%\r\nOthers 299.48 272.37 278.51
-
4.56%\r\nTotal 6,725.80 6,288.59 6,616.08 13,351.85 8.11%\r\nSource:
-
Indiana Cast Metal Association (INCMA), American Foundry Society (AFS), The North
-
American Die Casting Association, NON-FERROUS FOUNDERS’ SOCIETY, Aluminium
-
Casters’ Association of India, Casting Industry Suppliers Association, International
-
Trade Centre, World Trade Centre, Government Websites, Press Releases, Journals,
-
Annual Reports, Whitepapers, Company Websites, and MRFR Analysis\r\nThe cast
-
iron segment accounted for the largest market share of 50.42% in 2020, with a market
-
value of USD 3,170.7 million; it is expected to register a CAGR of 7.74% during
-
the forecast period. The aluminium segment accounted for the second largest market
-
share in 2020, valued at USD 1,308.4 million; it is projected to register the highest
-
CAGR of 9.24%.\r\n \r\nTABLE 346 TURKEY: METAL CASTING MARKET,
-
BY MATERIAL TYPE, 2022-2030 (KILO TONS)\r\nMaterial Type 2019 2020 2021 2030
-
CAGR (2022-2030)\r\nCast Iron 1,362.13 1,259.55 1,305.67 2,296.39 6.47%\r\nAluminium
-
509.02 535.30 1,066.53 7.96%\r\nStainless Steel 274.19 256.60 269.18
-
7.72%\r\nZinc 126.77 117.86 122.84 226.89 7.06%\r\nMagnesium
-
77.69 80.70 144.65 6.70%\r\nCarbon Steel 61.65 56.70 58.47 97.66 5.87%\r\nHigh
-
Steel Alloy 79.10 73.06 75.66 131.75 6.36%\r\nOthers 119.88 108.20 109.39
-
3.34%\r\nTotal 2,650.13 2,458.69 2,557.20 4,636.49 6.84%\r\nSource:
-
Indiana Cast Metal Association (INCMA), American Foundry Society (AFS), The North
-
American Die Casting Association, NON-FERROUS FOUNDERS’ SOCIETY, Aluminium
-
Casters’ Association of India, Casting Industry Suppliers Association, International
-
Trade Centre, World Trade Centre, Government Websites, Press Releases, Journals,
-
Annual Reports, Whitepapers, Company Websites, and MRFR Analysis\r\nThe cast
-
iron segment dominated the market with a share of 51.23%, accounting for 1,259.55
-
kilo tons in 2020; it is projected to exhibit a CAGR of 6.47%. The aluminium segment
-
was the second-largest with a share of 20.70% in 2020, sized at 509.02 kilo tons;
-
it is projected to exhibit the highest CAGR of 7.96%.\r\nTABLE 347 TURKEY:
-
METAL CASTING MARKET, BY PROCESS TYPE, 2022-2030 (USD MILLION)\r\nProcess
-
Type 2019 2020 2021 2030 CAGR (2022-2030)\r\nSand Casting 3,249.73 3,046.62
-
,213.84 6,641.15 8.40%\r\nDie Casting 1,672.06 1,573.30 1,665.68 3,551.09
-
%\r\nShell Mold Casting 473.78 440.46 460.74 881.61 7.48%\r\nGravity
-
Casting 405.08 370.23 380.56 605.56 5.30%\r\nVacuum Casting 274.12 252.28
-
450.47 6.24%\r\nInvestment Casting 425.92 397.55 417.52 829.44 7.93%\r\nOthers
-
208.15 216.54 392.52 6.83%\r\nTotal 6,725.80 6,288.59 6,616.08 13,351.85
-
%\r\nSource: Indiana Cast Metal Association (INCMA), American Foundry
-
Society (AFS), The North American Die Casting Association, NON-FERROUS FOUNDERS’
-
SOCIETY, Aluminium Casters’ Association of India, Casting Industry Suppliers
-
Association, International Trade Centre, World Trade Centre, Government Websites,
-
Press Releases, Journals, Annual Reports, Whitepapers, Company Websites, and MRFR
-
Analysis\r\nThe sand casting segment accounted for the largest market share
-
of 48.45% in 2020, with a market value of USD 3,046.6 million; it is expected to
-
register a CAGR of 8.40% during the forecast period. The die casting segment accounted
-
for the second largest market share in 2020, valued at USD 1,573.3 million; it is
-
projected to register the highest CAGR of 8.78%.\r\n \r\nTABLE
-
TURKEY: METAL CASTING MARKET, BY PROCESS TYPE, 2022-2030 (KILO TONS)\r\nProcess
-
Type 2019 2020 2021 2030 CAGR (2022-2030)\r\nSand Casting 1,328.83 1,236.28
-
,289.39 2,396.23 7.13%\r\nDie Casting 655.52 612.10 640.71 1,228.45 7.50%\r\nShell
-
Mold Casting 189.65 174.97 180.96 311.40 6.22%\r\nGravity Casting 154.04
-
141.99 203.20 4.06%\r\nVacuum Casting 102.20 93.34 95.54 148.20 5.00%\r\nInvestment
-
Casting 163.61 151.54 157.36 281.14 6.66%\r\nOthers 56.28 50.74 51.24 67.87
-
%\r\nTotal 2,650.13 2,458.69 2,557.20 4,636.49 6.84%\r\nSource:
-
Indiana Cast Metal Association (INCMA), American Foundry Society (AFS), The North
-
American Die Casting Association, NON-FERROUS FOUNDERS’ SOCIETY, Aluminium
-
Casters’ Association of India, Casting Industry Suppliers Association, International
-
Trade Centre, World Trade Centre, Government Websites, Press Releases, Journals,
-
Annual Reports, Whitepapers, Company Websites, and MRFR Analysis\r\nThe sand
-
casting segment dominated the market with a share of 50.28%, accounting for 1,236.28
-
kilo tons in 2020; it is projected to exhibit a CAGR of 7.13%. The die casting segment
-
was the second-largest with a share of 24.90% in 2020, sized at 612.10 kilo tons;
-
it is projected to exhibit the highest CAGR of 7.50%.\r\nTABLE 349 TURKEY:
-
METAL CASTING MARKET, BY END-USE INDUSTRY, 2022-2030 (USD MILLION)\r\nEnd-use
-
Industry 2019 2020 2021 2030 CAGR (2022-2030)\r\nAutomotive & Transportation
-
,722.81 2,555.43 2,698.62 5,629.56 8.51%\r\nBuilding & Construction
-
,266.02 1,182.34 1,242.46 2,480.97 7.99%\r\nMining 701.64 652.12 681.98
-
,301.77 7.45%\r\nEquipment & Machine 1,069.83 1,000.80 1,053.47 2,135.90
-
%\r\nConsumer Goods 570.25 531.19 556.75 1,085.50 7.70%\r\nOthers
-
366.71 382.81 718.14 7.24%\r\nTotal 6,725.80 6,288.59 6,616.08 13,351.85
-
%\r\nSource: Indiana Cast Metal Association (INCMA), American Foundry
-
Society (AFS), The North American Die Casting Association, NON-FERROUS FOUNDERS’
-
SOCIETY, Aluminium Casters’ Association of India, Casting Industry Suppliers
-
Association, International Trade Centre, World Trade Centre, Government Websites,
-
Press Releases, Journals, Annual Reports, Whitepapers, Company Websites, and MRFR
-
Analysis\r\nThe automotive & transportation segment accounted for the
-
largest market share of 40.64% in 2020, with a market value of USD 2,555.4 million;
-
it is expected to register the highest CAGR of 8.51% during the forecast period.
-
The building & construction segment accounted for the second largest market
-
share in 2020, valued at USD 1,182.3 million; it is projected to exhibit a CAGR
-
of 7.99%.\r\n \r\nTABLE 350 TURKEY: METAL CASTING MARKET, BY
-
END-USE INDUSTRY, 2022-2030 (KILO TONS)\r\nEnd-use Industry 2019 2020 2021
-
CAGR (2022-2030)\r\nAutomotive & Transportation 1,089.93 1,015.13
-
,059.89 1,988.47 7.24%\r\nBuilding & Construction 501.50 464.78 482.90
-
6.72%\r\nMining 272.26 251.12 259.65 445.74 6.19%\r\nEquipment
-
& Machine 419.42 389.37 405.22 738.89 6.90%\r\nConsumer Goods 219.05
-
209.83 367.93 6.44%\r\nOthers 147.97 135.80 139.71 228.27 5.61%\r\nTotal
-
,650.13 2,458.69 2,557.20 4,636.49 6.84%\r\nSource: Indiana Cast Metal Association
-
(INCMA), American Foundry Society (AFS), The North American Die Casting Association,
-
NON-FERROUS FOUNDERS’ SOCIETY, Aluminium Casters’ Association of India,
-
Casting Industry Suppliers Association, International Trade Centre, World Trade
-
Centre, Government Websites, Press Releases, Journals, Annual Reports, Whitepapers,
-
Company Websites, and MRFR Analysis\r\nThe automotive & transportation
-
segment dominated the market with a share of 41.29%, accounting for 1,015.13 kilo
-
tons in 2020; it is expected to register the highest CAGR of 7.24% from 2021 to
-
The building & construction segment was the second-largest with a share
-
of 18.90% in 2020, sized at 464.78 kilo tons; it is projected to exhibit a CAGR
-
of 6.72%.\r\nTABLE 351 TURKEY: METAL CASTING MARKET, BY AUTOMOTIVE &
-
TRANSPORTATION, 2022-2030 (USD MILLION)\r\nAutomotive & Transportation
-
2020 2021 2030 CAGR (2022-2030)\r\nGearbox 467.98 443.10 472.03 1,061.71
-
%\r\nWheels 350.62 330.57 350.68 761.34 9.00%\r\nEngine Blocks
-
365.34 386.33 815.65 8.66%\r\nCylinder Head 678.48 633.05 664.60 1,312.69
-
%\r\nExhaust Manifold 165.24 154.32 162.16 323.24 7.97%\r\nSeat
-
Frame 212.73 199.40 210.30 433.64 8.37%\r\nOthers 459.01 429.65 452.52 921.29
-
%\r\nTotal 2,722.81 2,555.43 2,698.62 5,629.56 8.51%\r\nSource:
-
Indiana Cast Metal Association (INCMA), American Foundry Society (AFS), The North
-
American Die Casting Association, NON-FERROUS FOUNDERS’ SOCIETY, Aluminium
-
Casters’ Association of India, Casting Industry Suppliers Association, International
-
Trade Centre, World Trade Centre, Government Websites, Press Releases, Journals,
-
Annual Reports, Whitepapers, Company Websites, and MRFR Analysis\r\nThe cylinder
-
head segment accounted for the largest market share of 24.77% in 2020, with a market
-
value of USD 633.1 million; it is expected to register a CAGR of 7.86% during the
-
forecast period. The gearbox segment accounted for the second largest market share
-
in 2020, valued at USD 443.1 million; it is projected to register the highest CAGR
-
of 9.42%.\r\n \r\nTABLE 352 TURKEY: METAL CASTING MARKET, BY
-
AUTOMOTIVE & TRANSPORTATION, 2022-2030 (KILO TONS)\r\nAutomotive &
-
Transportation 2019 2020 2021 2030 CAGR (2022-2030)\r\nGearbox 197.19 185.28
-
394.75 8.14%\r\nWheels 143.22 134.00 140.54 274.41 7.72%\r\nEngine
-
Blocks 162.10 151.18 158.05 300.11 7.38%\r\nCylinder Head 279.99 259.25 269.10
-
6.59%\r\nExhaust Manifold 66.81 61.92 64.33 115.33 6.70%\r\nSeat
-
Frame 85.16 79.21 82.60 153.17 7.10%\r\nOthers 155.46 144.29 150.12 272.69
-
%\r\nTotal 1,089.93 1,015.13 1,059.89 1,988.47 7.24%\r\nSource:
-
Indiana Cast Metal Association (INCMA), American Foundry Society (AFS), The North
-
American Die Casting Association, NON-FERROUS FOUNDERS’ SOCIETY, Aluminium
-
Casters’ Association of India, Casting Industry Suppliers Association, International
-
Trade Centre, World Trade Centre, Government Websites, Press Releases, Journals,
-
Annual Reports, Whitepapers, Company Websites, and MRFR Analysis\r\nThe cylinder
-
head segment dominated the market with a share of 25.54%, accounting for 259.25
-
kilo tons in 2020; it is projected to exhibit a CAGR of 6.59%. The Gearbox segment
-
was the second-largest with a share of 18.25% in 2020, sized at 185.28 kilo tons;
-
it is projected to exhibit the highest CAGR of 8.14%.\r\nTABLE 353 TURKEY:
-
METAL CASTING MARKET, BY EQUIPMENT & MACHINE, 2022-2030 (USD MILLION)\r\nEquipment
-
& Machine 2019 2020 2021 2030 CAGR (2022-2030)\r\nPumps & Valves
-
555.73 583.93 1,164.89 7.98%\r\nOthers 474.71 445.07 469.54 971.01
-
%\r\nTotal 1,069.83 1,000.80 1,053.47 2,135.90 8.17%\r\nSource:
-
Indiana Cast Metal Association (INCMA), American Foundry Society (AFS), The North
-
American Die Casting Association, NON-FERROUS FOUNDERS’ SOCIETY, Aluminium
-
Casters’ Association of India, Casting Industry Suppliers Association, International
-
Trade Centre, World Trade Centre, Government Websites, Press Releases, Journals,
-
Annual Reports, Whitepapers, Company Websites, and MRFR Analysis\r\nThe pumps
-
& valves segment accounted for a larger market share of 55.53% in 2020, with
-
a market value of USD 555.7 million; it is expected to register a CAGR of 7.98%
-
during the forecast period. The Others segment was valued at USD 445.1 million;
-
it is projected to register a higher CAGR of 8.41%.\r\n \r\nTABLE
-
TURKEY: METAL CASTING MARKET, BY EQUIPMENT & MACHINE, 2022-2030 (KILO TONS)\r\nEquipment
-
& Machine 2019 2020 2021 2030 CAGR (2022-2030)\r\nPumps & Valves
-
218.39 226.88 407.05 6.71%\r\nOthers 183.75 170.97 178.34 331.84 7.14%\r\nTotal
-
389.37 405.22 738.89 6.90%\r\nSource: Indiana Cast Metal Association
-
(INCMA), American Foundry Society (AFS), The North American Die Casting Association,
-
NON-FERROUS FOUNDERS’ SOCIETY, Aluminium Casters’ Association of India,
-
Casting Industry Suppliers Association, International Trade Centre, World Trade
-
Centre, Government Websites, Press Releases, Journals, Annual Reports, Whitepapers,
-
Company Websites, and MRFR Analysis\r\nThe pumps & valves segment dominated
-
the market with a share of 56.09%, accounting for 218.39 kilo tons in 2020; it is
-
projected to exhibit a CAGR of 6.71%. The Others segment accounted for a share of
-
% in 2020, sized at 170.97 kilo tons; it is projected to exhibit a higher CAGR
-
of 7.14%.\r\n9.2.4 REST OF THE MIDDLE EAST & AFRICA\r\nTABLE 355
-
REST OF THE MIDDLE EAST & AFRICA: METAL CASTING MARKET, BY MATERIAL TYPE, 2022-2030
-
(USD MILLION)\r\nMaterial Type 2019 2020 2021 2030 CAGR (2022-2030)\r\nCast
-
Iron 1,186.82 1,095.42 1,137.62 2,038.91 6.70%\r\nAluminium 517.57 484.32
-
1,029.19 8.12%\r\nStainless Steel 204.37 191.33 201.51 408.16 8.16%\r\nZinc
-
106.36 111.06 209.06 7.28%\r\nMagnesium 87.69 81.12 84.43 154.44 6.94%\r\nCarbon
-
Steel 48.57 44.55 45.97 77.48 5.97%\r\nHigh Steel Alloy 68.62 63.27 65.63
-
6.57%\r\nOthers 116.71 105.45 107.14 152.35 3.99%\r\nTotal
-
,344.97 2,171.81 2,263.25 4,185.99 7.07%\r\nSource: Indiana Cast Metal Association
-
(INCMA), American Foundry Society (AFS), The North American Die Casting Association,
-
NON-FERROUS FOUNDERS’ SOCIETY, Aluminium Casters’ Association of India,
-
Casting Industry Suppliers Association, International Trade Centre, World Trade
-
Centre, Government Websites, Press Releases, Journals, Annual Reports, Whitepapers,
-
Company Websites, and MRFR Analysis\r\nThe cast iron segment accounted for
-
the largest market share of 50.44% in 2020, with a market value of USD 1,095.4 million;
-
it is expected to register a CAGR of 6.70% during the forecast period. The aluminium
-
segment accounted for the second largest market share in 2020, valued at USD 484.3
-
million; it is projected to exhibit a CAGR of 8.12%. However, the stainless steel
-
segment is expected to register the highest CAGR of 6.70%.\r\n \r\nTABLE
-
REST OF THE MIDDLE EAST & AFRICA: METAL CASTING MARKET, BY MATERIAL TYPE,
-
2030 (KILO TONS)\r\nMaterial Type 2019 2020 2021 2030 CAGR (2022-2030)\r\nCast
-
Iron 494.87 453.28 465.42 750.19 5.45%\r\nAluminium 211.36 196.28 204.31
-
6.85%\r\nStainless Steel 79.37 73.74 76.78 139.87 6.89%\r\nZinc
-
42.23 43.60 73.81 6.02%\r\nMagnesium 34.88 32.02 32.95 54.20 5.69%\r\nCarbon
-
Steel 20.15 18.34 18.71 28.36 4.73%\r\nHigh Steel Alloy 28.32 25.91 26.57
-
5.32%\r\nOthers 48.67 43.64 43.83 56.06 2.77%\r\nTotal 963.47
-
912.17 1,515.74 5.80%\r\nSource: Indiana Cast Metal Association (INCMA),
-
American Foundry Society (AFS), The North American Die Casting Association, NON-FERROUS
-
FOUNDERS’ SOCIETY, Aluminium Casters’ Association of India, Casting
-
Industry Suppliers Association, International Trade Centre, World Trade Centre,
-
Government Websites, Press Releases, Journals, Annual Reports, Whitepapers, Company
-
Websites, and MRFR Analysis\r\nThe cast iron segment dominated the market
-
with a share of 51.19%, accounting for 453.28 kilo tons in 2020 and is projected
-
to register a CAGR of 5.45%. The aluminium segment was the second-largest with a
-
share of 22.17% in 2020, sized at 196.28 kilo tons; it is projected to exhibit a
-
CAGR of 6.85%. However, the stainless steel segment is expected to register the
-
highest CAGR of 6.89%.\r\nTABLE 357 REST OF THE MIDDLE EAST & AFRICA:
-
METAL CASTING MARKET, BY PROCESS TYPE, 2022-2030 (USD MILLION)\r\nProcess
-
Type 2019 2020 2021 2030 CAGR (2022-2030)\r\nSand Casting 1,133.90 1,052.99
-
,100.25 2,083.72 7.35%\r\nDie Casting 575.37 536.32 562.48 1,099.84 7.74%\r\nShell
-
Mold Casting 190.23 175.31 181.78 321.03 6.52%\r\nGravity Casting 148.88
-
137.55 203.42 4.44%\r\nVacuum Casting 77.65 70.53 72.05 109.24 4.73%\r\nInvestment
-
Casting 142.94 132.15 137.47 250.13 6.88%\r\nOthers 76.00 69.58 71.67 118.60
-
%\r\nTotal 2,344.97 2,171.81 2,263.25 4,185.99 7.07%\r\nSource:
-
Indiana Cast Metal Association (INCMA), American Foundry Society (AFS), The North
-
American Die Casting Association, NON-FERROUS FOUNDERS’ SOCIETY, Aluminium
-
Casters’ Association of India, Casting Industry Suppliers Association, International
-
Trade Centre, World Trade Centre, Government Websites, Press Releases, Journals,
-
Annual Reports, Whitepapers, Company Websites, and MRFR Analysis\r\nThe sand
-
casting segment accounted for the largest market share of 48.48% in 2020, with a
-
market value of USD 1,053.0 million; it is expected to register a CAGR of 7.35%
-
during the forecast period. The die casting segment accounted for the second largest
-
market share in 2020, valued at USD 536.3 million; it is projected to register the
-
highest CAGR of 7.74%.\r\nTABLE 358 REST OF THE MIDDLE EAST & AFRICA:
-
METAL CASTING MARKET, BY PROCESS TYPE, 2022-2030 (KILO TONS)\r\nProcess Type
-
2020 2021 2030 CAGR (2022-2030)\r\nSand Casting 482.98 445.09 459.81
-
6.10%\r\nDie Casting 234.97 217.35 225.37 396.33 6.47%\r\nShell
-
Mold Casting 79.32 72.54 74.37 118.12 5.28%\r\nGravity Casting 58.97 53.05
-
71.10 3.22%\r\nVacuum Casting 30.16 27.18 27.45 37.44 3.51%\r\nInvestment
-
Casting 57.20 52.47 53.97 88.31 5.62%\r\nOthers 19.88 17.74 17.73 21.27 2.05%\r\nTotal
-
885.42 912.17 1,515.74 5.80%\r\nSource: Indiana Cast Metal Association
-
(INCMA), American Foundry Society (AFS), The North American Die Casting Association,
-
NON-FERROUS FOUNDERS’ SOCIETY, Aluminium Casters’ Association of India,
-
Casting Industry Suppliers Association, International Trade Centre, World Trade
-
Centre, Government Websites, Press Releases, Journals, Annual Reports, Whitepapers,
-
Company Websites, and MRFR Analysis\r\nThe sand casting segment dominated
-
the market with a share of 50.27%, accounting for 445.09 kilo tons in 2020; it is
-
projected to exhibit a CAGR of 6.10%. The die casting segment was the second-largest
-
with a share of 24.55% in 2020, sized at 217.35 kilo tons; it is projected to exhibit
-
the highest CAGR of 6.47%.\r\nTABLE 359 REST OF THE MIDDLE EAST & AFRICA:
-
METAL CASTING MARKET, BY END-USE INDUSTRY, 2022-2030 (USD MILLION)\r\nEnd-use
-
Industry 2019 2020 2021 2030 CAGR (2022-2030)\r\nAutomotive & Transportation
-
866.75 906.71 1,734.62 7.47%\r\nBuilding & Construction 404.62
-
389.53 712.22 6.94%\r\nMining 293.87 270.81 280.80 495.88 6.52%\r\nEquipment
-
& Machine 324.05 300.31 313.15 582.38 7.14%\r\nConsumer Goods 249.55
-
239.41 430.75 6.74%\r\nOthers 140.61 129.24 133.66 230.13 6.22%\r\nTotal
-
,344.97 2,171.81 2,263.25 4,185.99 7.07%\r\nSource: Indiana Cast Metal Association
-
(INCMA), American Foundry Society (AFS), The North American Die Casting Association,
-
NON-FERROUS FOUNDERS’ SOCIETY, Aluminium Casters’ Association of India,
-
Casting Industry Suppliers Association, International Trade Centre, World Trade
-
Centre, Government Websites, Press Releases, Journals, Annual Reports, Whitepapers,
-
Company Websites, and MRFR Analysis\r\nThe automotive & transportation
-
segment accounted for the largest market share of 39.91% in 2020, with a market
-
value of USD 866.8 million; it is expected to register the highest CAGR of 7.47%
-
during the forecast period. The building & construction segment accounted for
-
the second largest market share in 2020, valued at USD 374.3 million; it is projected
-
to exhibit a CAGR of 6.94%.\r\nTABLE 360 REST OF THE MIDDLE EAST & AFRICA:
-
METAL CASTING MARKET, BY END-USE INDUSTRY, 2022-2030 (KILO TONS)\r\nEnd-use
-
Industry 2019 2020 2021 2030 CAGR (2022-2030)\r\nAutomotive & Transportation
-
358.66 370.95 638.23 6.21%\r\nBuilding & Construction 166.96 153.26
-
259.32 5.68%\r\nMining 118.78 108.63 111.36 176.87 5.27%\r\nEquipment
-
& Machine 132.34 121.70 125.47 209.86 5.88%\r\nConsumer Goods 99.85 91.50
-
152.09 5.49%\r\nOthers 56.81 51.68 52.69 79.37 4.66%\r\nTotal
-
885.42 912.17 1,515.74 5.80%\r\nSource: Indiana Cast Metal Association
-
(INCMA), American Foundry Society (AFS), The North American Die Casting Association,
-
NON-FERROUS FOUNDERS’ SOCIETY, Aluminium Casters’ Association of India,
-
Casting Industry Suppliers Association, International Trade Centre, World Trade
-
Centre, Government Websites, Press Releases, Journals, Annual Reports, Whitepapers,
-
Company Websites, and MRFR Analysis\r\nThe automotive & transportation
-
segment dominated the market with a share of 40.51%, accounting for 358.66 kilo
-
tons in 2020; it is expected to register the highest CAGR of 6.21% from 2021 to
-
The building & construction segment was the second-largest with a share
-
of 17.31% in 2020, sized at 153.26 kilo tons; it is projected to exhibit a CAGR
-
of 5.68%.\r\nTABLE 361 REST OF THE MIDDLE EAST & AFRICA: METAL CASTING
-
MARKET, BY AUTOMOTIVE & TRANSPORTATION, 2022-2030 (USD MILLION)\r\nAutomotive
-
& Transportation 2019 2020 2021 2030 CAGR (2022-2030)\r\nGearbox 191.65
-
189.15 385.60 8.24%\r\nWheels 93.54 87.48 92.05 185.27 8.08%\r\nEngine
-
Blocks 130.01 121.04 126.79 245.57 7.62%\r\nCylinder Head 223.73 206.75 214.96
-
6.80%\r\nExhaust Manifold 62.11 57.49 59.87 109.90 6.98%\r\nSeat
-
Frame 74.43 69.11 72.21 136.58 7.34%\r\nOthers 156.79 145.39 151.68 283.19
-
%\r\nTotal 932.27 866.75 906.71 1,734.62 7.47%\r\nSource: Indiana
-
Cast Metal Association (INCMA), American Foundry Society (AFS), The North American
-
Die Casting Association, NON-FERROUS FOUNDERS’ SOCIETY, Aluminium Casters’
-
Association of India, Casting Industry Suppliers Association, International Trade
-
Centre, World Trade Centre, Government Websites, Press Releases, Journals, Annual
-
Reports, Whitepapers, Company Websites, and MRFR Analysis\r\nThe cylinder
-
head segment accounted for the largest market share of 23.85% in 2020, with a market
-
value of USD 206.7 million; it is expected to register a CAGR of 6.80% during the
-
forecast period. The gearbox segment accounted for the second largest market share
-
in 2020, valued at USD 179.5 million; it is projected to register the highest CAGR
-
of 8.24%.\r\nTABLE 362 REST OF THE MIDDLE EAST & AFRICA: METAL CASTING
-
MARKET, BY AUTOMOTIVE & TRANSPORTATION, 2022-2030 (KILO TONS)\r\nAutomotive
-
& Transportation 2019 2020 2021 2030 CAGR (2022-2030)\r\nGearbox 191.65
-
189.15 385.60 8.24%\r\nWheels 93.54 87.48 92.05 185.27 8.08%\r\nEngine
-
Blocks 130.01 121.04 126.79 245.57 7.62%\r\nCylinder Head 223.73 206.75 214.96
-
6.80%\r\nExhaust Manifold 62.11 57.49 59.87 109.90 6.98%\r\nSeat
-
Frame 74.43 69.11 72.21 136.58 7.34%\r\nOthers 156.79 145.39 151.68 283.19
-
%\r\nTotal 932.27 866.75 906.71 1,734.62 7.47%\r\nSource: Indiana
-
Cast Metal Association (INCMA), American Foundry Society (AFS), The North American
-
Die Casting Association, NON-FERROUS FOUNDERS’ SOCIETY, Aluminium Casters’
-
Association of India, Casting Industry Suppliers Association, International Trade
-
Centre, World Trade Centre, Government Websites, Press Releases, Journals, Annual
-
Reports, Whitepapers, Company Websites, and MRFR Analysis\r\nThe cylinder
-
head segment accounted for the largest market share of 23.85% in 2020, with a market
-
value of USD 206.7 million; it is expected to register a CAGR of 6.80% during the
-
forecast period. The gearbox segment accounted for the second largest market share
-
in 2020, valued at USD 179.5 million; it is projected to register the highest CAGR
-
of 8.24%.\r\nTABLE 363 REST OF THE MIDDLE EAST & AFRICA: METAL CASTING
-
MARKET, BY EQUIPMENT & MACHINE, 2022-2030 (USD MILLION)\r\nEquipment
-
& Machine 2019 2020 2021 2030 CAGR (2022-2030)\r\nPumps & Valves
-
169.55 176.49 323.04 6.95%\r\nOthers 140.77 130.76 136.66 259.34 7.38%\r\nTotal
-
300.31 313.15 582.38 7.14%\r\nSource: Indiana Cast Metal Association
-
(INCMA), American Foundry Society (AFS), The North American Die Casting Association,
-
NON-FERROUS FOUNDERS’ SOCIETY, Aluminium Casters’ Association of India,
-
Casting Industry Suppliers Association, International Trade Centre, World Trade
-
Centre, Government Websites, Press Releases, Journals, Annual Reports, Whitepapers,
-
Company Websites, and MRFR Analysis\r\nThe pumps & valves segment accounted
-
for a larger market share of 56.46% in 2020, with a market value of USD 169.6 million;
-
it is expected to register a CAGR of 6.95% during the forecast period. The Others
-
segment was valued at USD 130.8 million; it is projected to register a higher CAGR
-
of 7.38%.\r\n \r\nTABLE 364 REST OF THE MIDDLE EAST & AFRICA:
-
METAL CASTING MARKET, BY EQUIPMENT & MACHINE, 2022-2030 (KILO TONS)\r\nEquipment
-
& Machine 2019 2020 2021 2030 CAGR (2022-2030)\r\nPumps & Valves
-
69.41 71.43 117.58 5.69%\r\nOthers 56.73 52.30 54.04 92.28 6.13%\r\nTotal
-
121.70 125.47 209.86 5.88%\r\nSource: Indiana Cast Metal Association
-
(INCMA), American Foundry Society (AFS), The North American Die Casting Association,
-
NON-FERROUS FOUNDERS’ SOCIETY, Aluminium Casters’ Association of India,
-
Casting Industry Suppliers Association, International Trade Centre, World Trade
-
Centre, Government Websites, Press Releases, Journals, Annual Reports, Whitepapers,
-
Company Websites, and MRFR Analysis\r\nThe pumps & valves segment dominated
-
the market with a share of 57.03%, accounting for 69.41 kilo tons in 2020; it is
-
projected to exhibit a CAGR of 5.69%. The Others segment accounted for a share of
-
% in 2020, sized at 52.30 kilo tons; it is projected to exhibit a higher CAGR
-
of 6.13%.\r\n \r\n10 COMPETITIVE LANDSCAPE\r\n10.1 COMPETITIVE
-
OVERVIEW\r\nThe competitive landscape offers an analysis of the key developments
-
by the companies operating in the global market. The global market for metal casting
-
is projected to witness healthy growth during the forecast period, 2021 to 2030.
-
The global market is projected to register a CAGR of 7.75% owing to the rising demand
-
for aluminum and magnesium in the manufacturing of cast products in the automotive
-
and building & construction industries. The growing concern regarding fuel consumption
-
and the need to decrease the weighting of automobiles is likely to boost the demand
-
for these metals, owing to their lightweight and high strength. Additionally, the
-
demand for stainless steel and iron in the building & construction industry,
-
coupled with the increase in residential and non-residential construction activities
-
globally, is expected to favor the growth of the global metal casting market in
-
the years to follow. Furthermore, the increasing adoption of electric vehicles and
-
electric buses to transform urban public transport is projected to create lucrative
-
opportunities for the global metal casting market players.\r\nEndurance Technologies
-
Limited, Ryobi Limited, Dynacast, and GF Casting Solutions AG are the key players
-
operating in the global metal casting market. These players account for a majority
-
of the global market share owing to their global revenue base, availability of raw
-
material at competitive prices, and wide distribution network.\r\n10.2 GLOBAL
-
MARKET STRATEGY ANALYSIS\r\nThe key players operating in the global market
-
have large and advanced manufacturing facilities at the domestic and international
-
levels. This helps them supply the casted products to various end users across the
-
globe within less time as compared to the small-scale manufacturers, providing a
-
competitive edge in the global market. Additionally, the adoption of various growth
-
strategies by these players such as expansion in lucrative markets, product development
-
as per the customer requirements, distribution agreements, acquisitions of domestic
-
players in the key regional economies, and investments are expected to help these
-
players to gain maximum revenue and long-term growth during the review period. For
-
instance, Endurance, one of the key players, strategizes to be the preferred supplier
-
of automotive components, mainly focusing on two-wheeler OEMs and has partnered
-
with five out of the top six two-wheeler OEMs in India.\r\nAccording to MRFR
-
analysis, the global metal casting market has a huge revenue base in Asia-Pacific,
-
North America, and Europe. Asia-Pacific accounted for the largest share in the global
-
market owing to the robust growth of the automotive industry in the region. The
-
demand for metal-casted products is expected to increase and drive the global market
-
growth during the forecast period.\r\nChina, India, the US, South Korea,
-
and Germany are the major countries contributing to the global market growth owing
-
to the rising demand for metal casted products in the automotive and building &
-
construction industries and large consumer base in these countries.\r\n \r\n10.3
-
RECENT DEVELOPMENTS\r\nTABLE 365 KEY DEVELOPMENTS\r\nDate Approach
-
Development\r\nApril 2020 Acquisition Endurance Overseas S.r.l. acquired
-
a 99% equity stake in Adler S.p.A., a leader in systems solutions for clutches,
-
gears, and friction plates. With this acquisition, the company will have access
-
to Adler's technical know-how and intellectual property rights. Also, it will provide
-
growth opportunities for the India market and export opportunities.\r\nJanuary
-
Acquisition Endurance, through its Italian subsidiary—Endurance Overseas
-
Srl—acquired Fonpresmetal Gap SpA, an Italian aluminum die-casting firm. Fonpresmetal
-
Gap SpA has a manufacturing facility in Brescia, Italy, with a capacity of 6,500
-
tons/annum. This acquisition further strengthened the company's presence in Europe
-
and expanded its automotive aluminum casting capacity.\r\nNovember 2018 Agreement
-
GF Casting signed a contract agreement to supply lightweight cast components for
-
electric vehicles (EV) in China. The country is one of the large markets for EVs
-
and has set a goal for total yearly sales of 2 million EVs and gas-electric hybrid
-
vehicles by 2020. This agreement helped the company grow its lightweight cast components
-
business in the EV segment.\r\nMay 2018 Acquisition Ryobi acquired Hoei Industries
-
Co. Ltd, a manufacturer of motor vehicle parts and accessories. This acquisition
-
helped strengthen the company's presence in Japan and expand its customer base.\r\nJanuary
-
Investment Endurance invested USD 42.63 million on new projects, capacity expansions,
-
and R&D. This investment helped aid the growth of its two- and three-wheeler
-
business by supplying the die casting components to companies such as Royal Enfield,
-
Hyundai Motor India, and Tata Motors.\r\nJanuary 2018 Expansion Dynacast
-
and its partnering divisions announced a new family of brands, namely Form Technologies.
-
Form Technologies combines three world-leading precision component manufacturers,
-
including Dynacast for precision-engineered die-cast components, Signicast for investment
-
casting and prototyping, and OptiMIM.\r\nAugust 2017 Acquisition GF Casting
-
acquired a high-pressure aluminum die casting specialist firm, Eucasting Ro SRL
-
(Eucasting), which has two manufacturing units in Romania. Eucasting has an excellent
-
customer base and location, which will help expand GF Casting's presence in the
-
growing lightweight metal components market.\r\nAugust 2017 Expansion Dynacast
-
announced the opening of its sales office at Aichi-ken, Japan. The development enabled
-
the company to deliver advanced and high-value solutions across several industries
-
and increase its geographical presence in critical growing markets.\r\nAugust
-
Expansion Dynacast expanded its zinc die casting operations by installing four
-
state-of-the-art zinc die-cast machines. It received provincial funding of USD 137,700
-
for development. In addition to this, the federal government also issued a grant
-
of USD 50,000 for its staff and training.\r\nSource: Company Website and
-
Press Releases\r\n10.4 COMPETITIVE BENCHMARKING\r\nFIGURE 28 COMPETITIVE
-
BENCHMARKING\r\nSource: Annual Report, Press Releases, Associations, Government
-
Records, Journals, Expert Interviews, Secondary Research, and MRFR Analysis\r\n11
-
COMPANY PROFILES\r\n11.1 ENDURANCE TECHNOLOGIES LIMITED\r\n11.1.1
-
COMPANY OVERVIEW\r\nCompany Headquarters: Aurangabad, India\r\nFounded:
-
\r\nWorkforce: ~3,800\r\nCompany Working: Endurance Technologies
-
Limited (Endurance) is the largest aluminum die-casting manufacturer in India. It
-
is also a prominent manufacturer of aluminum die-casting components for the automotive
-
industry. Endurance actively operates through four business segments, namely, automotive
-
die-casting, suspension, transmission, and brake systems. The company uses all three
-
technologies—high pressure die-casting (HPDC), low pressure die-casting (LPDC),
-
and gravity die-casting (GDC). They are largely into the manufacturing of aluminum
-
alloy wheels for motorcycles as well as transmission, suspension, and brake systems.
-
It has 16 aluminum die-casting plants in India and eight in Europe, as well as four
-
R&D facilities in India.\r\nBajaj Auto, H - D Motors India, Hero Motocorp,
-
KTM Power Sports AG, Mahindra & Mahindra, Royal Enfield, Alfa Romeo, Getrag
-
Ford Transmissions, Tata Motors, Daimler AG, FIAT Chrysler, and other European OEMs
-
are among the major clients of Endurance.\r\n \r\n11.1.2 FINANCIAL
-
OVERVIEW\r\nFIGURE 29 ENDURANCE TECHNOLOGIES LIMITED: FINANCIAL OVERVIEW
-
SNAPSHOT\r\nSource: Annual Report, Press Releases, and MRFR Analysis\r\n \r\n11.1.3
-
PRODUCTS OFFERED\r\nTABLE 366 ENDURANCE TECHNOLOGIES LIMITED: PRODUCTS OFFERED\r\nSegment
-
Product\r\nAluminum die-casting • High pressure\r\no Main Housing\r\no
-
Rear Housing\r\no Transmission Cover\r\no Clutch Housing\r\no
-
Crankcase Transmission Side\r\n• Low pressure\r\no Cylinder Head\r\no
-
Crown Handle\r\no Adaptor Housing\r\n• Gravity\r\no Alloy
-
Wheel Front\r\no Swing Arm\r\no Alloy Wheel Rear\r\nSource:
-
Company Website and Press Releases\r\n11.1.4 KEY DEVELOPMENTS\r\nTABLE
-
ENDURANCE TECHNOLOGIES LIMITED: KEY DEVELOPMENTS\r\nDate Approach Development\r\nApril
-
Acquisition Endurance Overseas S.r.l. acquired a 99% equity stake in Adler
-
S.p.A., a leader in systems solutions for clutches, gears, and friction plates.
-
With this acquisition, the company will have access to Adler's technical know-how
-
and intellectual property rights. Also, it will provide growth opportunities for
-
the India market and export opportunities.\r\nJanuary 2019 Acquisition Endurance,
-
through its Italian subsidiary—Endurance Overseas Srl—acquired Fonpresmetal
-
Gap SpA, an Italian aluminum die-casting firm. Fonpresmetal Gap SpA has a manufacturing
-
facility in Brescia, Italy, with a capacity of 6,500 tons/annum. This acquisition
-
further strengthened the company's presence in Europe and expanded its automotive
-
aluminum casting capacity.\r\nJanuary 2018 Investment Endurance invested
-
USD 42.63 million on new projects, capacity expansions, and R&D. This investment
-
helped aid the growth of its two- and three-wheeler business by supplying the die
-
casting components to companies such as Royal Enfield, Hyundai Motor India, and
-
Tata Motors.\r\nSource: Company Website and Press Releases\r\n11.1.5
-
SWOT ANALYSIS\r\nFIGURE 30 ENDURANCE TECHNOLOGIES LIMITED: SWOT ANALYSIS\r\nSource:
-
Annual Report, Press Releases, and MRFR Analysis\r\n11.1.6 KEY STRATEGIES\r\nEndurance
-
aims to be the preferred supplier of automotive components for two-wheeler OEMs
-
in the world and has partnered with five out of the top six two-wheeler OEMs in
-
India. It focuses on increasing its presence in the value-added machined castings
-
segment for both two-wheelers and four-wheelers. Additionally, the company focuses
-
on expanding its business in Europe through strategic mergers and acquisitions.\r\n \r\n11.2
-
GF CASTING SOLUTIONS AG\r\n11.2.1 COMPANY OVERVIEW\r\nCompany Headquarters:
-
Schaffhausen, Switzerland\r\nFounded: 1802\r\nWorkforce: ~14,118\r\nCompany
-
Working: GF Casting Solutions AG (GF Casting), a subsidiary of George Fischer Ltd,
-
is engaged in the production, development, and processing of heavy-duty lightweight
-
components in aluminum and magnesium high-pressure die-casting, iron sand casting,
-
precision casting, and additive manufacturing for different industries. It operates
-
through three segments, namely, piping systems, casting solutions, and machining
-
solutions. The company has 13 production sites across Germany, Romania, the US,
-
Austria, and China, manufacturing partnerships in North America and Japan, and two
-
R&D centers in Switzerland and China.\r\n11.2.2 FINANCIAL OVERVIEW\r\nFIGURE
-
GF CASTING SOLUTIONS AG: FINANCIAL OVERVIEW SNAPSHOT\r\nSource: Annual
-
Report, Press Releases, and MRFR Analysis\r\n11.2.3 PRODUCTS OFFERED\r\nTABLE
-
GF CASTING SOLUTIONS AG: PRODUCTS OFFERED\r\nSegment Product\r\nPassenger
-
cars • Body & Structure\r\n• Rear Door Frame\r\n•
-
Front Door\r\n• Tank Frame\r\n• Front End Carrier\r\n•
-
Tank Cap\r\n• Seat Frame\r\n• Cross Car Beam\r\n•
-
Front Center Console\r\n• Rear Center Console\r\n• Door
-
Sill Frame Member\r\n• Shock Tower\r\n• Powertrain\r\n•
-
Battery Housing\r\n• Transmission Housing\r\n• Engine Block\r\n•
-
Turbocharger Housing\r\n• Front Cover\r\n• Oil Conduit Module\r\n•
-
Chassis\r\n• Bionic Steering Knuckle\r\n• Wheel Carrier\r\nCommercial
-
vehicles • Powertrain\r\n• Exhaust Manifold\r\n• Transmission
-
Housing\r\n• Frame\r\n• Steering Knuckle Hydrodrive\r\nIndustrial
-
applications • Converter Housing\r\n• Escalator Step\r\n•
-
Cast Wheel\r\n• Portal Axle Housing\r\n• Driver\r\n•
-
Axle Housing\r\n• Bearing Housing\r\n• Rear Axle Housing\r\n•
-
Housing Cover\r\n• Lighting Body and Cover\r\n• Lighting
-
Housing\r\n• Decorative Angle\r\nSource: Company Website and
-
Press Releases\r\n11.2.4 KEY DEVELOPMENTS\r\nTABLE 369 GF CASTING
-
SOLUTIONS AG: KEY DEVELOPMENTS\r\nDate Approach Development\r\nNovember
-
Agreement GF Casting signed a contract agreement to supply lightweight cast
-
components for electric vehicles (EV) in China. The country is one of the large
-
markets for EVs and has set a goal for total yearly sales of 2 million EVs and gas-electric
-
hybrid vehicles by 2020. This agreement helped the company grow its lightweight
-
cast components business in the EV segment.\r\nAugust 2017 Acquisition GF
-
Casting acquired a high-pressure aluminum die casting specialist firm, Eucasting
-
Ro SRL (Eucasting), which has two manufacturing units in Romania. Eucasting has
-
an excellent customer base and location, which will help expand GF Casting's presence
-
in the growing lightweight metal components market.\r\nSource: Company Website
-
and Press Releases\r\n \r\n11.2.5 SWOT ANALYSIS\r\nFIGURE
-
GF CASTING SOLUTIONS AG: SWOT ANALYSIS\r\nSource: Annual Report, Press
-
Releases, and MRFR Analysis\r\n11.2.6 KEY STRATEGIES\r\nGF Casting
-
focuses on offering solutions that align with the shareholders' interests. It aims
-
to achieve long-term success by investing in collaborations and partnerships with
-
top OEMs. It also focuses on strengthening its product portfolio by developing innovative
-
lightweight automotive components. Furthermore, the company strategically acquired
-
die casting facilities to expand its manufacturing capability.\r\n \r\n11.3
-
RYOBI LIMITED\r\n11.3.1 COMPANY OVERVIEW\r\nCompany Headquarters:
-
Hiroshima Prefecture, Japan\r\nFounded: 1943\r\nWorkforce: ~7,708\r\nCompany
-
Working: Ryobi Limited (Ryobi) is engaged in metal casting manufacturing by applying
-
innovative technologies for applications in the automotive industry. It operates
-
through four business segments, namely, die casting, printing equipment, power tools,
-
and builders' hardware. The die casting segment manufactures automobile transmission
-
cases and cylinder blocks, among others. It has over 2,500 types of die casting
-
products, including cylindrical blocks and transmission cases and subframes. Ryobi
-
Die Casting, its principal subsidiary, has six facilities in Japan and six facilities
-
in the US, China, Thailand, countries in Europe, and Mexico. General Motors Company,
-
Toyota Motor Corporation, Nissan Motor Co., Ltd., Mitsubishi Motors Corporation,
-
Ford Motor Company, and Hyundai Motor Company are some of its key customers.\r\n \r\n11.3.2
-
FINANCIAL OVERVIEW\r\nFIGURE 33 RYOBI LIMITED: FINANCIAL OVERVIEW SNAPSHOT\r\nSource:
-
Annual Report, Press Releases, and MRFR Analysis\r\n11.3.3 PRODUCTS OFFERED\r\nTABLE
-
RYOBI LIMITED: PRODUCTS OFFERED\r\nSegment Product\r\nDie casting
-
• Automobile Transmission Case\r\n• Automobile Cylinder Block\r\n•
-
Automobile Subframe\r\n• Motorcycle Cylinder Block\r\nSource:
-
Company Website and Press Releases\r\n11.3.4 KEY DEVELOPMENTS\r\nTABLE
-
RYOBI LIMITED: KEY DEVELOPMENTS\r\nDate Approach Development\r\nMay
-
Acquisition Ryobi acquired Hoei Industries Co. Ltd, a manufacturer of motor
-
vehicle parts and accessories. This acquisition helped strengthen the company's
-
presence in Japan and expand its customer base.\r\nSource: Company Website
-
and Press Releases\r\n11.3.5 SWOT ANALYSIS\r\nFIGURE 34 RYOBI LIMITED:
-
SWOT ANALYSIS\r\nSource: Annual Report, Press Releases, and MRFR Analysis\r\n11.3.6
-
KEY STRATEGIES\r\nRyobi aims to respond to the changing needs of customers
-
and OEMs with enhanced productivity and top-quality products. Additionally, it focuses
-
on ensuring that its shareholders, partners, and employees always find their association
-
with the company mutually beneficial.\r\n11.4 DYNACAST\r\n11.4.1 COMPANY
-
OVERVIEW\r\nCompany Headquarters: Charlotte, US\r\nFounded: 1936\r\nWorkforce:
-
~5,510\r\nCompany Working: Dynacast is engaged in manufacturing small-engineered
-
precision parts using multi-side die-casting technology and tooling methods. It
-
operates only through one segment—specialty die casting. This segment uses
-
different metals such as aluminum, magnesium, and zinc for manufacturing die casting
-
components such as heat sinks, air valves, and engine cooling fans. It has three
-
subsidiaries in the US. One of its subsidiaries, Dynacast Industrial Products, manufactures
-
low-cost zinc alloy fasteners and rubber products. It has 23 manufacturing facilities
-
across 16 countries worldwide.\r\n11.4.2 FINANCIAL OVERVIEW\r\nThis
-
is a privately held company. Hence, financial information is not available in the
-
public domain.\r\n11.4.3 PRODUCTS OFFERED\r\nTABLE 372 DYNACAST: PRODUCTS
-
OFFERED\r\nSegment Product\r\nAluminum die casting metals • Automotive\r\n•
-
Engine Cooling Fan\r\n• Heat Sink For Led Headlights\r\n•
-
Control Unit Housing For Motorcycle\r\n• Consumer Electronics\r\n•
-
Bezel for a Smart Watch\r\n• Camera Chassis\r\n• Radio Assembly
-
For Satellite Systems\r\n• Camera Housings\r\n• Coupling
-
on Consumer Printer\r\n• Tablet Frame\r\n• Internal Parts
-
For Portable Oxygen Concentrator\r\n• Telecommunications\r\n•
-
Frame For 2-Way Radio\r\nZinc die casting metals • Automotive\r\n•
-
Paddle Shifters\r\n• Gear Shifter\r\n• Ignition and Lock
-
Housing For The Steering Wheel\r\n• Capless Fuel Filler\r\n•
-
Air Valve For Lowering Trucks And Buses\r\n• Consumer Electronics\r\n•
-
Bezel for a Smart Watch\r\n• Camera Chassis\r\n• Mobile
-
Microphone\r\n• Camera Housings\r\n• Coupling on Consumer
-
Printer\r\n• Stand For Tablet\r\n• Hardware\r\n•
-
Foot base for Triple-Function Power Tool\r\n• Motor Balance for Power
-
Sander\r\n• Telecommunications\r\n• Radio Assembly For Satellite
-
Systems\r\n• Cell Tower Components\r\n• Tv Outlet Cover\r\nMagnesium
-
casting metals • Consumer Electronics\r\n• Camera Housing On A
-
Consumer Drone\r\n• Camera housings\r\n• Tablet Frame\r\nSource:
-
Company Website and Press Releases\r\n \r\n11.4.4 KEY DEVELOPMENTS\r\nTABLE
-
DYNACAST: KEY DEVELOPMENTS\r\nDate Approach Development\r\nJanuary
-
Expansion Dynacast and its partnering divisions announced a new family of brands,
-
namely Form Technologies. Form Technologies combines three world-leading precision
-
component manufacturers, including Dynacast for precision-engineered die-cast components,
-
Signicast for investment casting and prototyping, and OptiMIM.\r\nAugust
-
Expansion Dynacast announced the opening of its sales office at Aichi-ken,
-
Japan. The development enabled the company to deliver advanced and high-value solutions
-
across several industries and increase its geographical presence in critical growing
-
markets.\r\nAugust 2017 Expansion Dynacast expanded its zinc die casting
-
operations by installing four state-of-the-art zinc die-cast machines. It received
-
provincial funding of USD 137,700 for development. In addition to this, the federal
-
government also issued a grant of USD 50,000 for its staff and training.\r\nSource:
-
Company Website and Press Releases\r\n11.4.5 SWOT ANALYSIS\r\nFIGURE
-
DYNACAST: SWOT ANALYSIS\r\nSource: Annual Report, Press Releases, and
-
MRFR Analysis\r\n11.4.6 KEY STRATEGIES\r\nDynacast aims to improve
-
its innovation capabilities by investing in advanced tools and techniques. Its new
-
multi-slide technologies help redefine the results, eliminate secondary operations,
-
increase manufacturing speed, and offer reliable results to the end users. Furthermore,
-
the company plans to expand its footprint in high-growth markets, especially Asia-Pacific.\r\n \r\n11.5
-
PRECISION CASTPARTS CORP\r\n11.5.1 COMPANY OVERVIEW\r\nCompany Headquarters:
-
Portland, US\r\nFounded: 1949\r\nWorkforce: ~30,500\r\nCompany
-
Working: Precision Castparts Corp is a diversified manufacturer of complex metal
-
components and products for the aerospace, power, and general industrial markets.
-
It is a leading manufacturer of large, complex structural investment castings, airfoil
-
castings, aerostructures, forged components, and highly engineered fasteners for
-
aerospace applications. The company is also one of the leading manufacturers of
-
airfoil castings for the industrial gas turbine market. It operates through three
-
segments, namely, investment cast products, forged products, and airframe products.
-
Under its investment cast products segment, it manufactures investment castings
-
for aircraft engines, airframes, industrial gas turbine (IGT) engines, medical implants,
-
unmanned aerial vehicles, and other industrial applications.\r\nPrecision
-
Castparts Corp has manufacturing facilities in over 160 locations globally.\r\n11.5.2
-
FINANCIAL OVERVIEW\r\nThis is a privately held company. Hence, financial
-
information is not available in the public domain.\r\n11.5.3 PRODUCTS OFFERED\r\nTABLE
-
PRECISION CASTPARTS CORP: PRODUCTS OFFERED\r\nSegment Product\r\nInvestment
-
Cast Products • Aerospace\r\no Compressor Rear Frame\r\no Diffuser\r\no
-
Fan Frame\r\no Sump Housing\r\no PTO Housing\r\no Swirler\r\no
-
Swozzle\r\no Turbine Center Frame\r\no Turbine Exhaust Case\r\no
-
Aircraft Doors\r\no Burner Domes\r\n• Power\r\no High-Pressure/Low-Pressure
-
Blades and Vanes\r\n• General Industrial\r\no Impellers\r\no
-
Spinners\r\n• Medical Prosthetics\r\nSource: Company Website
-
and Press Releases\r\n11.5.4 KEY DEVELOPMENTS\r\nThere have been no
-
recent developments by the company in the global metal casting market.\r\n11.5.5
-
SWOT ANALYSIS\r\nFIGURE 36 PRECISION CASTPARTS CORP: SWOT ANALYSIS\r\nSource:
-
Annual Report, Press Releases, and MRFR Analysis\r\n11.5.6 KEY STRATEGIES\r\nPrecision
-
Castparts is focusing on achieving solid top- and bottom-line growth through its
-
legacy operations, and by the acquisition of businesses, especially that are complementary
-
to its operations. Furthermore, the company adheres to high standards in the production
-
of high-quality products that meet the most demanding specifications of its sophisticated
-
customer base.\r\n11.6 GIBBS\r\n11.6.1 COMPANY OVERVIEW\r\nCompany
-
Headquarters: Henderson, US\r\nFounded: 1965\r\nWorkforce: ~1,000\r\nCompany
-
Working: GIBBS is a manufacturer of precision die-cast, machined, and assembled
-
automotive components. It specializes in both horizontal and vertical die-cast processes
-
and is a leading worldwide supplier for its OEMs and tier-1 consumers. GIBBS operates
-
through four business segments, namely engineering, tool + die, die-casting, and
-
machining + assembly. Under the die-casting segment, it manufactures and supplies
-
transmission, powertrain, and driveline automotive die cast components. It has manufacturing
-
operations in the US, Hungary, China, and Brazil.\r\nGeneral Motors, Fiat
-
Chrysler Automobiles NV, American Axle & Manufacturing Inc,Ford Motor Company,
-
Honda Motor Company Ltd, and ZF Friedrichshafen AG, are some of the major customers
-
of GIBBS.\r\nIt is a wholly-owned subsidiary of Koch Enterprises, Inc.\r\n11.6.2
-
FINANCIAL OVERVIEW\r\nThis is a privately held company. Hence, financial
-
information is not available in the public domain.\r\n11.6.3 PRODUCTS OFFERED\r\nTABLE
-
GIBBS: PRODUCTS OFFERED\r\nSegment Product\r\nDriveline •
-
Rear Drive Unit\r\n• Front Drive Unit\r\n• Rear Drive Unit\r\n•
-
Housing\r\n• Torque Tube\r\nTransmission • Stator Support\r\n•
-
Stator Comp Assembly\r\n• Piston Clutch\r\n• Piston Dam
-
Assembly\r\n• Piston\r\n• Pump Body\r\n• Cover\r\n•
-
Center Support\r\n• Bell Housing\r\nPowertrain • Compressor\r\n•
-
Engine Cover\r\n• Crank Case\r\n• Balance Shaft Cover\r\n•
-
Upper Balance Shaft\r\n• Lower Crankcase\r\n• Bracket\r\n•
-
Bearing Cap\r\nChassis • Bracket\r\nSource: Company Website and
-
Press Releases\r\n11.6.4 KEY DEVELOPMENTS\r\nThere have been no recent
-
developments by the company in the global metal casting market.\r\n \r\n11.6.5
-
SWOT ANALYSIS\r\nFIGURE 37 GIBBS: SWOT ANALYSIS\r\nSource: Annual
-
Report, Press Releases, and MRFR Analysis\r\n11.6.6 KEY STRATEGIES\r\nGIBBS
-
aims at delivering technically challenging, complex cast, machined, and assembled
-
products to its global customers. Moreover, it focuses on developing lightweight
-
die-cast products in line with the environmental laws and regulations to cater to
-
the changing needs of customers.\r\n \r\n11.7 ALCAST TECHNOLOGIES\r\n11.7.1
-
COMPANY OVERVIEW\r\nCompany Headquarters: Henderson, US\r\nFounded:
-
\r\nWorkforce: ~1,000\r\nCompany Working: Alcast Technologies
-
(Alcast) is engaged in aluminum casting, aluminum alloy casting, as well as cast
-
aluminum finishing. It manufactures and sells aluminum cast products from general
-
industrial to military and aerospace applications. It specializes in the production
-
of aluminum castings ranging in size from ounces to 400lbs in any production quantity.
-
The company also offers a full range of value-added services, including tooling
-
maintenance, deburring, degating, CNC machining, heat treating, blast cleaning,
-
and chemical/physical analysis.\r\n11.7.2 FINANCIAL OVERVIEW\r\nThis
-
is a privately held company. Hence, financial information is not available in the
-
public domain.\r\n11.7.3 PRODUCTS OFFERED\r\nTABLE 376 ALCAST TECHNOLOGIES:
-
PRODUCTS OFFERED\r\nSegment Product\r\nAluminum Casting • Throttle
-
Body\r\n• Sensor Body\r\n• Sensor Arm\r\n• Scavenge
-
Pump Housing\r\n• Pulley with Cast in Steel Insert\r\n•
-
Oil Pump Housing\r\n• Housing\r\n• Gear Housing\r\n•
-
Foot Pedal\r\n• Fixture Adapter\r\n• Filter Adapter\r\n•
-
Collector Valve\r\n• Bracket\r\nSource: Company Website and Press
-
Releases\r\n11.7.4 KEY DEVELOPMENTS\r\nThere have been no recent developments
-
by the company in the global metal casting market.\r\n11.7.5 SWOT ANALYSIS\r\nFIGURE
-
ALCAST TECHNOLOGIES: SWOT ANALYSIS\r\nSource: Annual Report, Press Releases,
-
and MRFR Analysis\r\n11.7.6 KEY STRATEGIES\r\nAlcast Technologies
-
is exploring a wide range of additional quality standards by investing in optimizing
-
its production technologies and is committed to offering customer satisfaction by
-
vertically integrating key value-added services from its supply chain. In addition,
-
it focuses on expanding its customer base and better serving its current customers.\r\n \r\n11.8
-
AHRESTY WILMINGTON CORPORATION\r\n11.8.1 COMPANY OVERVIEW\r\nCompany
-
Headquarters: Wilmington, US\r\nFounded: 1988\r\nWorkforce: ~795\r\nCompany
-
Working: Ahresty Wilmington Corporation is engaged in R&D, and manufacturing
-
cast, machined, and assembled aluminum die casting products, including engine, transmission,
-
and structural components for the automotive industry. It serves customers in the
-
US, some of which are DMAX Ltd, Honda of America, YSK, Toyota, and Subaru of America,
-
Inc. It has both manual load and fully automated machining lines, and wherein there
-
are 28 fully automated high-pressure die-cast machines.\r\nAhresty Wilmington
-
Corporation operates as a subsidiary of Ahresty Corporation.\r\n11.8.2 FINANCIAL
-
OVERVIEW\r\nThis is a privately held company. Hence, financial information
-
is not available in the public domain.\r\n11.8.3 PRODUCTS OFFERED\r\nTABLE
-
AHRESTY WILMINGTON CORPORATION: PRODUCTS OFFERED\r\nSegment Product\r\nAluminum
-
Die Castings • Torque Converter Case\r\n• Timing Chain Case\r\n•
-
Lower Block\r\n• Transmission Housing\r\n• Chain Case\r\n•
-
Side Cover\r\n• Housing\r\n• Head Cover\r\n•
-
Oil Pan\r\nSource: Company Website and Press Releases\r\n11.8.4 KEY
-
DEVELOPMENTS\r\nThere have been no recent developments by the company in
-
the global metal casting market.\r\n \r\n11.8.5 SWOT ANALYSIS\r\nFIGURE
-
AHRESTY WILMINGTON CORPORATION: SWOT ANALYSIS\r\nSource: Annual Report,
-
Press Releases, and MRFR Analysis\r\n11.8.6 KEY STRATEGIES\r\nAhresty
-
Wilmington Corporation has been working on the strategic 10-Year Vision with \"Winning
-
absolute customers' trust 2025\" of its parent company. It is focusing on enhancing
-
its enterprise value by responding to the increasing need for the light-weighting
-
of vehicles in developed economies and tap the growing demand for aluminum die casting
-
in the US.\r\n \r\n11.9 FORCEBEYOND\r\n11.9.1 COMPANY
-
OVERVIEW\r\nCompany Headquarters: Wilmington, US\r\nFounded: 2006\r\nWorkforce:
-
~100\r\nCompany Working: FORCEBEYOND offers casting, forging, and machining
-
solutions, including die casting, investment casting, hot forging, cold forging,
-
sand casting, stainless steel casting, titanium casting, and high precision CNC
-
machining. It offers various cutting-edge parts and components, engineered precision
-
parts and components to a wide range of industries, including automotive, food,
-
dairy, machinery, medical, chemical, mining, petrochemical, aerospace, electrical,
-
and submarine.\r\nSome of the key customers of FORCEBEYOND are PARKER HANNIFIN
-
CORP, Bemis Manufacturing Company, and Knoll Inc.\r\nFORCEBEYOND has locations
-
in the US, China, and Taiwan, incorporated with the latest production technologies
-
and quality assurance procedures.\r\n11.9.2 FINANCIAL OVERVIEW\r\nThis
-
is a privately held company. Hence, financial information is not available in the
-
public domain.\r\n11.9.3 PRODUCTS OFFERED\r\nTABLE 378 FORCEBEYOND:
-
PRODUCTS OFFERED\r\nSegment Product\r\nDie Casting • Aluminum
-
Die Casting\r\no Oil Pump\r\no Mirror Frame\r\no Engine Housing\r\no
-
Power Tool Cover\r\no Power Tool Housing\r\no Engine Cover\r\n•
-
Zinc Die Casting\r\no Flange Connector\r\no Automobile Part\r\n•
-
Magnesium Die Casting\r\nInvestment Casting • Stainless Steel Casting\r\no
-
Centrifugal Pump\r\no Exhaust Manifold\r\no Solenoid Valve\r\no
-
Strainer\r\no Gate Valve\r\no Ball Valve\r\n• Duplex Stainless
-
Steel Casting\r\no Submerged Pump\r\n• Super Duplex Stainless
-
Steel Casting\r\no Centrifugal Pump\r\no Exhaust System Box\r\no
-
Submerged Pump\r\n• Titanium Casting\r\no Wheel\r\no Pump
-
Body\r\no Valve\r\no Impeller\r\n• Carbon Steel Casting
-
and Low-Alloy Steel Casting\r\no Gate Valve\r\no Valve Body\r\n•
-
Tractor Parts\r\nSand Casting • Ductile Gray Iron Sand Casting Threaded
-
Flange Casting HS-GI-018\r\n• Ductile Gray Iron Sand Casting Knuckle\r\n•
-
Gray Iron Sand Casting Pump\r\n• Heat Resistant Steel Turbine Housing\r\n•
-
High Ni Turbine Housing\r\n• QT Quick Time Exhaust Manifold\r\n•
-
QT Quick Time QT Turbine Bearing Housing\r\n• Silicon Ductile Iron SiMo
-
Turbo Housing\r\n• Silicon Ductile Iron SiMo Exhaust Manifold\r\nSource:
-
Company Website and Press Releases\r\n11.9.4 KEY DEVELOPMENTS\r\nThere
-
have been no recent developments by the company in the global metal casting market.\r\n \r\n11.9.5
-
SWOT ANALYSIS\r\nFIGURE 40 FORCEBEYOND: SWOT ANALYSIS\r\nSource: Annual
-
Report, Press Releases, and MRFR Analysis\r\n11.9.6 KEY STRATEGIES\r\nFORCEBEYOND
-
is focusing on operational growth and enhancement, and the sustainability of its
-
operations. Also, it emphasizes on diversifying in growing industries and markets
-
with innovative products and technologies. Furthermore, the company focuses on expanding
-
its customer base by providing high-quality products.\r\n \r\n11.10
-
RELIANCE FOUNDRY CO. LTD\r\n11.10.1 COMPANY OVERVIEW\r\nCompany Headquarters:
-
Surrey, Canada\r\nFounded: 1925\r\nWorkforce: ~80\r\nCompany
-
Working: Reliance Foundry Co. Ltd (Reliance Foundry) is engaged in the designing,
-
manufacturing, and installation of metal castings and outdoor products for architectural
-
site furnishings, traffic management, and industrial applications. It delivers the
-
highest-quality stock and custom-designed products for architectural site furnishings,
-
traffic management and industrial applications to clients across North America.
-
It works with architectural design firms, installation contractors, property managers,
-
and city planners to find the best solutions for its customers. The products are
-
designed to suit any outdoor application, from high-profile architectural buildings
-
to everyday industrial and commercial locations.\r\n11.10.2 FINANCIAL OVERVIEW\r\nThis
-
is a privately held company. Hence, financial information is not available in the
-
public domain.\r\n11.10.3 PRODUCTS OFFERED\r\nTABLE 379 RELIANCE FOUNDRY
-
CO. LTD: PRODUCTS OFFERED\r\nSegment Product\r\nBollards • Decorative
-
/ architectural bollards\r\n• Stainless steel bollards\r\n•
-
Security – steel pipe bollards\r\n• Aluminum bollards\r\n•
-
Iron bollards\r\n• Steel bollards\r\nOutdoor Bike Parking Racks
-
& Storage Lockers • Bike racks\r\n• Bike bollards\r\nIndustrial
-
Wheels • Single Flanged Wheels\r\n• Double Flanged Wheels\r\nCustom
-
Metal Casting and Fabrication Services • Sand casting\r\n• Investment
-
casting\r\n• Die casting\r\nSource: Company Website and Press
-
Releases\r\n \r\n11.10.4 KEY DEVELOPMENTS\r\nThere have
-
been no recent developments by the company in the global metal casting market.\r\n11.10.5
-
SWOT ANALYSIS\r\nFIGURE 41 RELIANCE FOUNDRY CO. LTD: SWOT ANALYSIS\r\nSource:
-
Annual Report, Press Releases, and MRFR Analysis\r\n11.10.6 KEY STRATEGIES\r\nReliance
-
Foundry continuously strives to deliver competitively priced, high-quality, precision
-
metal products to its customers through a network of precisely selected international
-
production facilities. Furthermore, the company focuses on continuous innovation
-
and development to design a range of products suitable for outdoor applications.\r\n \r\n12
-
American Foundry Society (AFS)\r\n The North American Die Casting Association\r\n
-
NON-FERROUS FOUNDERS’ SOCIETY\r\n Aluminium Casters’ Association
-
of India\r\n Casting Industry Suppliers Association\r\n International
-
Trade Centre\r\n World Bank\r\n UN Comtrade\r\n Government
-
Websites\r\n Journals\r\n Company Websites\r\n Factiva\r\n \r\n12.2
-
RELATED REPORTS\r\nSR. NO. REPORT TITLE PUBLISH MONTH\r\n1 Global
-
Automotive Metal Die Casting Market Research Report: Information Forecast till 2030\r\nby
-
Metal (Aluminum, Zinc, Magnesium), Process Type (High-Pressure Die Casting, Gravity
-
Die Casting), Application (Structural Components, Transmission Components), and
-
by Region (North America, Europe, Asia-Pacific, Latin America and the Middle East
-
& Africa)\r\nhttps://www.marketresearchfuture.com/reports/automotive-metal-die-casting-market-7698\r\nApril
-
\r\n2 Global Aluminum Die Casting Market Research Report: Forecast till
-
\r\nBy Product Type (HPC, LPDC, Others), By Industry Vertical (Automotive,
-
Power, Building and Construction, Others), and Region (Asia-Pacific, North America,
-
Europe, Latin America and Middle East & Africa)\r\nhttps://www.marketresearchfuture.com/reports/aluminum-die-casting-machine-market-8250\r\nFebruary
-
\r\n3 Global Investment Casting Market Research Report: Forecast till
-
\r\nby Type (Silica Sol Process, Sodium Silicate Process), Application
-
(Aerospace & Military, General Industrial, Industrial Gas Turbines, Automotive,
-
Others), and Region (Asia-Pacific, North America, Europe, Latin America and Middle
-
East & Africa)\r\nhttps://www.marketresearchfuture.com/reports/investment-casting-market-8520\r\nOctober
-
\r\n4. Global Aluminum Casting Market Research Report: Forecast till
-
\r\nBy End-Use Industry (Building & construction, Industrial, Transportation,
-
Others), By Process (Die Casting, Sand Casting, Permanent Mold Casting), and Region
-
(Asia-Pacific, North America, Europe, Latin America and Middle East & Africa)\r\nhttps://www.marketresearchfuture.com/reports/aluminum-castings-market-6719\r\nFebruary
Leave a Comment