Batteries Market (2026 - 2035)

ID: MRFR/EnP/2154-HCR
110 Pages
Snehal Singh
Last Updated: August 07, 2026
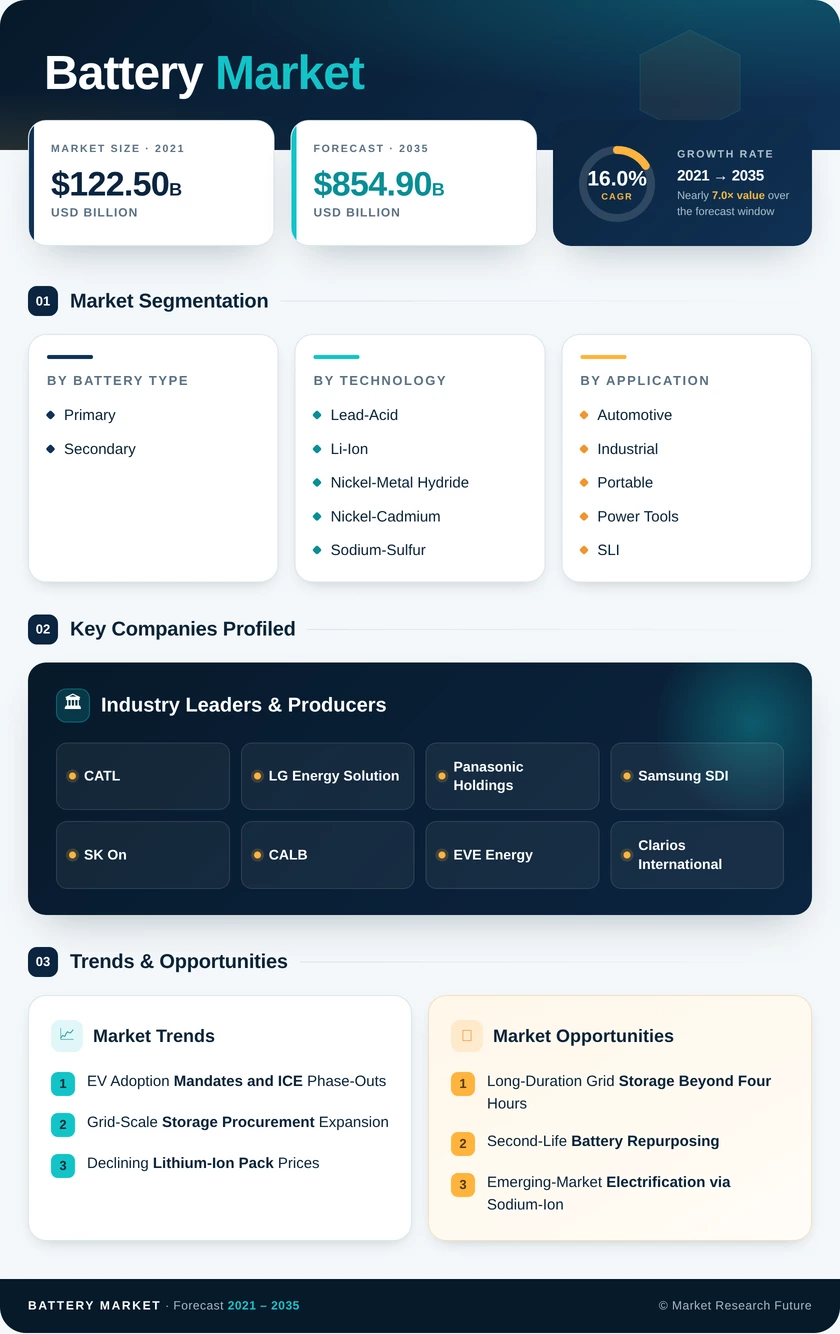
Batteries Market Research Report By Battery Type (Primary (Non-Rechargeable), Secondary (Rechargeable)), By Technology (Lead-Acid, Lithium-Ion, Nickel-Metal Hydride, Nickel-Cadmium, Sodium-Sulfur, Solid-State, Flow Battery, Emerging Chemistries), By Application (Automotive, Industrial, Portable, Power Tools, SLI (Starting, Lighting, Ignition), Other Applications) and By Regional (North America, Europe, South America, Asia Pacific, Middle East and Africa) - Forecast to 2035
Batteries Market
Market Size
Forecast Period2026-2035
CAGR (2026-2035)16.0%
2025 Market SizeUSD 192.70 Billion
2035 Market SizeUSD 854.90 Billion
Key Players
CATL
LG Energy Solution
Panasonic Holdings
Samsung SDI
SK On
CALB
Opportunities
  • Long-Duration Grid Storage Beyond Four Hours
  • Second-Life Battery Repurposing
  • Emerging-Market Electrification via Sodium-Ion
  1. 1 Market Overview |
    1. 1.1 Study Assumptions & Market Definition |
    2. 1.2 Scope of the Study |
    3. 1.3 Research Methodology
  2. 2 Market Summary & Key Takeaways
  3. 3 Market Dynamics |
    1. 3.1 Market Drivers Analysis | |
      1. 3.1.1 EV Adoption Mandates and ICE Phase-Outs | |
      2. 3.1.2 Grid-Scale Storage Procurement Expansion | |
      3. 3.1.3 Declining Lithium-Ion Pack Prices | |
      4. 3.1.4 Government Subsidies and Industrial Policy | |
      5. 3.1.5 Renewable Energy Integration Requirements | |
      6. 3.1.6 Solid-State Commercialization | |
      7. 3.1.7 Circular Economy and Recycling Mandates |
    2. 3.2 Market Restraints Analysis | |
      1. 3.2.1 Raw Material Supply Concentration | |
      2. 3.2.2 Recycling Infrastructure Gaps | |
      3. 3.2.3 Grid Interconnection Bottlenecks | |
      4. 3.2.4 Geopolitical Trade Barriers | |
      5. 3.2.5 Thermal Management and Safety Concerns |
    3. 3.3 Market Opportunity Analysis | |
      1. 3.3.1 Long-Duration Grid Storage Beyond Four Hours | |
      2. 3.3.2 Second-Life Battery Repurposing | |
      3. 3.3.3 Emerging-Market Electrification via Sodium-Ion | |
      4. 3.3.4 Battery-as-a-Service and Subscription Models | |
      5. 3.3.5 Data-Driven Battery Management and Digital Twins |
    4. 3.4 Industry Value Chain Analysis |
    5. 3.5 Porter's Five Forces Analysis
  4. 4 Global Battery Market Size & Forecast (2021–2035) |
    1. 4.1 Historical Market Size (2021–2025) |
    2. 4.2 Current & Forecast Market Size (2026–2035) |
    3. 4.3 Market Size by Revenue (USD Billion) |
    4. 4.4 Year-over-Year Growth Analysis
  5. 5 Segmentation Analysis |
    1. 5.1 By Battery Type | |
      1. 5.1.1 Primary (Non-Rechargeable) | |
      2. 5.1.2 Secondary (Rechargeable) |
    2. 5.2 By Technology | |
      1. 5.2.1 Lead-Acid | |
      2. 5.2.2 Lithium-Ion | |
      3. 5.2.3 Nickel-Metal Hydride | |
      4. 5.2.4 Nickel-Cadmium | |
      5. 5.2.5 Sodium-Sulfur | |
      6. 5.2.6 Solid-State | |
      7. 5.2.7 Flow Battery | |
      8. 5.2.8 Emerging Chemistries |
    3. 5.3 By Application | |
      1. 5.3.1 Automotive | |
      2. 5.3.2 Industrial | |
      3. 5.3.3 Portable | |
      4. 5.3.4 Power Tools | |
      5. 5.3.5 SLI (Starting, Lighting, Ignition) | |
      6. 5.3.6 Other Applications
  6. 6 Regional Analysis |
    1. 6.1 North America | |
      1. 6.1.1 United States | |
      2. 6.1.2 Canada | |
      3. 6.1.3 Mexico |
    2. 6.2 Europe | |
      1. 6.2.1 Germany | |
      2. 6.2.2 United Kingdom | |
      3. 6.2.3 France | |
      4. 6.2.4 Italy | |
      5. 6.2.5 Spain | |
      6. 6.2.6 Nordic Countries | |
      7. 6.2.7 Russia | |
      8. 6.2.8 Rest of Europe |
    3. 6.3 Asia-Pacific | |
      1. 6.3.1 China | |
      2. 6.3.2 India | |
      3. 6.3.3 Japan | |
      4. 6.3.4 South Korea | |
      5. 6.3.5 ASEAN | |
      6. 6.3.6 Rest of Asia-Pacific |
    4. 6.4 South America | |
      1. 6.4.1 Brazil | |
      2. 6.4.2 Argentina | |
      3. 6.4.3 Rest of South America |
    5. 6.5 Middle East & Africa | |
      1. 6.5.1 Saudi Arabia | |
      2. 6.5.2 UAE | |
      3. 6.5.3 South Africa | |
      4. 6.5.4 Egypt | |
      5. 6.5.5 Rest of MEA
  7. 7 Competitive Landscape |
    1. 7.1 Market Share Analysis (2025) |
    2. 7.2 Competitive Benchmarking Matrix |
    3. 7.3 Company Profiles | |
      1. 7.3.1 CATL | |
      2. 7.3.2 BYD Company | |
      3. 7.3.3 LG Energy Solution | |
      4. 7.3.4 Panasonic Holdings | |
      5. 7.3.5 Samsung SDI | |
      6. 7.3.6 SK On | |
      7. 7.3.7 CALB | |
      8. 7.3.8 EVE Energy | |
      9. 7.3.9 Clarios International | |
      10. 7.3.10 Exide Technologies
  8. 8 Future Outlook & Strategic Recommendations (2026–2035) |
    1. 8.1 The Electrification Supercycle |
    2. 8.2 AI-Optimized Manufacturing and Quality Control |
    3. 8.3 ESG Reporting and Supply Chain Transparency |
    4. 8.4 Platform Economics and Modular Architectures
  9. 9 Recent Developments & News
  10. 10 Frequently Asked Questions (FAQs)
  11. 11 Report Scope & Methodology |
    1. 11.1 Study Period & Base Year |
    2. 11.2 Data Sources & Citations |
    3. 11.3 Abbreviations
  12. 12 LIST OF TABLES |
  13. TABLE 1 Global Battery Market Size & Forecast, by Revenue (USD Billion), 2021–2035 |
  14. TABLE 2 Global Battery Market – Year-over-Year Growth Analysis, 2021–2035 |
  15. TABLE 3 Global Battery Market – Driver Impact Analysis |
  16. TABLE 4 Global Battery Market – Restraint Impact Analysis |
  17. TABLE 5 Global Battery Market Size, by Battery Type, 2021–2035 (USD Billion) |
  18. TABLE 6 Global Battery Market Size, by Technology, 2021–2035 (USD Billion) |
  19. TABLE 7 Global Battery Market Size, by Application, 2021–2035 (USD Billion) |
  20. TABLE 8 Global Battery Market Size, by Region, 2021–2035 (USD Billion) |
  21. TABLE 9 North America Battery Market Size, by Country, 2021–2035 (USD Billion) |
  22. TABLE 10 Europe Battery Market Size, by Country, 2021–2035 (USD Billion) |
  23. TABLE 11 Asia-Pacific Battery Market Size, by Country, 2021–2035 (USD Billion) |
  24. TABLE 12 South America Battery Market Size, by Country, 2021–2035 (USD Billion) |
  25. TABLE 13 Middle East & Africa Battery Market Size, by Country, 2021–2035 (USD Billion) |
  26. TABLE 14 Competitive Benchmarking Matrix – Global Battery Market, 2025 |
  27. TABLE 15 Company Profiles – Key Players, Global Battery Market |
  28. TABLE 16 Recent Developments & Strategic Announcements, 2023–2025 |
  29. TABLE 17 Report Scope & Methodology Summary |
  30. TABLE 18 Detailed Sources and Citations |
  31. TABLE 19 North America Battery Market Size, by Battery Type, 2021–2035 (USD Billion) |
  32. TABLE 20 North America Battery Market Size, by Technology, 2021–2035 (USD Billion) |
  33. TABLE 21 North America Battery Market Size, by Application, 2021–2035 (USD Billion) |
  34. TABLE 22 Europe Battery Market Size, by Battery Type, 2021–2035 (USD Billion) |
  35. TABLE 23 Europe Battery Market Size, by Technology, 2021–2035 (USD Billion) |
  36. TABLE 24 Europe Battery Market Size, by Application, 2021–2035 (USD Billion) |
  37. TABLE 25 Asia-Pacific Battery Market Size, by Battery Type, 2021–2035 (USD Billion) |
  38. TABLE 26 Asia-Pacific Battery Market Size, by Technology, 2021–2035 (USD Billion) |
  39. TABLE 27 Asia-Pacific Battery Market Size, by Application, 2021–2035 (USD Billion) |
  40. TABLE 28 South America Battery Market Size, by Battery Type, 2021–2035 (USD Billion) |
  41. TABLE 29 South America Battery Market Size, by Technology, 2021–2035 (USD Billion) |
  42. TABLE 30 South America Battery Market Size, by Application, 2021–2035 (USD Billion) |
  43. TABLE 31 Middle East & Africa Battery Market Size, by Battery Type, 2021–2035 (USD Billion) |
  44. TABLE 32 Middle East & Africa Battery Market Size, by Technology, 2021–2035 (USD Billion) |
  45. TABLE 33 Middle East & Africa Battery Market Size, by Application, 2021–2035 (USD Billion)
  46. 13 LIST OF FIGURES |
  47. FIGURE 1 Global Battery Market Dynamics Overview |
  48. FIGURE 2 Battery Industry Value Chain Analysis |
  49. FIGURE 3 Porter's Five Forces Analysis — Global Battery Market |
  50. FIGURE 4 Global Battery Market Size Trend (USD Billion), 2021–2035 |
  51. FIGURE 5 Global Battery Market Share, by Battery Type (2025) |
  52. FIGURE 6 Global Battery Market Share, by Technology (2025) |
  53. FIGURE 7 Global Battery Market Share, by Application (2025) |
  54. FIGURE 8 Global Battery Market Share, by Region (2025) |
  55. FIGURE 9 North America Battery Market Size Trend, 2021–2035 |
  56. FIGURE 10 Europe Battery Market Size Trend, 2021–2035 |
  57. FIGURE 11 Asia-Pacific Battery Market Size Trend, 2021–2035 |
  58. FIGURE 12 South America Battery Market Size Trend, 2021–2035 |
  59. FIGURE 13 Middle East & Africa Battery Market Size Trend, 2021–2035 |
  60. FIGURE 14 Competitive Landscape — Global Battery Market (Market Share Heatmap) |
  61. FIGURE 15 Battery Technology Roadmap (2025–2035)

Segmentation Quick Reference

DimensionSub-SegmentsDominant SegmentFastest Growing Segment
Battery TypePrimary, SecondarySecondary (Rechargeable)Secondary (Rechargeable)
TechnologyLead-Acid, Li-Ion, Nickel-Metal Hydride, Nickel-Cadmium, Sodium-Sulfur, Solid-State, Flow Battery, Emerging ChemistriesLithium-IonSolid-State
ApplicationAutomotive, Industrial, Portable, Power Tools, SLI, Other ApplicationsAutomotiveIndustrial
GeographyNorth America, Europe, Asia-Pacific, South America, Middle East & AfricaAsia-PacificAsia-Pacific


Market Segmentation Overview

By Battery Type

Sub-SegmentKey Trend
Primary (Non-Rechargeable)Stable demand from medical devices, military, and remote sensors; limited growth trajectory
Secondary (Rechargeable)Dominant and fastest-growing; driven by EV mandates and grid storage procurement cycles


Secondary batteries account for the overwhelming majority of global battery revenue and are expanding at the fastest rate within this dimension. Primary battery demand remains resilient in niche applications where recharging infrastructure is unavailable or impractical.

By Technology

Sub-SegmentKey Trend
Lead-AcidMature segment sustained by SLI aftermarket and industrial UPS demand
Lithium-IonDominant technology across EV, ESS, and consumer electronics applications
Nickel-Metal HydrideDeclining hybrid vehicle demand; stable in specialty power tool applications
Nickel-CadmiumLegacy aviation and rail; declining due to environmental regulations
Sodium-SulfurNiche grid-scale storage; high operating temperature limits broader adoption
Solid-StateFastest-growing chemistry; pilot-to-commercial transition expected 2027–2029
Flow BatteryMulti-hour stationary storage; vanadium and zinc-bromine dominate
Emerging ChemistriesSodium-ion and lithium-sulfur gaining traction in cost-sensitive segments


Lithium-ion technology leads by revenue share, benefiting from mature supply chains and continuous incremental improvements in energy density. Solid-state chemistries represent the most anticipated technology disruption, promising higher energy density, faster charging, and improved safety profiles.

By Application

Sub-SegmentKey Trend
AutomotiveLargest segment by revenue; driven by global EV adoption mandates
IndustrialFastest CAGR; data center UPS and telecom backup propel growth
PortableMature but steady; smartphone and laptop replacement cycles sustain demand
Power ToolsCordless professional tool penetration accelerating in construction and landscaping
SLI (Starting, Lighting, Ignition)Stable aftermarket demand; transitioning from lead-acid to low-voltage lithium
Other ApplicationsMilitary, marine, and aerospace applications driving premium battery demand


Automotive applications dominate the Battery Market by revenue share, underpinned by government mandates phasing out internal combustion engines across major economies. The industrial segment delivers the fastest growth rate, as data center operators and telecom providers invest heavily in reliable, clean backup power solutions.

By Geography

Sub-SegmentKey Trend
North AmericaIRA-driven reshoring; rapid gigafactory build-out across the U.S. Sun Belt
EuropeEU Battery Regulation compliance driving supply chain transparency
Asia-PacificManufacturing dominance; China and India lead production and demand growth
South AmericaLithium extraction hub; nascent domestic EV market development
Middle East & AfricaOff-grid electrification and renewable storage deployment accelerating


Asia-Pacific commands the largest regional share, anchored by China's vertically integrated manufacturing ecosystem and India's ambitious production incentive programs. North America and Europe are investing aggressively to reduce import dependence and build resilient domestic supply chains.




Download PDF ×

We do not share your information with anyone. However, we may send you emails based on your report interest from time to time. You may contact us at any time to opt-out.