Banking as a Service Market (2026 - 2035)

ID: MRFR/BS/9233-HCR 200 Pages Aarti Dhapte Last Updated: November 11, 2026

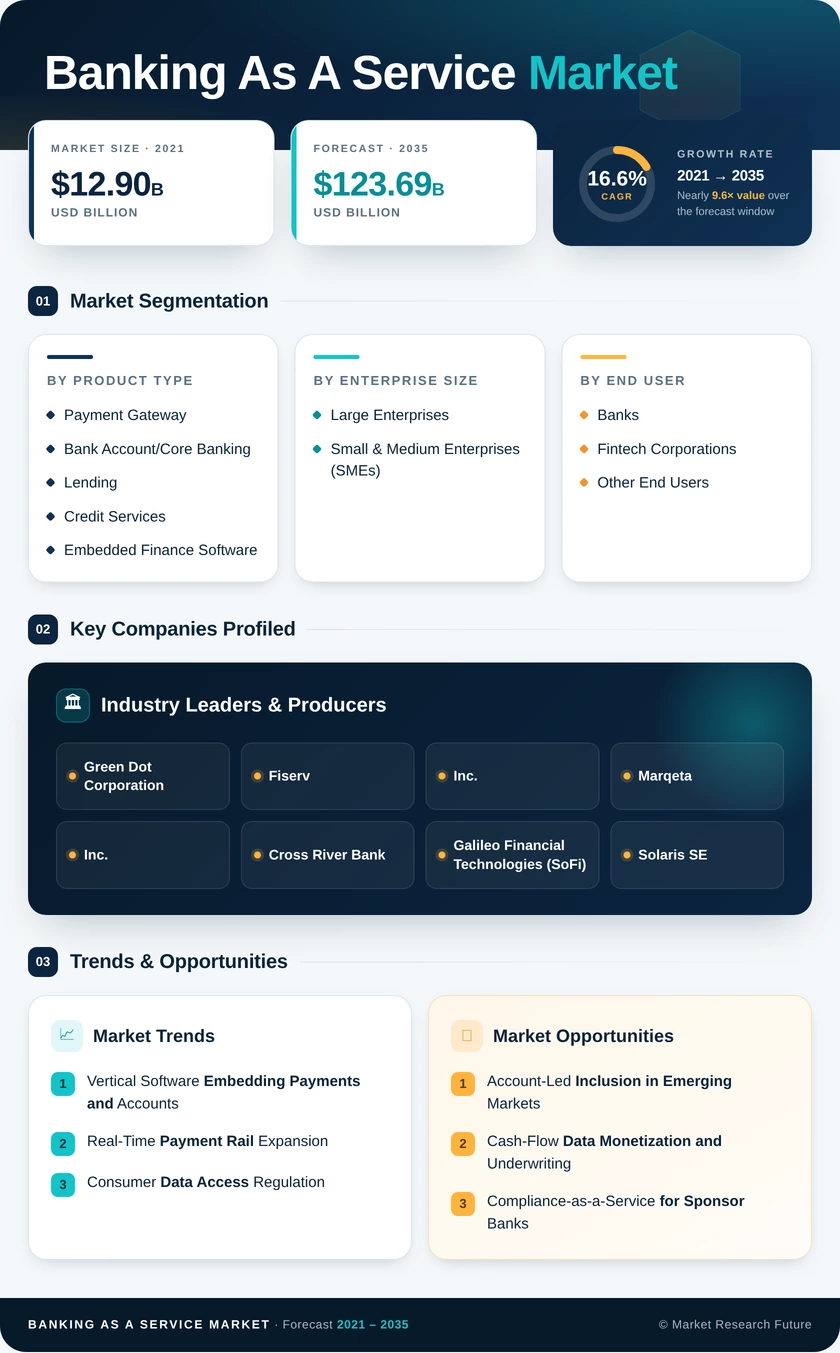
Banking as a Service Market Size, Share and Research Report By Product Type (Payment Gateway, Core Banking, Lending and Credit Services, Embedded Finance), Enterprise Size (Large Enterprises, SMEs), End User (Banks, Fintech Corporations, Others), Component (Platform and Infrastructure, Compliance and KYC Services) and Regional (North America, Europe, Asia-Pacific, South America, Middle East & Africa) - Industry Forecast to 2035.

Banking as a Service Market
Market Size
Forecast Period2026-2035
CAGR (2026-2035)16.6%
2025 Market SizeUSD 26.60 Billion
2035 Market SizeUSD 123.69 Billion
Key Players
Green Dot Corporation
Fiserv, Inc.
Marqeta, Inc.
Cross River Bank
Galileo Financial Technologies
Solaris SE
Opportunities
  • Account-Led Inclusion in Emerging Markets
  • Cash-Flow Data Monetization and Underwriting
  • Compliance-as-a-Service for Sponsor Banks
  1. 1 Market Summary | |
  2. 2 Key Report Takeaways | |
    1. 2.1 By Product Type | |
    2. 2.2 By Enterprise Size | |
    3. 2.3 By End User | |
    4. 2.4 By Component | |
    5. 2.5 By Region | |
  3. 3 Market Size and Forecast (2021–2035) | |
    1. 3.1 Historical Market Size (2021–2025) | |
    2. 3.2 Forecast Market Size (2026–2035) | |
    3. 3.3 Year-over-Year Growth Analysis | |
  4. 4 Driver Impact Analysis | |
    1. 4.1 Vertical Software Embedding Payments and Accounts | |
    2. 4.2 Real-Time Payment Rail Expansion | |
    3. 4.3 Consumer Data Access Regulation | |
    4. 4.4 Embedded Consumer and Merchant Credit | |
    5. 4.5 SME Digitization Through Software Distribution | |
    6. 4.6 Incumbent Core Modernization and Charter Licensing | |
    7. 4.7 Financial Inclusion in Emerging Markets | |
  5. 5 Restraints Impact Analysis | |
    1. 5.1 Sponsor-Bank Enforcement and Consent Orders | |
    2. 5.2 Middleware Ledger and Reconciliation Failures | |
    3. 5.3 Interchange Fee Compression | |
    4. 5.4 Fragmented Licensing and Data Localization | |
    5. 5.5 Rising Fraud and Reimbursement Liability | |
  6. 6 Opportunities | |
    1. 6.1 Account-Led Inclusion in Emerging Markets | |
    2. 6.2 Cash-Flow Data Monetization and Underwriting | |
    3. 6.3 Compliance-as-a-Service for Sponsor Banks | |
    4. 6.4 B2B Payables and Virtual Card Programs | |
    5. 6.5 Tokenized Deposits and Stablecoin Settlement | |
  7. 7 Regional Market Share and Country-Level Analysis | |
    1. 7.1 North America | | |
      1. 7.1.1 United States | | |
      2. 7.1.2 Canada | | |
      3. 7.1.3 Mexico | |
    2. 7.2 Europe | | |
      1. 7.2.1 United Kingdom | | |
      2. 7.2.2 Germany | | |
      3. 7.2.3 France | | |
      4. 7.2.4 Spain | | |
      5. 7.2.5 Italy | | |
      6. 7.2.6 Benelux (Belgium, Netherlands, and Luxembourg) | | |
      7. 7.2.7 Nordics (Sweden, Norway, Denmark, Finland, and Iceland) | | |
      8. 7.2.8 Rest of Europe | |
    3. 7.3 Asia-Pacific | | |
      1. 7.3.1 China | | |
      2. 7.3.2 India | | |
      3. 7.3.3 Japan | | |
      4. 7.3.4 South Korea | | |
      5. 7.3.5 Australia | | |
      6. 7.3.6 South-East Asia (Singapore, Indonesia, Malaysia, Thailand, Vietnam, and Philippines) | | |
      7. 7.3.7 Rest of Asia-Pacific | |
    4. 7.4 South America | | |
      1. 7.4.1 Brazil | | |
      2. 7.4.2 Argentina | | |
      3. 7.4.3 Chile | | |
      4. 7.4.4 Colombia | | |
      5. 7.4.5 Rest of South America | |
    5. 7.5 Middle East and Africa | | |
      1. 7.5.1 United Arab Emirates | | |
      2. 7.5.2 Saudi Arabia | | |
      3. 7.5.3 South Africa | | |
      4. 7.5.4 Nigeria | | |
      5. 7.5.5 Rest of Middle East and Africa | |
  8. 8 Future Outlook (2026–2035) | |
    1. 8.1 AI-Driven Compliance and Underwriting | |
    2. 8.2 Consolidation of the Bank-Fintech Operating Model | |
    3. 8.3 Tokenized Money and Programmable Settlement | |
    4. 8.4 Cross-Border Real-Time Interlinking | |
  9. 9 Segmentation Analysis | |
    1. 9.1 By Product Type | | |
      1. 9.1.1 Payment Gateway | | |
      2. 9.1.2 Bank Account/Core Banking | | |
      3. 9.1.3 Lending and Credit Services | | |
      4. 9.1.4 Embedded Finance Software | | |
      5. 9.1.5 Other Product Types | |
    2. 9.2 By Enterprise Size | | |
      1. 9.2.1 Large Enterprises | | |
      2. 9.2.2 Small & Medium Enterprises (SMEs) | |
    3. 9.3 By End User | | |
      1. 9.3.1 Banks | | |
      2. 9.3.2 Fintech Corporations | | |
      3. 9.3.3 Other End Users | |
    4. 9.4 By Component | | |
      1. 9.4.1 Platform / Infrastructure | | |
      2. 9.4.2 Services (Compliance, KYC, Fraud, etc.) | |
  10. 10 Competitive Landscape | |
    1. 10.1 Market Concentration Analysis | |
    2. 10.2 Competitive Benchmarking Matrix | |
    3. 10.3 Company Profiles | | |
      1. 10.3.1 Green Dot Corporation | | |
      2. 10.3.2 Fiserv, Inc. | | |
      3. 10.3.3 Marqeta, Inc. | | |
      4. 10.3.4 Cross River Bank | | |
      5. 10.3.5 Galileo Financial Technologies | | |
      6. 10.3.6 Solaris SE | | |
      7. 10.3.7 Railsr | | |
      8. 10.3.8 Treezor | | |
      9. 10.3.9 ClearBank | | |
      10. 10.3.10 Unit Finance | | |
      11. 10.3.11 Synctera | |
  11. 11 Recent News & Developments | |
  12. 12 Report Scope and Methodology | |
  13. 13 Detailed Sources and Citations | |
  14. 14 Frequently Asked Questions (FAQs) | | LIST OF TABLES | |
  15. TABLE 1 Global Market Size & Forecast, by Revenue (USD Billion), 2021–2035 | |
  16. TABLE 2 Global Market — Year-over-Year Growth Analysis, 2021–2035 | |
  17. TABLE 3 Driver Impact Analysis | |
  18. TABLE 4 Restraints Impact Analysis | |
  19. TABLE 5 Global Market Size, by Region, 2025 | |
  20. TABLE 6 North America Market, by Country, 2025 | |
  21. TABLE 7 Europe Market, by Country, 2025 | |
  22. TABLE 8 Asia-Pacific Market, by Country, 2025 | |
  23. TABLE 9 South America Market, by Country, 2025 | |
  24. TABLE 10 Middle East and Africa Market, by Country, 2025 | |
  25. TABLE 11 Global Market, by Product Type, 2025 | |
  26. TABLE 12 Global Market, by Enterprise Size, 2025 | |
  27. TABLE 13 Global Market, by End User, 2025 | |
  28. TABLE 14 Global Market, by Component, 2025 | |
  29. TABLE 15 Competitive Benchmarking Matrix, 2025 | |
  30. TABLE 16 Report Scope and Methodology | |
  31. TABLE 17 Detailed Sources and Citations | |
  32. TABLE 18 Segmentation Quick Reference | | LIST OF FIGURES | |
  33. FIGURE 1 Market Dynamics Overview — Drivers, Restraints, Opportunities | |
  34. FIGURE 2 Industry Value Chain Analysis | |
  35. FIGURE 3 Porter's Five Forces Analysis | |
  36. FIGURE 4 Global Market Size Trend (USD Billion), 2021–2035 | |
  37. FIGURE 5 Market Share, by Product Type, 2025 | |
  38. FIGURE 6 Market Share, by Enterprise Size, 2025 | |
  39. FIGURE 7 Market Share, by End User, 2025 | |
  40. FIGURE 8 Market Share, by Component, 2025 | |
  41. FIGURE 9 Regional Market Share, 2025 | |
  42. FIGURE 10 Regional Growth Comparison, 2026–2035 | |
  43. FIGURE 11 Competitive Landscape — Estimated Revenue Share Ranges, 2025 | |
  44. FIGURE 12 Recent Strategic Developments Timeline, 2024–2025

Segmentation Quick Reference

DimensionSub-SegmentsDominant SegmentFastest Growing Segment
By Product TypePayment Gateway; Bank Account/Core Banking; Lending and Credit Services; Embedded Finance Software; Other Product TypesPayment Gateway (31.6% share)Embedded Finance Software (20.5% CAGR)
By Enterprise SizeLarge Enterprises; Small & Medium Enterprises (SMEs)Large Enterprises (58.1% share)Small & Medium Enterprises (SMEs) (19.1% CAGR)
By End UserBanks; Fintech Corporations; Other End UsersFintech Corporations (largest share)Fintech Corporations (20.1% CAGR)
By ComponentPlatform / Infrastructure; Services (Compliance, KYC, Fraud, etc.)Platform / Infrastructure (64.3% share)Services (Compliance, KYC, Fraud, etc.) (18.4% CAGR)
By RegionNorth America; Europe; Asia-Pacific; South America; Middle East and AfricaNorth America (38.4% share)Asia-Pacific (19.2% CAGR)

Market Segmentation Overview

By Product Type

Sub-SegmentKey Trend
Payment GatewayVirtual cards and instant payouts embedded in procurement and marketplaces
Bank Account/Core BankingAPI-delivered deposit accounts with built-in ledgers and KYC
Lending and Credit ServicesInstallment credit at checkout and cash-flow-based underwriting
Embedded Finance SoftwareVertical software vendors adding lending and acceptance modules
Other Product TypesTreasury, FX, and wealth features exposed through APIs

Payment Gateway leads this dimension because virtual card and payout volumes generate steady interchange and processing fees from day one. Embedded Finance Software grows fastest as vertical software vendors turn existing user bases into lending and acceptance customers. Bank Account/Core Banking and Lending and Credit Services sit underneath both, supplying the accounts and credit lines that payment features depend on.

By Enterprise Size

Sub-SegmentKey Trend
Large EnterprisesMulti-entity treasury orchestration and ERP-integrated payouts
Small & Medium Enterprises (SMEs)Banking bundled into accounting and point-of-sale software

Large Enterprises dominate spend because their treasury, audit, and resilience requirements justify bank-grade API orchestration. Small & Medium Enterprises (SMEs) grow faster as they adopt accounts, cards, and reconciliation inside software they already use. Bank programs designed for software-led SME distribution are accelerating this shift.

By End User

Sub-SegmentKey Trend
BanksCo-branded programs to win deposits and commercial clients
Fintech CorporationsRapid neobank, payments, and lending launches on modular rails
Other End UsersRetailers and telcos adding wallets and cards

Fintech Corporations hold the largest position and grow fastest, since neobanks and lenders depend on partner charters to launch products quickly. Banks act as both suppliers and buyers, using co-branded programs to gather deposits. Other End Users such as retailers and telcos represent a widening pool of non-financial brands entering the market.

By Component

Sub-SegmentKey Trend
Platform / InfrastructureUsage-based ledger, card processing, and account API fees
Services (Compliance, KYC, Fraud, etc.)Managed oversight driven by enforcement and fraud liability

Platform / Infrastructure captures most revenue because ledgers and processing scale directly with transaction volume. Services (Compliance, KYC, Fraud, etc.) grow faster as sponsor-bank enforcement and UK reimbursement rules make outsourced monitoring essential. Buyers increasingly evaluate providers on control quality as much as API coverage.


Download PDF ×

We do not share your information with anyone. However, we may send you emails based on your report interest from time to time. You may contact us at any time to opt-out.