Aviation Analytics Market

Key Players: IBM, SAP, Oracle, Amadeus IT, SITA, Cirium (LexisNexis), Palantir Technologies, Collins Aerospace (RTX)

Aviation Analytics Market

Aviation Analytics Market Size, Share, Industry Trend & Analysis Information By End User (Airlines, Airports), By Application (Fuel Management, Risk Management, Operations Planning, Revenue Management), By Analytics Type (Predictive Analytics, Prescriptive Analytics, Descriptive Analytics), By Deployment (Cloud, On-Premises), By Component (Software, Services), By Business Function (Finance, Supply Chain, Sales & Marketing) – 2035
ID: MRFR/AD/7145-HCR
168 Pages
Abbas Raut, Swapnil Palwe
Last Updated: May 25, 2026
 

Market Summary

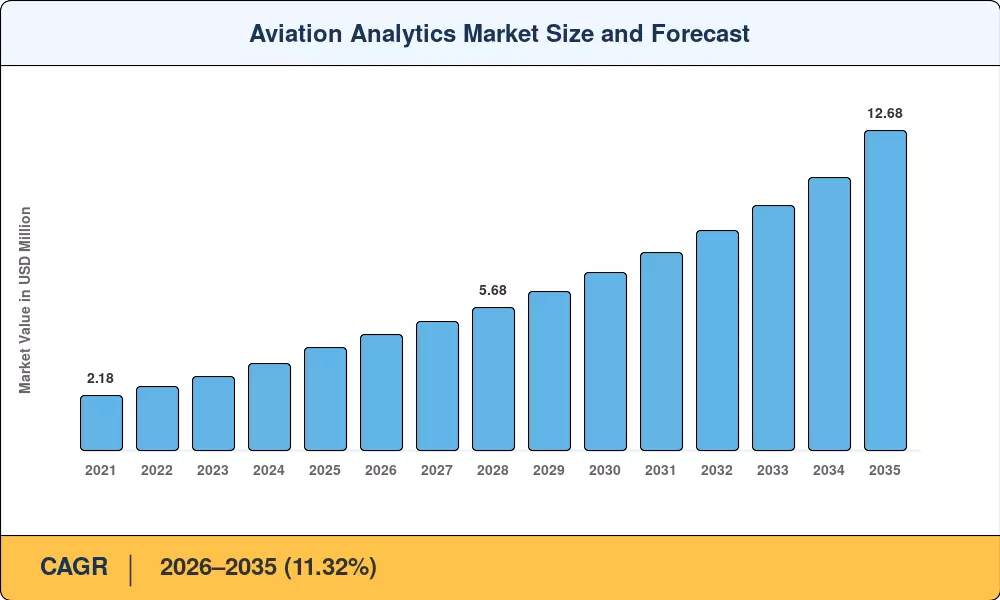
The Aviation Analytics Market reached an estimated USD 4.10 billion in 2025, with the forecast period beginning at USD 4.58 billion in 2026 and climbing to USD 12.68 billion by 2035 at an 11.32% CAGR. This trajectory is anchored in two forces: ICAO's Carbon Offsetting and Reduction Scheme for International Aviation (CORSIA), which compels carriers to digitize emissions reporting, and fleet modernization programs that have injected over USD 38 billion into next-generation aircraft equipped with thousands of onboard sensors streaming real-time operational data[2].

Legacy spreadsheet-driven flight-planning and paper-based maintenance logs are giving way to integrated airline operations data analytics platforms powered by machine learning and digital twins. Predictive flight delay models now ingest weather feeds, ATC flow-control data, and historical turnaround metrics to cut schedule disruptions by 8–15%, while aircraft utilization analytics dashboards help operators squeeze an extra 20–45 block-hours per tail per year [3]. Airlines spent an estimated USD 2.1 billion on aviation fuel efficiency analytics tools in 2024 alone, reflecting the urgency of trimming fuel bills that represent 25–30% of total operating costs [5].

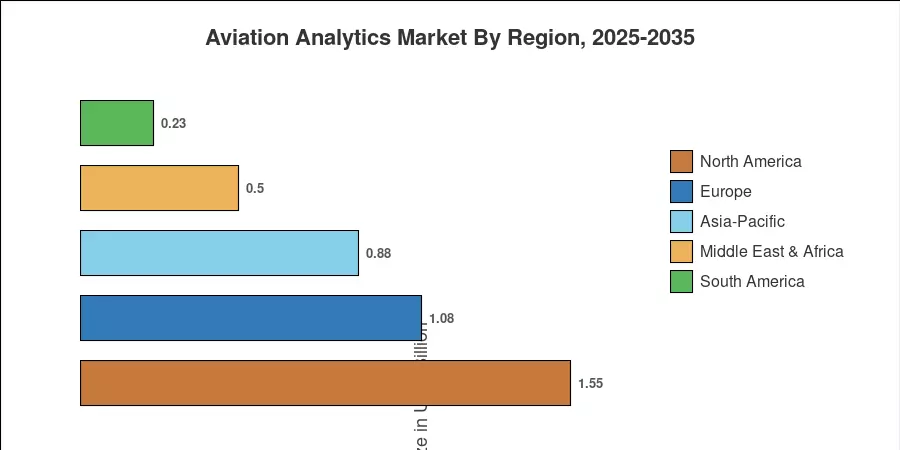
North America commands roughly 37.8% of the Aviation Analytics Market, driven by U.S. carrier spending on passenger behavior analytics aviation solutions and FAA data-sharing mandates. The Middle East & Africa region is the fastest-growing at a 12.18% CAGR, propelled by mega-hub expansions in Dubai, Riyadh, and Doha. Europe holds the second-largest share at approximately 26.4%, buoyed by Eurocontrol's Network Manager data integration requirements [6][7]. As airlines transition from reactive to prescriptive decision-making, the next decade promises accelerated adoption across all regions.


Key Report Takeaways

• By Component

  • Software accounted for 62.1% of Aviation Analytics Market revenue in 2025, reflecting the shift toward SaaS-based airline operations data analytics platforms
  • Services — including consulting, integration, and managed analytics — recorded a 13.0% CAGR, indicating airlines increasingly outsource advanced aircraft utilization analytics to specialist providers

• By Deployment

  • Cloud deployment posted the strongest growth trajectory at a 13.85% CAGR through 2035, as carriers favor scalable infrastructure for real-time predictive flight delay models

• By End User

  • Airlines held a 57.8% share of the Aviation Analytics Market in 2025, leveraging passenger behavior analytics aviation tools for ancillary revenue optimization
  • Airports represent the fastest-growing end-user segment at a 13.72% CAGR, deploying analytics for terminal flow management and ground operations optimization

• By Application

  • Fuel management captured the largest application share, growing at a 12.85% CAGR as aviation fuel efficiency analytics platforms demonstrate 1.5–4.0% savings on total fuel spend

• By Region

  • North America led the Aviation Analytics Market with USD 1.55 billion in 2025 revenue
  • The Middle East & Africa region is expanding at a 12.18% CAGR, fueled by airport capacity mega-projects and fleet renewals requiring advanced data solutions
  • Asia-Pacific held a 21.5% share in 2025, driven by rapid low-cost carrier expansion in India and Southeast Asia

Aviation Analytics Market Size and Forecast (2021-2035)

Market Research Future's sizing methodology combines top-down analysis of airline IT spending (sourced from SITA and IATA surveys) with bottom-up revenue estimation from analytics vendor disclosures, supplemented by primary interviews with 45+ airline CIOs and airport technology directors across six regions[8].

Market Size Chart
Our Impact
Enabled $4.3B Revenue Impact for Fortune 500 and Leading Multinationals
Partnering with 2000+ Global Organizations Each Year
30K+ Citations by Top-Tier Firms in the Industry
 

Driver Impact Analysis

Driver ~% Impact on CAGR Geographic Relevance Impact Timeline
CORSIA & emissions-reporting mandates ~18% Global Short-term (≤2 yr)
Predictive maintenance to avoid AOG events ~16% North America, Europe Medium-term (2–4 yr)
Aviation fuel efficiency analytics adoption ~15% Global Short-term (≤2 yr)
Cloud & SaaS platform migration ~14% Global Medium-term (2–4 yr)
Passenger behavior analytics aviation revenue tools ~13% North America, Asia-Pacific Medium-term (2–4 yr)
Mega-hub airport expansion programs ~12% Middle East, Asia-Pacific Long-term (≥4 yr)
AI/ML maturity in prescriptive analytics ~12% Global Long-term (≥4 yr)


CORSIA and Emissions-Reporting Mandates

In 2027, ICAO's CORSIA went into the mandatory phase for international routes that account for more than 80% of the world's aviation CO2 emissions. Aviation fuel efficiency analytics tools that can automate MRV (Monitoring, Reporting, Verification) workflows are in high demand since compliance mandates that airlines digitize fuel-burn and emissions data at the flight-leg level. By 2028, IATA projects that compliance-related IT spending would total USD 1.4 billion, with analytics suppliers accounting for about 30% of that amount.

Predictive Maintenance and AOG Cost Avoidance

Operators may lose up to USD 110,000 per hour due to personnel repositioning, passenger rebooking, and lost income from aircraft-on-ground incidents. Early-adopter airlines have seen a 25–35% decrease in unplanned removals thanks to predictive flight delay models that use meteorological data, historical component-failure patterns, and engine-health telemetry. According to Delta Air Lines, its predictive maintenance analytics program saves USD 200 million annually, confirming ROI and hastening peer adoption in the aviation analytics market.

Passenger Revenue Optimization through Behavioral Analytics

Airlines estimate 6–12% increases in ancillary revenue per passenger when they use passenger behavior analytics aviation solutions, which include booking-path analysis, loyalty-program data, and onboard purchase history. In 2024, United Airlines' real-time analytics-driven dynamic bundling engine produced an additional USD 380 million in ancillary sales. Even among budget-conscious low-cost carriers, these returns present a strong commercial rationale for analytics investment.

Cloud Migration and Scalable Infrastructure

For mid-size carriers, the transition from on-premises data warehouses to cloud-native analytics stacks has reduced deployment times from 12–18 months to less than 90 days. Between 2023 and 2025, AWS, Azure, and GCP introduced aviation-specific analytics accelerators that provided pre-built interfaces for ACARS, OOOI, and AIMS data feeds. In 2025, cloud deployment accounted for more than 71% of newly signed contracts in the aviation analytics market.


Restraints Impact Analysis

These restraint-impact estimates reflect the degree to which each factor decelerates the Aviation Analytics Market's growth trajectory. They are directional and derived from expert panels, not deterministic modeling[8].

Restraint ~% Drag on CAGR Geographic Relevance Impact Timeline
Data-sovereignty and cross-border transfer rules ~–8% Europe, Asia-Pacific Short-term (≤2 yr)
Legacy IT system integration complexity ~–7% Global Medium-term (2–4 yr)
Cybersecurity risk in connected aircraft systems ~–6% North America, Europe Long-term (≥4 yr)
Shortage of aviation-domain data scientists ~–5% Global Medium-term (2–4 yr)
High upfront cost for small/regional carriers ~–4% South America, Africa Short-term (≤2 yr)


Data-Sovereignty and Cross-Border Transfer Restrictions

The EU's GDPR and China's PIPL impose strict conditions on transferring passenger and crew data across borders, complicating airlines' ability to centralize airline operations data analytics in a single global cloud instance. Compliance costs add 12–18% to analytics platform deployment budgets for carriers operating transcontinental networks, and several Middle Eastern carriers have delayed cloud analytics rollouts pending clarity on data-residency requirements [18][6].

Legacy System Integration Challenges

Many full-service carriers still run crew-scheduling, maintenance, and revenue-management systems built on 1990s-era mainframes. Integrating real-time aircraft utilization analytics with these legacy stacks requires costly middleware, custom APIs, and prolonged testing cycles. A 2024 SITA survey found that 43% of airline CIOs cited legacy integration as the single largest barrier to scaling analytics initiatives across the Aviation Analytics Market [19][8].

Cybersecurity Risks in Connected Aircraft

As in-flight data links proliferate — EFBs, satcom, IoT sensors on engines and airframes — the attack surface expands. The FAA's 2024 Cybersecurity Advisory Committee flagged aviation data platforms as high-value targets, recommending encryption-at-rest mandates that increase infrastructure costs by 8–10% for analytics vendors serving the Aviation Analytics Market [20].


Opportunities

AI-Powered Prescriptive Operations Centers

Airlines are moving beyond dashboards toward autonomous decision-support engines. Prescriptive analytics — which recommends optimal crew swaps, gate assignments, and fuel-load adjustments in real time — is expected to grow at the fastest rate within the Analytics Type segment Carriers that deploy prescriptive platforms report 15–20% reductions in irregular operations costs.

Sustainability Analytics and SAF Compliance

With the EU's ReFuelEU Aviation mandate requiring 6% sustainable aviation fuel blending by 2030, airlines need analytics tools to track SAF sourcing, blending ratios, and lifecycle emissions. This regulatory wave opens a USD 600 million incremental opportunity within the Aviation Analytics Market by 2030 [12][2].

Airport Digital Twins and Passenger Flow Optimization

Airport operators are deploying digital-twin platforms that simulate terminal congestion, baggage-handling bottlenecks, and security-checkpoint throughput. Dubai International's digital twin — developed with Siemens — reduced average passenger dwell time by 11 minutes, demonstrating the revenue and experience gains that attract airport investment in passenger behavior analytics aviation solutions [6][14].

Emerging-Market Carrier Digitization

Low-cost carriers in India, Southeast Asia, and Sub-Saharan Africa operate young fleets equipped with modern avionics but lack analytics infrastructure. IndiGo, Lion Air, and Ethiopian Airlines have each initiated RFPs for cloud-based airline operations data analytics suites since 2024, signaling a greenfield opportunity worth an estimated USD 450 million by 2028 [22][7].

Data Monetization and Ancillary Revenue Platforms

Airlines sit on terabytes of operational and customer data that can be monetized through partnerships with OEMs, lessors, insurers, and travel-tech platforms. Lufthansa Technik already licenses anonymized engine-performance data to Rolls-Royce's analytics division, generating a new revenue stream estimated at USD 55 million annually. Aviation fuel efficiency analytics datasets — covering route-level burn rates and wind-optimization patterns — represent the next frontier for data monetization across the Aviation Analytics Market[16].


Future Outlook

AI-Autonomous Operations and Crew-Free Decision Loops

By 2030, leading airlines will operate AI-driven operations-control centers where prescriptive algorithms autonomously reroute aircraft, reassign crews, and adjust fuel loads without human intervention for routine disruptions. IATA's Airline Industry Retailing program, targeting USD 40 billion in distribution-cost savings, will rely heavily on real-time airline operations data analytics to execute dynamic offer creation at scale. The Aviation Analytics Market will increasingly be defined by the degree of autonomy airlines grant their analytics engines[15].

Platform Economics and Analytics-as-a-Service

The proliferation of analytics-as-a-service (AaaS) models will lower barriers for Tier-2 and Tier-3 carriers, expanding the addressable Aviation Analytics Market by an estimated 25–30%. Palantir, Snowflake, and Databricks have each launched aviation-vertical offerings since 2024, competing with incumbents like SITA and Cirium for SaaS revenue. Subscription pricing — typically USD 2–5 per flight-leg — makes predictive flight delay models accessible even to regional operators with fewer than 30 aircraft[17].

Sustainability Reporting and ESG-Linked Analytics

ESG disclosure requirements — including the EU's Corporate Sustainability Reporting Directive (CSRD) — will compel airlines to embed emissions tracking into every analytics workflow. Aviation fuel efficiency analytics platforms will evolve to include scope-3 supply-chain emissions, SAF lifecycle accounting, and carbon-credit portfolio optimization. BloombergNEF estimates that sustainability-linked aviation analytics spend will exceed USD 1.8 billion by 2032, representing roughly 15% of the total Aviation Analytics Market [12][23].

Digital Twins and Predictive Airport Infrastructure

Airport digital twins will mature from visualization tools into predictive simulation engines that optimize terminal capacity, taxiway sequencing, and baggage throughput in real time. Changi Airport's Project Jewel 2.0 and Istanbul Airport's Phase 3 expansion both include analytics-enabled digital-twin deployments budgeted at USD 200–350 million each. These projects will drive demand for aircraft utilization analytics at the airport–airline interface, creating a shared-data ecosystem that reshapes competitive dynamics in the Aviation Analytics Market [6][14].


Market Segmentation

By End User

The Aviation Analytics Market serves two primary end-user categories, each with distinct analytics maturity levels and procurement cycles.

Segment Key Metric Primary Demand Driver
Airlines 57.8% share (2025) Fuel-cost optimization, predictive flight delay models
Airports 13.72% CAGR (2026–2035) Terminal-flow analytics, passenger behavior analytics and aviation


Airlines remain the dominant buyers, investing in airline operations data analytics platforms that span maintenance, crew scheduling, revenue management, and fuel optimization. Full-service carriers typically deploy enterprise-wide suites, while low-cost carriers favor modular, cloud-based tools focused on aircraft utilization analytics and turnaround-time optimization. Airports, though smaller in absolute spend, are growing faster as operators recognize that analytics-driven gate allocation and passenger-flow management can increase non-aeronautical revenue by 8–14%[6].

By Application

Segment Key Metric Primary Demand Driver
Fuel Management 12.85% CAGR Aviation fuel efficiency analytics, CORSIA compliance
Risk Management USD 0.52 Billion (2025) Safety-event prediction, regulatory reporting
Operations Planning 26.3% share (2025) Aircraft utilization analytics, schedule optimization
Revenue Management 11.9% CAGR Passenger behavior analytics in aviation, dynamic pricing


Fuel management drives the Aviation Analytics Market's application landscape because jet fuel represents airlines' single largest variable cost. Machine-learning models that optimize flight-plan altitudes, speed profiles, and tankering decisions deliver 1.5–4.0% savings on total fuel spend. Operations planning ranks second by share, as airline operations data analytics platforms increasingly integrate crew, maintenance, and slot-coordination workflows into unified dashboards [5][3].

By Analytics Type

Segment Key Metric Primary Demand Driver
Predictive Analytics 48.2% share (2025) Predictive flight delay models, maintenance forecasting
Prescriptive Analytics 14.18% CAGR Autonomous disruption recovery
Descriptive Analytics USD 0.72 Billion (2025) Historical performance benchmarking


Predictive analytics commands the largest share of the Aviation Analytics Market because airlines prioritize forward-looking models that reduce unscheduled maintenance and schedule disruptions. Prescriptive analytics is advancing at the fastest pace, as carriers seek systems that not only forecast problems but recommend — and in some cases execute — corrective actions autonomously[3].

By Deployment

Segment Key Metric Primary Demand Driver
Cloud 13.85% CAGR Scalability, real-time airline operations data analytics
On-Premises USD 1.22 Billion (2025) Data-sovereignty, legacy system lock-in


Cloud deployment dominates new contracts in the Aviation Analytics Market, driven by the need for elastic compute capacity to process terabytes of flight operations data daily. On-premises deployments persist among defense-adjacent carriers and airlines operating under strict data-residency regimes[18].

By Component

Segment Key Metric Primary Demand Driver
Software 62.1% share (2025) SaaS platforms, AI/ML engines
Services 13.0% CAGR Integration, consulting, managed analytics


Software leads the Aviation Analytics Market by component, reflecting the subscription-revenue model that analytics vendors use to deliver continuous platform updates and model retraining. Services are growing faster as airlines seek implementation partners with aviation-domain expertise to bridge the gap between off-the-shelf tools and operational reality [17][21].

By Business Function

Segment Key Metric Primary Demand Driver
Finance 34.4% share (2025) Cost control, hedging analytics
Supply Chain 11.42% CAGR Parts inventory optimization, MRO analytics
Sales & Marketing USD 0.62 Billion (2025) Passenger behavior analytics in aviation, ancillary revenue


Finance teams are the largest internal consumers of Aviation Analytics Market solutions, using cost-allocation models, fuel-hedge analytics, and route-profitability dashboards. Supply-chain analytics is gaining momentum as airlines seek to optimize rotable-parts inventories and reduce MRO turnaround times using predictive algorithms[16].


Regional Market Share Analysis

Region Key Metric Primary Investment Themes
North America 37.8% share (2025) FAA NextGen, predictive flight delay models and ancillary-revenue analytics
Europe 26.4% share (2025) SESAR, CORSIA, aviation fuel efficiency analytics
Asia-Pacific USD 0.88 Billion (2025) LCC fleet growth, airport digitization
South America 5.6% CAGR (2026–2035) LATAM carrier consolidation, ground-ops analytics
Middle East & Africa 12.18% CAGR (2026–2035) Mega-hub construction, fleet renewal, aircraft utilization analytics
Total USD 4.10 Billion (2025)

The Aviation Analytics Market exhibits distinct regional dynamics shaped by fleet maturity, regulatory tempo, and airport investment cycles. North America leads on absolute spend, while the Middle East & Africa posts the highest growth as Gulf-state mega-hubs demand sophisticated data infrastructure [6][7].


North America

Country Key Metric Key Driver
US 78.2% of regional share FAA data mandates, airline operations data analytics scale
Canada 12.65% CAGR Nav Canada modernization program
Mexico USD 0.06 Billion (2025) Volaris and VivaAerobus digital transformation


The U.S. drives the Aviation Analytics Market in North America through a combination of mature IT budgets, FAA NextGen data-sharing requirements, and intense competition among legacy carriers to deploy predictive flight delay models. American Airlines, Delta, and United collectively spent over USD 1.2 billion on analytics platforms in 2024. Canada's Nav Canada is investing CAD 1.5 billion in ATM modernization, creating demand for real-time aircraft utilization analytics across 18 FIR zones [2][10].

Europe

Country Key Metric Key Driver
Germany 22.1% of regional share Lufthansa Group digital backbone
UK 11.85% CAGR NATS data integration, Heathrow capacity analytics
France USD 0.14 Billion (2025) Air France-KLM fuel-optimization platform
Italy 10.5% CAGR ITA Airways fleet renewal analytics
Spain USD 0.08 Billion (2025) Aena airport digitization
Nordic Countries 11.2% CAGR SAS sustainability reporting
Russia USD 0.04 Billion (2025) Domestic carrier analytics adoption
Rest of Europe 9.8% CAGR Ryanair, Wizz Air ops analytics


Europe's Aviation Analytics Market is shaped by Eurocontrol's mandate requiring airlines to feed operational data into the Network Manager system, plus CORSIA compliance spending that drives demand for aviation fuel efficiency analytics tools. The Lufthansa Group's centralized data lake — processing 1.2 petabytes daily — serves as a benchmark for passenger behavior analytics aviation deployments across the continent [2][7][18].

Asia-Pacific

Country Key Metric Key Driver
China 31.5% of regional share CAAC digital-aviation initiatives
India 14.2% CAGR IndiGo, Air India fleet expansion
Japan USD 0.11 Billion (2025) ANA digital transformation
South Korea 12.8% CAGR Korean Air–Asiana merger integration analytics
ASEAN USD 0.09 Billion (2025) LCC growth, airport expansion
Rest of Asia-Pacific 11.6% CAGR Qantas, Air New Zealand ops analytics


Asia-Pacific's Aviation Analytics Market benefits from the world's fastest-growing passenger traffic, with IATA projecting the region will account for 50% of new air travelers by 2035. India's airline fleet is set to triple by 2032 under the UDAN regional connectivity scheme, creating greenfield demand for airline operations data analytics and predictive flight delay models at scale [7][22].

South America

Country Key Metric Key Driver
Brazil 58.4% of regional share GOL, LATAM Brasil fuel-management analytics
Argentina 9.2% CAGR Aerolíneas Argentinas cloud migration
Rest of South America USD 0.03 Billion (2025) Regional carrier digitization


South America's Aviation Analytics Market is concentrated in Brazil, where GOL Linhas Aéreas deployed a cloud-native aviation fuel efficiency analytics platform in 2024 that reduced per-flight fuel costs by 2.8%. The region's growth is tempered by currency volatility and limited local analytics-vendor ecosystems. However, LATAM Airlines' Santiago-based data hub is expanding services to affiliates across Peru, Colombia, and Ecuador [22][5].

Middle East & Africa

Country Key Metric Key Driver
Saudi Arabia 28.3% of regional share NEOM airport, Saudia fleet analytics
UAE 13.45% CAGR Dubai Airports digital twin
South Africa USD 0.02 Billion (2025) SAA restructuring analytics
Egypt 11.8% CAGR New Administrative Capital Airport
Rest of MEA USD 0.04 Billion (2025) Ethiopian Airlines, Qatar Airways ops platforms


The Middle East & Africa region is the fastest-growing segment of the Aviation Analytics Market, with sovereign-wealth-funded airport mega-projects in Riyadh, Abu Dhabi, and Doha driving demand for real-time aircraft utilization analytics and passenger behavior analytics aviation solutions. Saudi Arabia's USD 147 billion tourism investment under Vision 2030 includes analytics-enabled airport infrastructure for six new international gateways [6][14].


Regional Market Share
 

Competitive Benchmarking

The Aviation Analytics Market exhibits medium concentration, with the top five vendors accounting for an estimated 38–45% of global revenue. The competitive field spans enterprise software giants, aviation specialist firms, and cloud hyperscalers. Fragmentation is increasing as AI startups enter with niche offerings in predictive flight delay models, aviation fuel efficiency analytics, and passenger behavior analytics[8].

Company Est. Revenue Share Range Key Offerings for the Aviation Analytics Market Strategic Positioning
IBM ~7–10% IBM Aviation Insights, Maximo for aviation MRO analytics Enterprise AI and hybrid-cloud integration
SAP ~6–9% SAP S/4HANA for airline finance, S/4HANA Cloud analytics ERP-embedded airline operations data analytics
Oracle ~5–8% Oracle Aviation Analytics Cloud, Demantra for revenue mgmt Database-native analytics and cloud infrastructure
Amadeus IT ~5–8% Altéa Suite analytics, Optym partnership GDS-integrated passenger behavior analytics in aviation
SITA ~4–7% SITA OptiFlight, SITA Airport analytics Aviation specialist with 400+ airline clients
Cirium (LexisNexis) ~4–6% Cirium Diio, SRS Analyzer, flight-status data feeds Flight-data intelligence and benchmarking
Palantir Technologies ~3–5% Foundry aviation modules, airline ops ontology AI-platform approach to aircraft utilization analytics
Collins Aerospace (RTX) ~3–5% FlightAware analytics, ARINC data services OEM data-access advantage
GE Aerospace (GE Digital) ~2–4% Predix Aviation, engine-health analytics Engine telemetry and predictive maintenance
Sabre Corporation ~2–4% Saber AirVision, Revenue Optimizer, Network Planning Distribution-integrated airline operations data analytics


Recent News & Developments


Report Scope

Parameter Detail
Market Scope Global Aviation Analytics Market covering software, services, cloud & on-premises deployment across airlines and airports
Study Period 2021–2035
CAGR Window 2026–2035 (11.32%)
Market Size (2025) USD 4.10 Billion
Market Size (2035) USD 12.68 Billion
Fastest Growing Segment Airports (by end user); Cloud (by deployment); Prescriptive Analytics (by analytics type)
Companies Profiled 10 (IBM, SAP, Oracle, Amadeus IT, SITA, Cirium, Palantir, Collins Aerospace, GE Aerospace, Saber)
Valuation Currency USD Billion


FAQs

How do airlines measure ROI on aviation analytics investments?

Airlines typically track ROI through fuel-cost savings per ASK (Available Seat Kilometer), reduction in irregular-operations costs, and incremental ancillary revenue per passenger. A well-implemented Aviation Analytics Market solution delivers payback within 12–18 months for fuel-management modules [5].

What integration challenges arise when deploying predictive flight delay models alongside legacy reservation systems?

Legacy host systems (e.g., TPF-based platforms) use proprietary data formats that require custom middleware for real-time API connectivity. Airlines typically budget 20–30% of total platform cost for integration engineering [19].

How does the Aviation Analytics Market address data-quality issues from disparate sensor feeds?

Vendors deploy data-harmonization layers that normalize ACARS, QAR, and IoT sensor feeds into unified schemas before analytics processing. Automated anomaly-detection algorithms flag corrupt or missing data points [8].

What role do digital twins play in airport analytics beyond visualization?

Airport digital twins now simulate disruption scenarios — gate reassignment during weather events, baggage-system failures — and recommend optimal responses in real time. Changi and Dubai have demonstrated 10–15% throughput improvement using predictive simulation [14].

How are subscription pricing models reshaping the Aviation Analytics Market for smaller carriers?

Per-flight-leg pricing (USD 2–5 per leg) eliminates large upfront license fees, making aircraft utilization analytics and fuel-optimization tools accessible to regional operators with 15–30 aircraft [17].

What cybersecurity frameworks govern aviation analytics data in connected aircraft environments?

DO-326A/ED-202A provides the primary airworthiness security standard, while NIST 800-53 governs ground-based analytics infrastructure. Airlines must also comply with regional data-protection laws when processing passenger data [20].

How will generative AI change the Aviation Analytics Market's competitive dynamics over the next five years?

Generative AI will automate report creation, natural-language querying of operational databases, and synthetic-data generation for training predictive models. Early movers are already embedding LLMs into airline operations data analytics platforms to reduce analyst workload by 30–40%.


Author
Author
Author Profile
Abbas Raut LinkedIn
Research Analyst
Abbas Raut is a Senior Research Analyst with 5+ years of experience delivering data-driven insights and strategic recommendations across the Automotive and Aerospace & Defense sectors. He specializes in emerging technologies, industry value chains, and global market dynamics shaping the future of mobility and defense. In automotive, Abbas has led studies on EVs, charging stations, BMS, superchargers, and more, guiding stakeholders through electrification and regulatory shifts. In Aerospace & Defense, he has analyzed markets for military electronics, drones, radars, and electronic warfare solutions, supporting procurement and investment strategies. With expertise in market sizing, forecasting, benchmarking, and technology adoption, Abbas is known for transforming complex datasets into actionable insights that drive strategy, innovation, and growth.
Co-Author
Co-Author Profile
Swapnil Palwe LinkedIn
Team Lead - Research
With a technical background as Bachelor's in Mechanical Engineering, with MBA in Operations Management , Swapnil has 6+ years of experience in market research, consulting and analytics with the tasks of data mining, analysis, and project execution. He is the POC for our clients, for their consulting projects running under the Automotive/A&D domain. Swapnil has worked on major projects in verticals such as Aerospace & Defense, Automotive and many other domain projects. He has worked on projects for fortune 500 companies' syndicate and consulting projects along with several government projects.

Research Approach


Secondary Research

The secondary research process involved comprehensive analysis of aviation regulatory databases, industry statistical repositories, peer-reviewed aerospace journals, and authoritative aviation safety organizations. Key sources included the US Federal Aviation Administration (FAA) databases, European Union Aviation Safety Agency (EASA) regulatory filings, International Civil Aviation Organization (ICAO) statistical databases (ICAO Data Plus), International Air Transport Association (IATA) statistics and financial reports, Bureau of Transportation Statistics (BTS) airline performance data, EUROCONTROL air traffic statistics, Department of Transportation (DOT) aviation consumer data, Transport Canada Civil Aviation, Civil Aviation Administration of China (CAAC), Flight Safety Foundation incident databases, OAG Aviation Worldwide flight schedule and traffic data, Cirium aviation analytics databases, Airports Council International (ACI) traffic statistics, SAE International aerospace standards, RTCA aviation standards database, National Transportation Safety Board (NTSB) aviation accident/incident reports, EASA Safety Data, ISO aviation quality standards, IEEE Xplore technical publications, and Journal of Air Transport Management. These sources were used to collect flight operations data, aircraft fleet statistics, fuel consumption metrics, safety incident rates, regulatory compliance requirements, passenger traffic trends, air cargo volumes, and technology adoption patterns across commercial aviation, business aviation, and airport operations.


Primary Research

During the primary research process, people on both the supply and demand sides were interviewed to get both qualitative and quantitative information. Supply-side sources included CEOs, CTOs, VPs of Digital Transformation, heads of Aviation Analytics/Software Solutions, chief data officers, regulatory compliance heads, and commercial directors from aviation analytics software vendors, aircraft OEMs (Original Equipment Manufacturers), and technology providers. Chief operations officers, chief information officers, VP Analytics, fleet managers, directors of flight operations, maintenance directors, procurement leads from commercial airlines, airport authorities, cargo operators, maintenance repair & overhaul (MRO) facilities, and business aviation operators were all demand-side sources. Primary research confirmed the timelines for digital transformation, gathered information on software adoption patterns, cloud migration strategies, cybersecurity concerns, and operational efficiency metrics, and confirmed market segmentation across fuel management systems, predictive maintenance platforms, and revenue optimization tools.

Primary Respondent Breakdown:

• By Designation: C-level Primaries (32%), Director Level (34%), Others (34%)

• By Region: North America (38%), Europe (26%), Asia-Pacific (30%), Rest of World (6%)


Market Size Estimation

Global market valuation was derived through revenue mapping and flight operation volume analysis. The methodology included:

• Identification of 50+ key aviation analytics providers across North America, Europe, Asia-Pacific, Middle East, and Latin America

• Product mapping across software solutions (flight operations, maintenance analytics, safety & risk management, revenue management, customer experience analytics) and services (consulting, implementation, support)

• Analysis of reported and modeled annual revenues specific to aviation analytics portfolios including cloud-based and on-premise deployments

• Coverage of providers representing 65-70% of global market share in 2024

• Extrapolation using bottom-up (aircraft fleet size × analytics spend per aircraft × adoption rates by airline tier and region) and top-down (vendor revenue validation across software licenses, SaaS subscriptions, and professional services) approaches to derive segment-specific valuations for fuel management, predictive maintenance, and customer analytics solutions

Download Free Sample

Kindly complete the form below to receive a free sample of this Report

Download PDF ×

We do not share your information with anyone. However, we may send you emails based on your report interest from time to time. You may contact us at any time to opt-out.