Segmentation Quick Reference
| Dimension | Sub-Segments | Dominant Segment | Fastest Growing Segment |
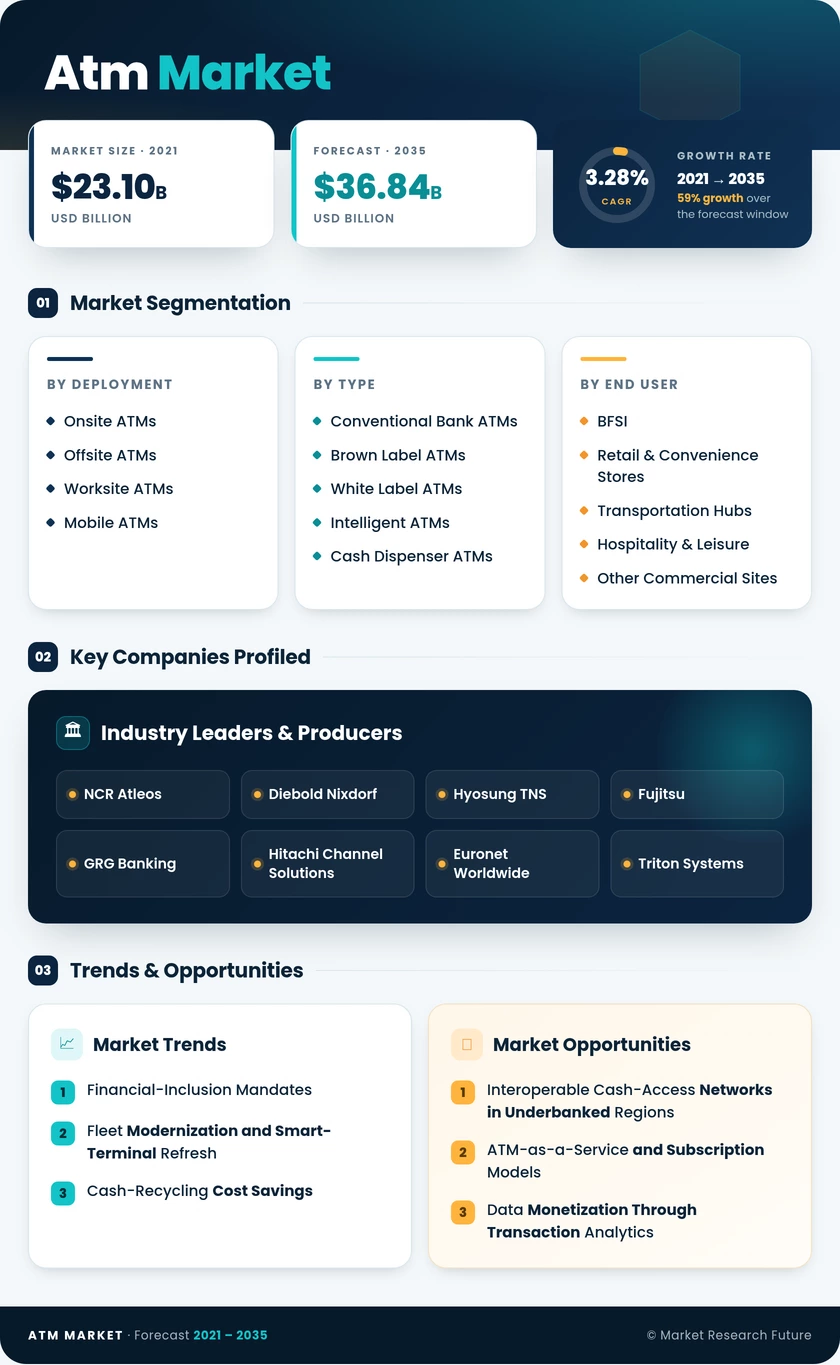
| By Deployment | Onsite ATMs, Offsite ATMs, Worksite ATMs, Mobile ATMs | Offsite ATMs | Mobile ATMs |
| By Type | Conventional Bank ATMs, Brown Label ATMs, White Label ATMs, Intelligent ATMs, Cash Dispenser ATMs | Cash Dispenser ATMs | Intelligent ATMs |
| By End User | BFSI, Retail & Convenience Stores, Transportation Hubs, Hospitality & Leisure, Other Commercial Sites | BFSI | Retail & Convenience Stores |
| By Service Model | Deployment Solutions, Managed ATM Services | Deployment Solutions | Managed ATM Services |
| By Region | North America, Europe, Asia-Pacific, South America, Middle East & Africa | Asia-Pacific | North America |
Market Segmentation Overview
By Deployment
| Sub-Segment | Key Trend |
| Onsite ATMs | Branch optimization driving selective upgrades to smart terminals |
| Offsite ATMs | Independent deployers expanding retail and convenience-store networks |
| Worksite ATMs | Corporate campuses integrating multi-service kiosks for employee convenience |
| Mobile ATMs | Disaster-response and event-based demand driving rapid-deployment innovation |
Deployment strategy is shifting toward offsite and mobile configurations as banks rationalize branch footprints and non-bank operators fill geographic gaps. Mobile units are gaining traction as governments mandate emergency cash-access preparedness.
By Type
| Sub-Segment | Key Trend |
| Conventional Bank ATMs | Steady replacement with next-generation platforms |
| Brown Label ATMs | Outsourced hardware management gaining traction among mid-tier banks |
| White Label ATMs | Non-bank operators scaling rapidly in India and Latin America |
| Intelligent ATMs | Multi-function service menus replacing teller interactions |
| Cash Dispenser ATMs | Low-cost single-function units dominating volume in emerging markets |
The type landscape reflects a bifurcation between cost-optimized cash dispensers for high-volume, low-complexity locations and feature-rich intelligent terminals targeting banks that want to expand self-service transaction menus.
By End User
| Sub-Segment | Key Trend |
| Banking & Financial Institutions | Core fleet modernization and managed-service adoption |
| Retail & Convenience Stores | Foot-traffic generation and surcharge-revenue models |
| Transportation Hubs | Multi-currency and contactless upgrades for international travelers |
| Hospitality & Leisure | Casino and resort deployments with high per-transaction values |
| Other Commercial Sites | Healthcare and government facilities adding self-service access |
Retail and convenience end users are the fastest-growing segment as merchants recognize the dual benefit of customer convenience and reduced back-office cash handling.
By Service Model
| Sub-Segment | Key Trend |
| Deployment Solutions | Capex-driven purchases by large banks with in-house operations |
| Managed ATM Services | Full-service outsourcing converting fixed costs to variable expenses |
The service-model split is evolving toward managed services as banks seek to reduce operational complexity. Subscription-based pricing models are lowering entry barriers for smaller institutions.