ID: MRFR/LS/5167-HCR | February 2021 | Region: Global | 85 pages
Market Scenario
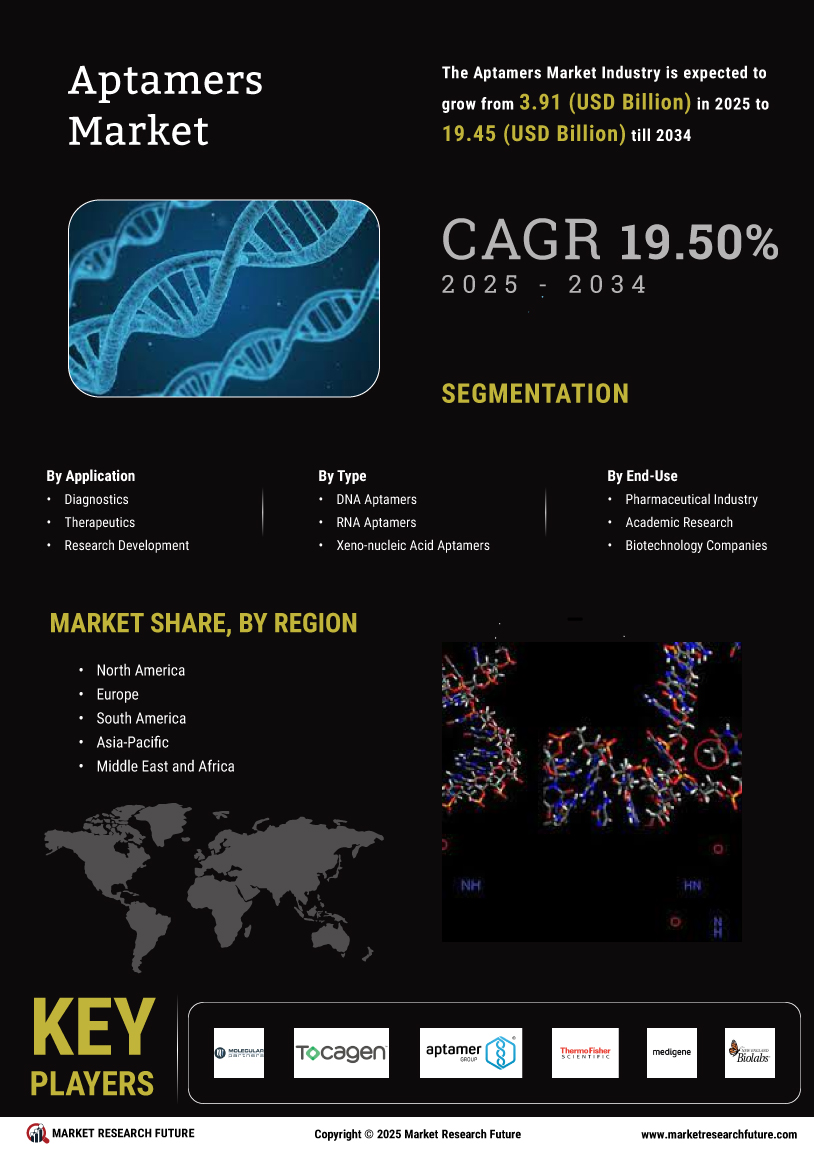
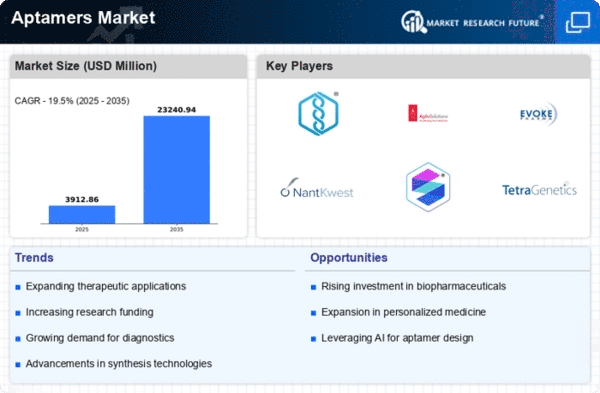
The Global Aptamers Market is expected to register a growth of significant CAGR 20.2% during the forecast period (2018–2023).
Aptamers are peptide molecules which binds to the targeted lipid, protein, or nucleic acid molecules with high specificity. These are generated rapidly and applied in the inhibition, specific detection, and characterization of proteins. Aptamers can be used as detection reagents, pharmaceutical leads, and functional proteomic levels with antibodies, small molecules, and other aptamers. Aptamers can be modified to have higher affinity and specificity to a large number of targets.
Improvements in aptamer development technologies, increasing Research and development expenditure, and an increasing number of companies investing in this market are some of the key driving factors responsible for the growth of this market. Abundant advantages offered by these small molecules, in comparison to established antibodies, have also led to higher demand for these molecules across a wide range of medical applications. They are chemically synthesized, which eliminates batch-to-batch variation and demands less time for development. Along with this, continuous advancement in technologies is expected to stimulate growth. However, aptamers have failed to meet the necessary safety and efficacy standards in clinical studies. Thus, companies had to terminate their clinical investigation during late-stage clinical studies. This factor is likely to hamper the growth of this market. In addition, other factors, such as little awareness about these technologies in middle and low-income countries and inadequate regulatory structure, may hinder the overall growth.
Segmentation
The Global Aptamers Market has been segmented on the basis of type, application, technology and end users.
On the basis of type, the market has been classified as nucleic acid aptamers and peptide aptamers. The nucleic acid aptamers have been segmented into DNA-Based Aptamers, RNA-Based Aptamers.
On the basis of application, the market has been classified as diagnostics, therapeutics development, research and development, other applications
On the basis of technology, the market has been classified as Selex, X-aptamer and MARAS technique.
On the basis of end users, the market has been classified as academic and government research institutes, biotechnology and pharmaceutical companies, contract research organizations and other end users
On the basis of region, the market is segmented into the Americas, Europe, Asia-Pacific, and the Middle East and Africa. The Americas has been further segmented into North America and South America, with the North American market divided into the US and Canada.
The European aptamers market has been segmented into Western Europe and Eastern Europe. Western Europe has further been classified as Germany, France, the UK, Italy, Spain, and the rest of Western Europe.
The aptamers market in Asia-Pacific has been segmented into Japan, China, India, South Korea, Australia, and the rest of Asia-Pacific. The aptamers market in the Middle East and Africa has been segmented into the Middle East and Africa.
Regional Market Summary
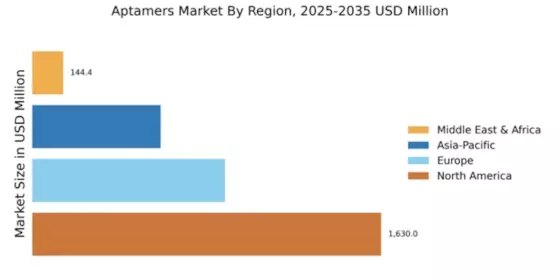
Global Aptamers Market Share, by Region, 2017 (%)
Source: MRFR Analysis
In the aptamers market, North America is anticipated to account for the largest market share due to the early adoption of advanced medical technologies and high investment and funding to support the development of aptamers. The other factor such as the growing demand for aptamer therapeutics coupled with a rise in a number of research laboratories helps to boost the market.
The European market is expected to hold the second largest market share. Factors such as a rise in research expenses, advancement of technology, the decline in human health, and the necessity for innovative and effective therapies boost the growth of the market in this region. The increasing number of small-scale start-ups, government organizations, rising number of products under clinical investigation, and growing number of academic research laboratories investigating the potential of aptamers are anticipated to support future growth of this market.
Whereas the market share in the Asia-Pacific region is also anticipated to experience growth in the near future due to access to optimal treatment facilities and growing demand for increasing government initiatives, advanced technology, better adoption rate, and rising healthcare expenditure.
The market in the Middle East & Africa is expected to account for the smallest share of the global aptamers market due to an underdeveloped healthcare sector, the dearth of technical knowledge, and poor medical facilities.
Key Players
Some of the key players in the global aptamers market are Aptamer Sciences, Inc., Aptagen, LLC, Base Pair Biotechnologies, Inc., Ophthotech Corporation, Am Biotechnologies, LLC, Aptamer Solutions Ltd., Aptus Biotech S.L., Neoventures Biotechnology Inc., Somalogic, Inc., Trilink Biotechnologies, Inc., Vivonics, Inc., Noxxon Pharma, and others.
Global Aptamers Market, by Type
Global Aptamers Market, by Application
Global Aptamers Market, by Technology
Global Aptamers Market, by End Users
Global Aptamers Market, by Region
Intended Audience
Frequently Asked Questions (FAQ) :
The aptamers market is projected to grow at a 20.2% CAGR between 2018-2023.
North America is projected to command the largest share in the aptamers market.
It is widely used in research and development, therapeutics development, and diagnostics.
Increasing R&D expenditure and constant technological advances are adding market growth.
Inadequate regulatory structure may limit market growth.
Table of Contents
Chapter 1. Report Prologue
Chapter 2. Market Introduction
2.1 Definition
2.2 Scope of the Study
2.2.1 Research Objective
2.2.2 Assumptions
2.2.3 Limitations
Chapter 3. Research Methodology
3.1 Introduction
3.2 Primary Research
3.3 Secondary Research
3.4 Market Size Estimation
Chapter 4. Market Dynamics
4.1 Drivers
4.2 Restraints
4.3 Opportunities
4.4 Challenges
4.5 Macroeconomic Indicators
4.6 Technology Trends & Assessment
Chapter 5. Market Factor Analysis
5.1 Porter’s Five Forces Analysis
5.1.1 Bargaining Power of Suppliers
5.1.2 Bargaining Power of Buyers
5.1.3 Threat of New Entrants
5.1.4 Threat of Substitutes
5.1.5 Intensity of Rivalry
5.2 Value Chain Analysis
5.3 Investment Feasibility Analysis
5.4 Pricing Analysis
Chapter 6. Global Aptamers Market, by Type
6.1 Introduction
6.2 Nucleic acid aptamers
6.2.1 DNA-Based Aptamers
Market Estimates & Forecast, by Region, 2020-2027
Market Estimates & Forecast, by Country, 2020-2027
6.2.2 RNA-Based Aptamers
Market Estimates & Forecast, by Region, 2020-2027
Market Estimates & Forecast, by Country, 2020-2027
6.3 Peptide aptamers
Market Estimates & Forecast, by Region, 2020-2027
Market Estimates & Forecast, by Country, 2020-2027
Chapter 7. Global Aptamers Market, by Application
7.1 Introduction
7.2 Diagnostics
Market Estimates & Forecast, by Region, 2020-2027
Market Estimates & Forecast, by Country, 2020-2027
7.3 Therapeutics development
Market Estimates & Forecast, by Region, 2020-2027
Market Estimates & Forecast, by Country, 2020-2027
7.4 Research and development
Market Estimates & Forecast, by Region, 2020-2027
Market Estimates & Forecast, by Country, 2020-2027
7.5 Other applications
Market Estimates & Forecast, by Region, 2020-2027
Market Estimates & Forecast, by Country, 2020-2027
Chapter 8. Global Aptamers Market, by Technology
8.1 Introduction
8.2 Selex
Market Estimates & Forecast, by Region, 2020-2027
Market Estimates & Forecast, by Country, 2020-2027
8.3 X-aptamer
Market Estimates & Forecast, by Region, 2020-2027
Market Estimates & Forecast, by Country, 2020-2027
8.4 MARAS technique
Market Estimates & Forecast, by Region, 2020-2027
Market Estimates & Forecast, by Country, 2020-2027
Chapter 9. Global Aptamers Market, by End-Users
9.1 Introduction
9.2 Academic and government research institutes
Market Estimates & Forecast, by Region, 2020-2027
Market Estimates & Forecast, by Country, 2020-2027
9.3 Biotechnology and pharmaceutical companies
Market Estimates & Forecast, by Region, 2020-2027
Market Estimates & Forecast, by Country, 2020-2027
9.4 Contract research organizations
Market Estimates & Forecast, by Region, 2020-2027
Market Estimates & Forecast, by Country, 2020-2027
9.5 Others
Market Estimates & Forecast, by Region, 2020-2027
Market Estimates & Forecast, by Country, 2020-2027
Chapter 10. Global Aptamers Market, by Region
10.1 Introduction
10.2 Americas
10.2.1 North America:
10.2.1.1 US
10.2.1.2 Canada
10.2.2 South America
10.3 Europe
10.3.1 Western Europe
10.3.1.1 Germany
10.3.1.2 France
10.3.1.3 Italy
10.3.1.4 Spain
10.3.1.5 UK
10.3.1.6 Rest of Western Europe
10.3.2 Eastern Europe
10.4 Asia-Pacific
10.4.1 Japan
10.4.2 China
10.4.3 India
10.4.4 Australia
10.4.5 South Korea
10.4.6 Rest of Asia-Pacific
10.5 Middle East & Africa
10.5.1 Middle East
10.5.2 Africa
Chapter 11. Company Landscape
11.1 Introduction
11.2 Market Share Analysis
11.3 Key Development & Strategies
Chapter 12. Company Profiles
12.1 Aptamer Sciences, Inc.
12.1.1 Company Overview
12.1.2 Type Overview
12.1.3 Financials Overview
12.1.4 Key Developments
12.1.5 SWOT Analysis
12.2 Aptagen, LLC
12.2.1 Company Overview
12.2.2 Type Overview
12.2.3 Financial Overview
12.2.4 Key Developments
10.2.5 SWOT Analysis
12.3 Base Pair Biotechnologies, Inc.
12.3.1 Company Overview
12.3.2 Type Overview
12.3.3 Financial Overview
12.3.4 Key Development
12.3.5 SWOT Analysis
12.4 Ophthotech Corporation
12.4.1 Company Overview
12.4.2 Technology/Business Segment Overview
12.4.3 Financial Overview
12.4.4 Key Development
12.4.5 SWOT Analysis
12.5 Am Biotechnologies, LLC
12.5.1 Company Overview
12.5.2 Type Overview
12.5.3 Financial overview
12.5.4 Key Developments
12.5.5 SWOT Analysis
12.6 Aptamer Solutions Ltd.
12.6.1 Company Overview
12.6.2 Type Overview
12.6.3 Financial Overview
12.6.4 Key Developments
12.6.5 SWOT Analysis
12.7 Aptus Biotech S.L.
12.7.1 Overview
12.7.2 Type Overview
12.7.3 Financial Overview
12.7.4 Key Developments
12.7.5 SWOT Analysis
12.8 Neoventures Biotechnology Inc.
12.8.1 Overview
12.8.2 Type/ Technology Overview
12.8.3 Financials
12.8.4 Key Developments
12.8.5 SWOT Analysis
12.9 Somalogic, Inc.
12.9.1 Overview
12.9.2 Type Overview
12.9.3 Financials
12.9.4 Key Developments
12.9.5 SWOT Analysis
12.10 Trilink Biotechnologies, Inc.
12.10.1 Overview
12.10.2 Type Overview
12.10.3 Financials
12.10.4 Key Developments
12.10.5 SWOT Analysis
12.11 Vivonics, Inc.
12.11.1 Overview
12.11.2 Type Overview
12.11.3 Financials
12.11.4 Key Developments
12.11.5 SWOT Analysis
12.12 Noxxon Pharma
12.12.1 Overview
12.12.2 Type Overview
12.12.3 Financials
12.12.4 Key Developments
12.12.5 SWOT Analysis
12.13 Others
12.13.1 Overview
12.13.2 Type Overview
12.13.3 Financials
12.13.4 Key Developments
12.13.5 SWOT Analysis
Chapter 13 MRFR Conclusion
13.1 Key Findings
13.1.1 From CEO’s Viewpoint
13.1.2 Unmet Needs of the Market
13.2 Key Companies to Watch
13.3 Predictions for the Aptamers Industry
Chapter 14. Appendix
LIST OF TABLES
Table 1 Global Aptamers Market Synopsis, 2020-2027
Table 2 Global Aptamers Market Estimates and Forecast, 2020-2027 (USD Million)
Table 3 Global Aptamers Market, by Region, 2020-2027 (USD Million)
Table 4 Global Aptamers Market, by Type, 2020-2027 (USD Million)
Table 5 Global Aptamers Market, by Application, 2020-2027 (USD Million)
Table 6 Global Aptamers Market, by Technology, 2020-2027 (USD Million)
Table 7 Global Aptamers Market, by End-users, 2020-2027 (USD Million)
Table 8 North America: Aptamers Market, by Type, 2020-2027 (USD
Million)
Table 9 North America: Aptamers Market, by Application, 2020-2027 (USD Million)
Table 10 North America: Aptamers Market, by Technology, 2020-2027 (USD Million)
Table 11 North America: Aptamers Market, by End-users, 2020-2027 (USD Million)
Table 12 US: Aptamers Market, by Type, 2020-2027 (USD Million)
Table 13 US: Aptamers Market, by Application, 2020-2027 (USD Million)
Table 14 US: Aptamers Market, by Technology, 2020-2027 (USD Million)
Table 15 US: Aptamers Market, by End-users, 2020-2027 (USD Million)
Table 16 Canada: Aptamers Market, by Type, 2020-2027 (USD Million)
Table 17 Canada: Aptamers Market, by Application, 2020-2027 (USD Million)
Table 18 Canada: Aptamers Market, by Technology, 2020-2027 (USD Million)
Table 19 Canada: Aptamers Market, by End-users, 2020-2027 (USD Million)
Table 20 South America: Aptamers Market, by Type, 2020-2027 (USD Million)
Table 21 South America: Aptamers Market, by Application, 2020-2027 (USD Million)
Table 22 South America: Aptamers Market, by Technology, 2020-2027 (USD Million)
Table 23 South America: Aptamers Market, by End-users, 2020-2027 (USD Million)
Table 24 Europe: Aptamers Market, by Type, 2020-2027 (USD Million)
Table 25 Europe: Aptamers Market, by Application, 2020-2027 (USD Million)
Table 26 Europe: Aptamers Market, by Technology, 2020-2027 (USD Million)
Table 27 Europe: Aptamers Market, by End-users, 2020-2027 (USD Million)
Table 28 Western Europe: Aptamers Market, by Type, 2020-2027 (USD Million)
Table 29 Western Europe: Aptamers Market, by Application, 2020-2027 (USD Million)
Table 30 Western Europe: Aptamers Market, by Technology, 2020-2027 (USD Million)
Table 31 Western Europe: Aptamers Market, by End-users, 2020-2027 (USD Million)
Table 32 Eastern Europe: Aptamers Market, by Type, 2020-2027 (USD Million)
Table 33 Eastern Europe: Aptamers Market, by Application, 2020-2027 (USD Million)
Table 34 Eastern Europe: Aptamers Market, by Technology, 2020-2027 (USD Million)
Table 35 Eastern Europe: Aptamers Market, by End-users, 2020-2027 (USD Million)
Table 36 Asia-Pacific: Aptamers Market, by Type, 2020-2027 (USD Million)
Table 37 Asia-Pacific: Aptamers Market, by Application, 2020-2027 (USD Million)
Table 38 Asia-Pacific: Aptamers Market, by Technology, 2020-2027 (USD Million)
Table 39 Asia-Pacific: Aptamers Market, by End-users, 2020-2027 (USD Million)
Table 40 Middle East & Africa: Aptamers Market, by Type, 2020-2027 (USD Million)
Table 41 Middle East & Africa: Aptamers Market, by Application, 2020-2027 (USD Million)
Table 42 Middle East & Africa: Aptamers Market, by Technology, 2020-2027 (USD Million)
Table 43 Middle East & Africa: Aptamers Market, by End-users, 2020-2027 (USD Million)
LIST OF FIGURES
Figure 1 Research Process
Figure 2 Segmentation for Global Aptamers Market
Figure 3 Segmentation Market Dynamics for Global Aptamers Market
Figure 4 Global Aptamers Market Share, by Type, 2020
Figure 5 Global Aptamers Market, by End-users, 2020–2027 (USD Million)
Figure 6 Global Aptamers Market Share, by Region, 2020
Figure 7 North America: Aptamers Market Share, by Country, 2020
Figure 8 Europe: Aptamers Market Share, by Country, 2020
Figure 9 Asia-Pacific: Aptamers Market Share, by Country, 2020
Figure 10 Middle East & Africa: Aptamers Market Share, by Country, 2020
Figure 11 Global Aptamers Market: Company Share Analysis, 2020 (%)
Figure 12 Aptamer Sciences, Inc.: Key Financials
Figure 13 Aptamer Sciences, Inc.: Segmental Revenue
Figure 14 Aptamer Sciences, Inc.: Geographical Revenue
Figure 15 Aptagen, LLC: Key Financials
Figure 16 Aptagen, LLC: Segmental Revenue
Figure 17 Aptagen, LLC: Geographical Revenue
Figure 18 Base Pair Biotechnologies, Inc.: Key Financials
Figure 19 Base Pair Biotechnologies, Inc.: Segmental Revenue
Figure 20 Base Pair Biotechnologies, Inc.: Geographical Revenue
Figure 21 Ophthotech Corporation: Key Financials
Figure 22 Ophthotech Corporation: Segmental Revenue
Figure 23 Ophthotech Corporation: Geographical Revenue
Figure 24 Am Biotechnologies, LLC: Key Financials
Figure 25 Am Biotechnologies, LLC: Segmental Revenue
Figure 26 Am Biotechnologies, LLC: Geographical Revenue
Figure 27 Aptamer Solutions Ltd: Key Financials
Figure 28 Aptamer Solutions Ltd: Segmental Revenue
Figure 29 Aptamer Solutions Ltd: Geographical Revenue
Figure 30 Aptus Biotech S.L.: Key Financials
Figure 31 Aptus Biotech S.L.: Segmental Revenue
Figure 32 Aptus Biotech S.L.: Geographical Revenue
Figure 33 Neoventures Biotechnology Inc.: Key Financials
Figure 34 Neoventures Biotechnology Inc.: Segmental Revenue
Figure 35 Neoventures Biotechnology Inc.: Geographical Revenue
Figure 36 Somalogic, Inc.: Key Financials
Figure 37 Somalogic, Inc.: Segmental Revenue
Figure 38 Somalogic, Inc.: Geographical Revenue
Figure 39 Trilink Biotechnologies, Inc.: Key Financials
Figure 40 Trilink Biotechnologies, Inc.: Segmental Revenue
Figure 41 Trilink Biotechnologies, Inc.: Geographical Revenue
Figure 42 Vivonics, Inc.: Key Financials
Figure 43 Vivonics, Inc.: Segmental Revenue
Figure 44 Vivonics, Inc.: Geographical Revenue
Figure 45 Noxxon Pharma: Key Financials
Figure 46 Noxxon Pharma: Segmental Revenue
Figure 47 Noxxon Pharma: Geographical Revenue
Figure 48 Others: Key Financials
Figure 49 Others: Segmental Revenue
Figure 50 Others: Geographical Revenue