APAC Graph Database Market
APAC Graph Database Market Research Report By Application (Social Networking, Fraud Detection, Recommendation Engines, Network and IT Operations, Knowledge Graphs), By Deployment Type (Cloud-Based, On-Premises, Hybrid), By Database Model (Property Graph, Resource Description Framework, Hypergraph), By End Use (BFSI, Healthcare, Telecommunications, Retail, Government) and By Regional (China, India, Japan, South Korea, Malaysia, Thailand, Indonesia, Rest of APAC)- Forecast to 2035
Market Segment Insights
APAC Graph Database Market Segment Insights
Graph Database Market Application Insights
The Application segment of the APAC Graph Database Market showcases a dynamic and evolving landscape that is pivotal for various industries across the region. With an increasing reliance on interconnected data, the significance of graph databases is particularly pronounced in sectors such as Social Networking, Fraud Detection, Recommendation Engines, Network and IT Operations, and Knowledge Graphs.
Social Networking applications lead the charge, driven by the need for real-time user engagement and connectivity, ultimately facilitating enhanced user experiences. The Fraud Detection segment leverages graph databases uniquely to unveil intricate relationships and patterns that traditional databases may miss, thereby playing a critical role in mitigating risks and enhancing security protocols across financial sectors. Meanwhile, Recommendation Engines harness the power of graph databases to provide personalized suggestions, fostering improved customer retention and engagement in ecommerce platforms.
In Network and IT Operations, the ability to visualize and manage complex systems is crucial; graph databases help streamline operations by elucidating network relationships and performance metrics, which is essential for efficient resource allocation and maintenance. Knowledge Graphs, serving as repositories of interconnected information, enable enterprises to derive insights and enhance decision-making processes, thus improving operational efficiency and strategic planning.
As the demand for data-driven solutions grows, the increasing adoption of these applications and their reliance on robust graph database technology is expected to drive significant advancements and market growth within the APAC region. The interplay of these applications within diverse industries leads to opportunities for innovation and improvement, positioning the APAC Graph Database Market as a pivotal element in the evolution of digital solutions aimed at addressing today's complex business challenges.

Graph Database Market Deployment Type Insights
The Deployment Type segment of the APAC Graph Database Market plays a crucial role in shaping the industry's landscape, encompassing various approaches such as Cloud-Based, On-Premises, and Hybrid options. Cloud-Based deployment is gaining traction due to its scalability and flexibility, allowing organizations to efficiently manage large datasets without the need for extensive on-site infrastructure. Meanwhile, On-Premises deployment remains significant for enterprises that prioritize data security and control, offering the advantage of direct management of their resources and compliance with local regulations.
The Hybrid model is emerging as a preferred choice for many businesses, striking a balance between the efficiency of cloud solutions and the security of on-premises systems. This configuration enables organizations to leverage the benefits of both environments, facilitating better data management strategies. With the rapid digitalization within the region, fueled by growing technological advancements and the increasing need for sophisticated data management tools, the APAC Graph Database Market is well-positioned to experience significant growth, driven by these deployment types’ unique advantages and adaptability to diverse business needs.
Graph Database Market Database Model Insights
The Database Model segment within the APAC Graph Database Market plays a critical role in how organizations manage and utilize data relationships effectively. Within this segment, notable categories such as Property Graph, Resource Description Framework, and Hypergraph offer distinct advantages tailored to various applications. The Property Graph model is particularly influential due to its flexible schema and rich data representation, which is essential for dynamic data environments often seen in commercial sectors.
Conversely, the Resource Description Framework excels in semantic web applications, providing a robust structure for data interoperability across diverse platforms, which is vital for industries focusing on data integration.Additionally, the Hypergraph model, while less prevalent, is gaining attention for its ability to capture complex relationships and multi-dimensional data, which can cater to advanced analytics requirements in fields such as scientific research and network analysis.
Overall, this segmentation reflects a critical diversification strategy within the APAC Graph Database Market, catering to the unique needs of various industries looking to harness graph-based solutions for enhanced data insights and decision-making. The continuous evolution of these models aligns with regional growth trends, as organizations increasingly adopt sophisticated database technologies.
Graph Database Market End Use Insights
The APAC Graph Database Market demonstrates significant potential across various industries, notably within the End Use segment, which encompasses sectors such as Banking, Financial Services and Insurance (BFSI), Healthcare, Telecommunications, Retail, and Government. The BFSI sector thrives on graph databases for their ability to analyze complex relationships and detect fraudulent activities efficiently, enhancing security and risk management. In Healthcare, these databases enable the integration of heterogeneous data sources, leading to improved patient outcomes through personalized treatment plans and proactive disease management.
Telecommunications leverages graph databases to optimize network operations and analyze user behavior for targeted marketing. Retail businesses benefit from these databases by enabling personalized shopping experiences, improving customer retention through enhanced data insights, and supply chain optimization. Meanwhile, the Government sector utilizes graph databases for fraud detection, public safety, and resource allocation.
As APAC continues to embrace digital transformation, the collective capabilities of these industries within the graph database landscape underpin the overall market growth and innovation, paving the way for increased efficiency, accuracy, and strategic decision-making.The APAC Graph Database Market segmentation highlights the substantial demand for data-driven solutions that address the unique challenges faced by each of these critical sectors in the region.
Report Scope
| Report Attribute/Metric Source: | Details |
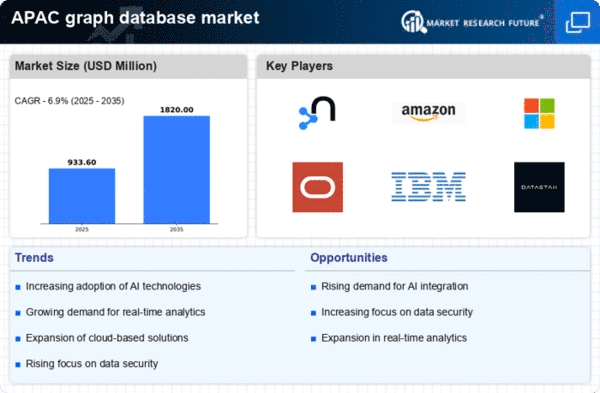
| MARKET SIZE 2023 | 1.22(USD Billion) |
| MARKET SIZE 2024 | 1.31(USD Billion) |
| MARKET SIZE 2035 | 3.0(USD Billion) |
| COMPOUND ANNUAL GROWTH RATE (CAGR) | 7.816% (2025 - 2035) |
| REPORT COVERAGE | Revenue Forecast, Competitive Landscape, Growth Factors, and Trends |
| BASE YEAR | 2024 |
| MARKET FORECAST PERIOD | 2025 - 2035 |
| HISTORICAL DATA | 2019 - 2024 |
| MARKET FORECAST UNITS | USD Billion |
| KEY COMPANIES PROFILED | Oracle, Redis Labs, TigerGraph, Azure Cosmos DB, Couchbase, Datastax, ArangoDB, DataStax, SAP, Citus Data, Fauna, IBM, Amazon, Neo4j, Microsoft |
| SEGMENTS COVERED | Application, Deployment Type, Database Model, End Use, Regional |
| KEY MARKET OPPORTUNITIES | Rising demand for data analytics, Increasing adoption of AI technologies, Expansion of cloud computing solutions, Growth in social network analysis, Enhanced cybersecurity measures integration |
| KEY MARKET DYNAMICS | Rapid data complexity growth, Increasing demand for real-time analytics, Rising adoption of cloud databases, Expanding use in AI applications, Strong focus on data relationships |
| COUNTRIES COVERED | China, India, Japan, South Korea, Malaysia, Thailand, Indonesia, Rest of APAC |
FAQs
What is the market size of the APAC Graph Database Market in 2024?
In 2024, the APAC Graph Database Market is projected to be valued at 1.31 USD Billion.
What is the expected market size of the APAC Graph Database Market by 2035?
By 2035, the APAC Graph Database Market is expected to reach a valuation of 3.0 USD Billion.
What is the expected CAGR for the APAC Graph Database Market from 2025 to 2035?
The APAC Graph Database Market is anticipated to grow at a CAGR of 7.816% from 2025 to 2035.
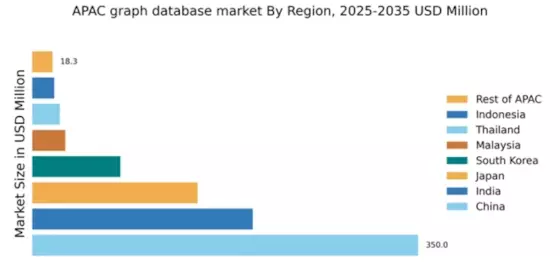
Which region holds the largest market share in the APAC Graph Database Market in 2024?
In 2024, China is expected to hold the largest market share, valued at 0.35 USD Billion.
How much is the APAC Graph Database Market segment for Social Networking valued in 2024?
The Social Networking segment of the APAC Graph Database Market is valued at 0.4 USD Billion in 2024.
What is the forecasted market value for the Fraud Detection application by 2035?
The Fraud Detection application is expected to reach a market value of 0.55 USD Billion by 2035.
What are the key players operating in the APAC Graph Database Market?
Major players in the APAC Graph Database Market include Oracle, Redis Labs, TigerGraph, and Neo4j among others.
How much is the Indian market for Graph Databases expected to grow by 2035?
The Indian market for Graph Databases is projected to grow to 0.66 USD Billion by 2035.
What is the expected market size for the Recommendation Engines application by 2035?
By 2035, the Recommendation Engines application is anticipated to reach a market size of 0.5 USD Billion.
What challenges might affect the growth of the APAC Graph Database Market?
Challenges such as competition from relational databases and data privacy concerns may affect market growth.
Kindly complete the form below to receive a free sample of this Report
Customer Stories
“This is really good guys. Excellent work on a tight deadline. I will continue to use you going forward and recommend you to others. Nice job”
“Thanks. It’s been a pleasure working with you, please use me as reference with any other Intel employees.”
“Thanks for sending the report it gives us a good global view of the Betaïne market.”
“Thank you, this will be very helpful for OQS.”
“We found the report very insightful! we found your research firm very helpful. I'm sending this email to secure our future business.”
“I am very pleased with how market segments have been defined in a relevant way for my purposes (such as "Portable Freezers & refrigerators" and "last-mile"). In general the report is well structured. Thanks very much for your efforts.”
“I have been reading the first document or the study, ,the Global HVAC and FP market report 2021 till 2026. Must say, good info! I have not gone in depth at all parts, but got a good indication of the data inside!”
“We got the report in time, we really thank you for your support in this process. I also thank to all of your team as they did a great job.”
Leave a Comment