ID: MRFR/HC/6110-HCR | February 2021 | Region: Global | 130 pages
Market Scenario
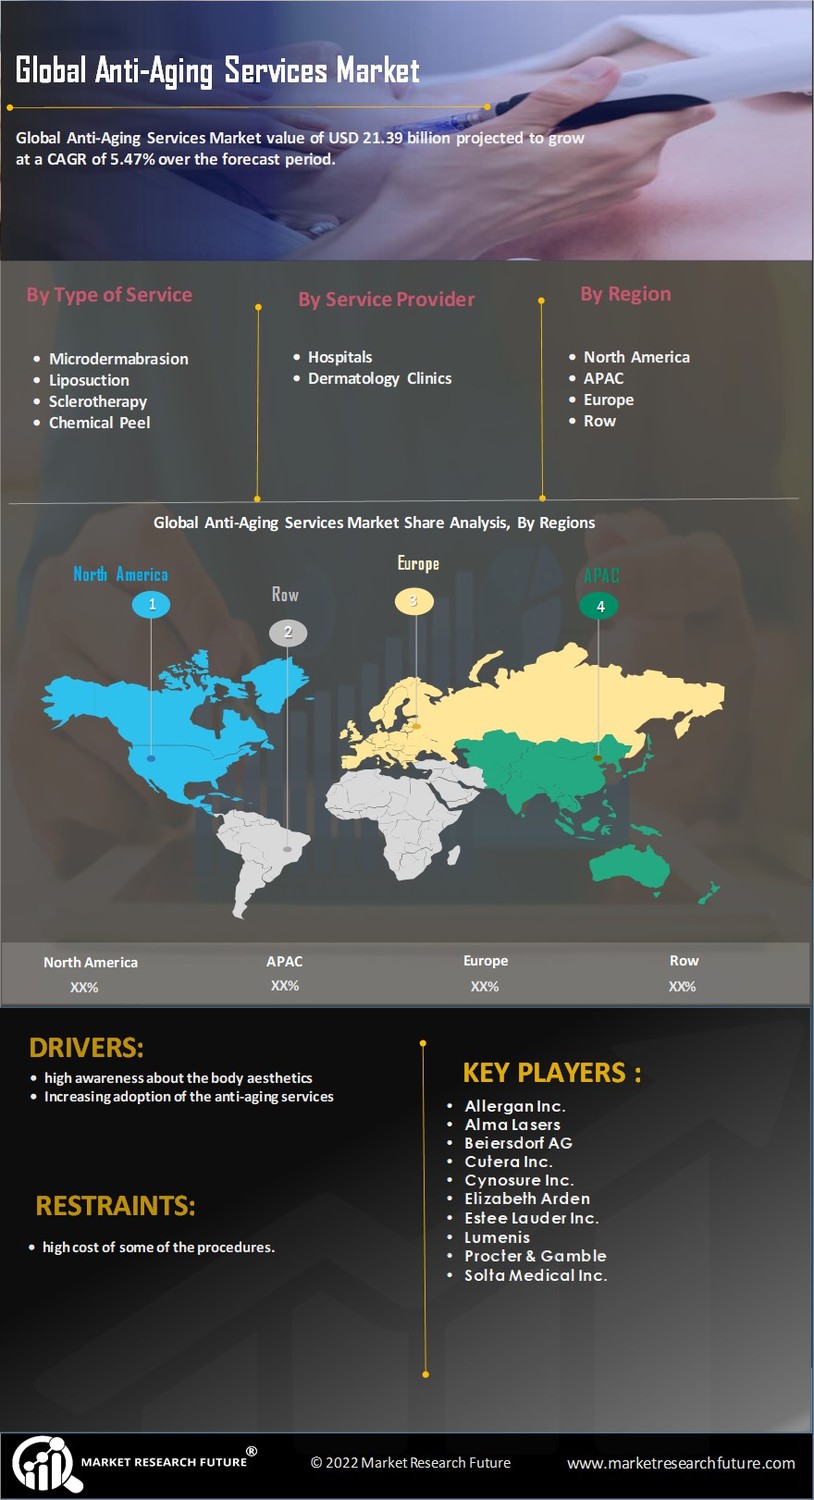
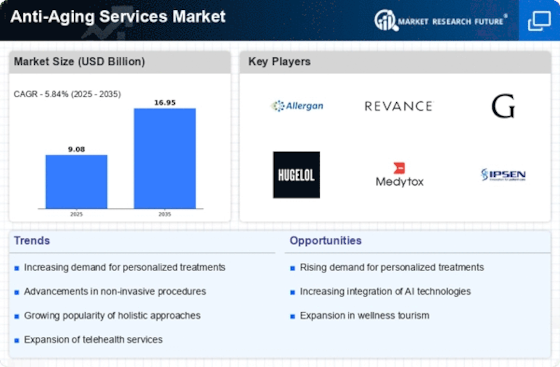
The global anti-aging services market is expected to grow significantly over the forecast period. The market held a market value of USD 21.39 billion in 2017 and is projected to grow at a CAGR of 5.47% over the forecast period.
Aging is damage to the body’s macromolecules, cells, tissues, caused by genomic instability, epigenetic alterations, loss of proteostasis, mitochondrial dysfunction, cellular senescence, stem cell exhaustion, oxidation damage by free radicals etc.
Increasing elderly population, growing desire to stay young is one of the most important factors that drive the growth of the anti-aging services market. According to the world health organization (WHO), the proportion of the world's population over 60 years between 2015 and 2050 will nearly double from 12% to 22%. Further, as per WHO estimates by 2020, the number of people aged 60 years and older will outnumber children younger than 5 years and by 2050, 80% of older people will be living in low- and middle-income countries. Besides that, factors such as growing demand for anti-aging drugs and services, the influence of media and fashion industry, increasing disposable income, growing awareness about the aesthetical industry are driving the market for anti-aging services.
On the other hand, the high cost of some of the procedures, and potential side effects of the anti-aging treatments are some of the factors that thwart the growth of the anti-aging services market to an extent.
Segmentation
The global anti-aging services market has been segmented into type of service and service provider.
Based on type of service, the market has been segmented into microdermabrasion, breast augmentation, liposuction, chemical peel, sclerotherapy, intense pulsed light, Botox treatment, dermal fillers, and others. The microdermabrasion segment is expected to account for the largest share in the global anti-aging services market in 2017. This large share is majorly attributed to the wider acceptance of the procedure, increasing acceptance in different regions, better patient compliance and better results as compared to other services. The liposuction segment is projected to hold the second largest market during the forecast period of 2018 to 2023.
Based on service providers, the market has been segmented into hospitals, dermatology clinics, salons, and others. The dermatology clinics segment is expected to account for the largest share in the global anti-aging services market in 2017 followed by hospitals segment. The major share of the dermatology clinics is mainly attributed to the wide range of anti-aging services provided by these specialty clinics and
Based on the regions, the market for hair removal devices is segmented into, the Americas, Europe, Asia-Pacific, and the Middle East & Africa. The anti-aging services market in the Americas region has further been segmented into North America and Latin America, where-in the North American market is further divided into the US and Canada.
European Anti-aging Services Market has been segmented into Western Europe and Eastern Europe where-in Western Europe region is further divided into Germany, France, the UK, Italy, Spain, and the rest of Western Europe.
The Anti-aging Services Market in Asia-Pacific has been segmented into Japan, China, India, South Korea, Australia, and the rest of Asia-Pacific. The Anti-aging Services Market in the Middle East & Africa has been segmented into regions such as the Middle East and Africa.
Regional Market Summary
Global Anti-aging Services Market Share (%), by Region, 2017
Source: White Papers, Company Presentations, Annual Reports
Geographically, the Americas is anticipated to dominate the global Anti-aging Services Market owing to the well-developed healthcare infrastructure, high disposable income, high awareness about the body aesthetics, and increasing adoption of the anti-aging services by people in the US. Moreover, the huge influence of the fashion and film industry in the US has played an important role in generating demand for the beauty and aesthetic services including anti-aging. All these factors are responsible for the growth in the region.
Europe is expected to hold the second largest market share in the global Anti-aging Services Market. The market growth in this region is majorly attributed to the growing popularity of aesthetic treatments, a high number of old age people, and increasing acceptance of anti-aging treatments in the region. Similarly, the Asia-Pacific region has observed a rapid growth in the anti-aging services market owing to the growing disposable income and demand for cost-effective anti-aging service. Besides, increasing beauty consciousness in developing countries and rapidly growing medical tourism industry is also expected to generate growth opportunities in the untapped markets of the Asia-Pacific region. The Middle East & Africa region is anticipated to show minor growth opportunities in the anti-aging services market during the forecast period.
Global Anti-Aging Services Market, by Type of Service
Global Anti-Aging Services Market, by Service Provider
Global Anti-Aging Services Market, by Region
Global Anti-Aging Services Market, by Key Players
Intended Audience
Frequently Asked Questions (FAQ) :
The global anti-aging services market was valued at USD 21.39 billion in 2017.
The market is expected to exhibit a strong 5.47% CAGR over the forecast period from 2018 to 2023. q
The increasing geriatric population is likely to be the major driver for the global anti-aging services market.
The high cost of some procedures and the risk of adverse side effects are the major restraints on the global anti-aging services market.
The Americas and Europe dominate the global anti-aging services market due to the growing geriatric population in the region and the high disposable income of the same.
Table of Contents:
Chapter 1. Report Prologue
Chapter 2. Market Introduction
2.1 Definition
2.2 Scope of the Study
2.2.1 Research Objective
2.2.2 Assumptions
2.2.3 Limitations
Chapter 3. Research Methodology
3.1 Introduction
3.2 Primary Research
3.3 Secondary Research
3.4 Market Size Estimation
Chapter 4. Market Dynamics
4.1 Drivers
4.2 Restraints
4.3 Opportunities
4.4 Challenges
4.5 Macroeconomic Indicators
4.6 Technology Trends & Assessment
Chapter 5. Market Factor Analysis
5.1 Porter’s Five Forces Analysis
5.1.1 Bargaining Power of Suppliers
5.1.2 Bargaining Power of Buyers
5.1.3 Threat of New Entrants
5.1.4 Threat of Substitutes
5.1.5 Intensity of Rivalry
5.2 Value Chain Analysis
Chapter 6. Global Anti-aging Services Market, by Type of Service
6.1 Overview
6.2 Microdermabrasion
Market Estimates & Forecast, by Region, 2020–2027
Market Estimates & Forecast, by Country, 2020–2027
6.3 Breast Augmentation
Market Estimates & Forecast, by Region, 2020–2027
Market Estimates & Forecast, by Country, 2020–2027
6.4 Liposuction
Market Estimates & Forecast, by Region, 2020–2027
Market Estimates & Forecast, by Country, 2020–2027
6.5 Chemical Peel
Market Estimates & Forecast, by Region, 2020–2027
Market Estimates & Forecast, by Country, 2020–2027
6.6 Sclerotherapy
Market Estimates & Forecast, by Region, 2020–2027
Market Estimates & Forecast, by Country, 2020–2027
6.7 Intense Pulsed Light
Market Estimates & Forecast, by Region, 2020–2027
Market Estimates & Forecast, by Country, 2020–2027
6.8 Botox Treatment
Market Estimates & Forecast, by Region, 2020–2027
Market Estimates & Forecast, by Country, 2020–2027
6.9 Dermal Fillers
Market Estimates & Forecast, by Region, 2020–2027
Market Estimates & Forecast, by Country, 2020–2027
6.10 Others
Chapter 7. Global Anti-aging Services Market, by Service Provider
7.1 Overview
7.2 Hospitals
Market Estimates & Forecast, by Region, 2020–2027
Market Estimates & Forecast, by Country, 2020–2027
7.3 Dermatology Clinics
Market Estimates & Forecast, by Region, 2020–2027
Market Estimates & Forecast, by Country, 2020–2027
7.4 Salons
Market Estimates & Forecast, by Region, 2020–2027
Market Estimates & Forecast, by Country, 2020–2027
7.5 Others
Chapter 8. Global Anti-aging Services Market, by Region
8.1 Overview
8.2 Americas
8.2.1 North America
8.2.1.1 US
8.2.1.2 Canada
8.2.2 Latin America
8.3 Europe
8.3.1 Western Europe
8.3.1.1 Germany
8.3.1.2 France
8.3.1.3 Italy
8.3.1.4 Spain
8.3.1.5 UK
8.3.1.6 Rest of Western Europe
8.3.2 Eastern Europe
8.4 Asia-Pacific
8.4.1 Japan
8.4.2 China
8.4.3 India
8.4.4 Australia
8.4.5 South Korea
8.4.6 Rest of Asia-Pacific
8.5 Middle East & Africa
8.5.1 Middle East
8.5.2 Africa
Chapter 9. Company Landscape
9.1 Overview
9.2 Market Share Analysis
Chapter 10. Company Profiles
10.1 Allergan Inc.
10.1.1 Company Overview
10.1.2 Product Overview
10.1.3 Financials Overview
10.1.4 Key Developments
10.1.5 SWOT Analysis
10.2 Alma Lasers
10.2.1 Company Overview
10.2.2 Product Overview
10.2.3 Financial Overview
10.2.4 Key Developments
10.2.5 SWOT Analysis
10.3 Beiersdorf AG
10.3.1 Company Overview
10.3.2 Product Overview
10.3.3 Financial Overview
10.3.4 Key Development
10.3.5 SWOT Analysis
10.4 Cutera Inc.
10.4.1 Company Overview
10.4.2 Product Overview
10.4.3 Financial Overview
10.4.4 Key Development
10.4.5 SWOT Analysis
10.5 Cynosure Inc.
10.5.1 Company Overview
10.5.2 Product Overview
10.5.3 Financial overview
10.5.4 Key Developments
10.5.5 SWOT Analysis
10.6 Elizabeth Arden
10.6.1 Company Overview
10.6.2 Product Overview
10.6.3 Financial Overview
10.6.4 Key Developments
10.6.5 SWOT Analysis
10.7 Estee Lauder Inc.
10.7.1 Overview
10.7.2 Product Overview
10.7.3 Financial Overview
10.7.4 Key Developments
10.7.5 SWOT Analysis
10.8 Lumenis
10.8.1 Overview
10.8.2 Product Overview
10.8.3 Financials
10.8.4 Key Developments
10.8.5 SWOT Analysis
10.9 Procter & Gamble
10.9.1 Overview
10.9.2 Product Overview
10.9.3 Financials
10.9.4 Key Developments
10.9.5 SWOT Analysis
10.10 Solta Medical Inc.
10.10.1 Overview
10.10.2 Product Overview
10.10.3 Financials
10.10.4 Key Developments
10.10.5 SWOT Analysis
10.11 Others
Chapter 11. MRFR Conclusion
11.1 Key Findings
11.1.1 From CEO’s Viewpoint
11.1.2 Unmet Needs of the Market
11.2 Key Companies to Watch
11.3 Predictions for the Anti-aging Services Market
Chapter 12. Appendix
LIST OF TABLES
Table 1 Global Anti-aging Services Market Synopsis, 2020–2027
Table 2 Global Anti-aging Services Market Estimates and Forecast, 2020–2027 (USD Million)
Table 3 Global Anti-aging Services Market, by Type of Service, 2020–2027 (USD Million)
Table 4 Global Anti-aging Services Market, by Service Provider, 2020–2027 (USD Million)
Table 5 Global Anti-aging Services Market, by Region, 2020–2027(USD Million)
Table 6 North America: Anti-aging Services Market, by Type of Service, 2020–2027 (USD Million)
Table 7 North America: Anti-aging Services Market, by Service Provider, 2020–2027 (USD Million)
Table 8 North America: Anti-aging Services Market, by Country, 2020–2027 (USD Million)
Table 9 Latin America: Anti-aging Services Market, by Type of Service, 2020–2027 (USD Million)
Table 10 Latin America: Anti-aging Services Market, by Service Provider, 2020–2027 (USD Million)
Table 11 Europe: Anti-aging Services Market, by Type of Service, 2020–2027 (USD Million)
Table 12 Europe: Anti-aging Services Market, by Service Provider, 2020–2027 (USD Million)
Table 13 Europe: Anti-aging Services Market, by Region, 2020–2027 (USD Million)
Table 14 Western Europe: Anti-aging Services Market, by Type of Service, 2020–2027 (USD Million)
Table 15 Western Europe: Anti-aging Services Market, by Service Provider, 2020–2027 (USD Million)
Table 16 Western Europe: Anti-aging Services Market, by Country, 2020–2027 (USD Million)
Table 17 Eastern Europe: Anti-aging Services Market, by Type of Service, 2020–2027 (USD Million)
Table 18 Eastern Europe: Anti-aging Services Market, by Service Provider, 2020–2027 (USD Million)
Table 19 Asia-Pacific: Anti-aging Services Market, by Type of Service, 2020–2027 (USD Million)
Table 20 Asia-Pacific: Anti-aging Services Market, by Service Provider, 2020–2027 (USD Million)
Table 21 Asia-Pacific: Anti-aging Services Market, by Country, 2020–2027 (USD Million)
Table 22 Middle East & Africa: Anti-aging Services Market, by Type of Service, 2020–2027 (USD Million)
Table 23 Middle East & Africa: Anti-aging Services Market, by Service Provider, 2020–2027 (USD
Million)
Table 24 Middle East & Africa: Anti-aging Services Market, by Region, 2020–2027 (USD Million)
LIST OF FIGURES
Figure 1 Research Process
Figure 2 Segmentation for global Anti-aging Services Market
Figure 3 Segmentation Market Dynamics for global Anti-aging Services Market
Figure 4 Global Anti-aging Services Market Share, by Type of Service, 2020 (%)
Figure 5 Global Anti-aging Services Market Share, by Service Provider, 2020 (%)
Figure 6 Global Anti-aging Services Market Share, by Region, 2020 (%)
Figure 7 North America: Anti-aging Services Market Share, by Country, 2020 (%)
Figure 8 Europe: Anti-aging Services Market Share, by Country, 2020 (%)
Figure 9 Asia-Pacific: Anti-aging Services Market Share, by Country, 2020 (%)
Figure 10 Middle East & Africa: Anti-aging Services Market Share, by Country, 2020 (%)
Figure 11 Global Anti-aging Services Market: Company Share Analysis, 2020 (%)
Figure 12 Alma Lasers, Ltd.: Key Financials
Figure 13 Alma Lasers, Ltd.: Segmental Revenue
Figure 14 Alma Lasers, Ltd.: Geographical Revenue
Figure 15 Cynosure, Inc.: Key Financials
Figure 16 Cynosure, Inc.: Segmental Revenue
Figure 17 Cynosure, Inc.: Geographical Revenue
Figure 18 Allergan Inc.: Key Financials
Figure 19 Allergan Inc.: Segmental Revenue
Figure 20 Allergan Inc.: Geographical Revenue
Figure 21 Procter & Gamble: Key Financials
Figure 22 Procter & Gamble: Segmental Revenue
Figure 23 Procter & Gamble: Geographical Revenue
Figure 24 Cutera Inc.: Key Financials
Figure 25 Cutera Inc.: Segmental Revenue
Figure 26 Cutera Inc.: Geographical Revenue
NOTE:
This table of content is tentative and subject to change as the research progresses.
-In Chapter 10, the top 10 companies will be profiled. Each company will be profiled on the basis of Market Overview, Financials, Product Portfolio, Business Strategies, & Recent Development parameters.
-Please note: Financial details of the company cannot be provided if the information of the company is not available in the public domain and or reliable source
This table of content is tentative and subject to change as the research progresses.
Please Note: Financial details of company cannot be provided if the information of the company is not available in public domain and or reliable source.