ID: MRFR/ICT/2610-HCR | February 2021 | Region: Global | 100 Pages
TABLE OF CONTENTS
1. EXECUTIVE SUMMARY
1.1. Market Attractiveness Analysis
1.1.1. Global Analytics of Things Market, by Type
1.1.2. Global Analytics of Things Market, by Application
1.1.3. Global Analytics of Things Market, by Component
1.1.4. Global Analytics of Things Market, by Vertical
1.1.5. Global Analytics of Things Market, by Region
2. MARKET INTRODUCTION
2.1. Definition
2.2. Scope of the Study
2.3. Market Structure
3. RESEARCH METHODOLOGY
3.1. Research Process
3.2. Primary Research
3.3. Secondary Research
3.4. Market Size Estimation
3.5. Forecast Application
3.6. List of Assumptions
4. MARKET DYNAMICS
4.1. Introduction
4.2. Drivers
4.2.1. Tremendous Growth of IoT data
4.2.2. Increasing Need for Advanced Analytics
4.3. Restraints
4.3.1. Concerns Regarding Data Security
4.4. Opportunities
4.4.1. Increasing Application Across Industry Verticals
4.5. Challenges
5. MARKET FACTOR ANALYSIS
5.1. Value Chain Analysis/Supply Chain Analysis
5.2. Porterβs Five Forces Application
5.2.1. Bargaining Power of Suppliers
5.2.2. Bargaining Power of Buyers
5.2.3. Threat of New Entrants
5.2.4. Threat of Substitutes
5.2.5. Intensity of Rivalry
6. GLOBAL ANALYTICS OF THINGS MARKET, BY TYPE
6.1. Introduction
6.1.1. Descriptive Analytics
6.1.2. Predictive Analytics
6.1.3. Prescriptive Analytics
7. GLOBAL ANALYTICS OF THINGS MARKET, BY APPLICATION
7.1. Introduction
7.2. Sales and Customer Management
7.3. Predictive Maintenance and Asset Management
7.4. Energy Management
7.5. Inventory Management
7.6. Security and Emergency Management
7.7. Building Automation
7.8. IT Infrastructure Management
7.9. Remote Monitoring
7.10. Others
8. GLOBAL ANALYTICS OF THINGS MARKET, BY COMPONENT
8.1. Introduction
8.2. Software
8.3. Services
9. GLOBAL ANALYTICS OF THINGS MARKET, BY VERTICAL
9.1. Introduction
9.2. Telecommunications and IT
9.3. Manufacturing
9.4. Transportation and Logistics
9.5. Healthcare and Life Sciences
9.6. Retail and Ecommerce
9.7. Government and Defense
9.8. Energy and Utilities
9.9. Others
10. GLOBAL ANALYTICS OF THINGS MARKET, BY REGION
10.1. Overview
10.2. North America
10.2.1. US
10.2.2. Canada
10.2.3. Mexico
10.3. Europe
10.3.1. Germany
10.3.2. UK
10.3.3. France
10.3.4. Rest of Europe
10.4. Asia-Pacific
10.4.1. China
10.4.2. Japan
10.4.3. India
10.4.4. Rest of Asia-Pacific
10.5. Middle East & Africa
10.6. South America
11. COMPETITIVE LANDSCAPE
11.1. Introduction
11.2. Competitive Benchmarking
11.3. Key Developments & Growth Strategies
11.4. Vendor Share Analysis
12. COMPANY PROFILES
12.1. Hewlett Packard Enterprise Company
12.1.1. Company Overview
12.1.2. Financial Overview
12.1.3. Products Offered
12.1.4. Key Developments
12.1.5. SWOT Analysis
12.1.6. Key Strategies
12.2. Cisco Systems, Inc.
12.2.1. Company Overview
12.2.2. Financial Overview
12.2.3. Products Offered
12.2.4. Key Developments
12.2.5. SWOT Analysis
12.2.6. Key Strategies
12.3. Dell Technologies, Inc.
12.3.1. Company Overview
12.3.2. Financial Overview
12.3.3. Products Offered
12.3.4. Key Developments
12.3.5. SWOT Analysis
12.3.6. Key Strategies
12.4. Google, Inc.
12.4.1. Company Overview
12.4.2. Financial Overview
12.4.3. Products Offered
12.4.4. Key Developments
12.4.5. SWOT Analysis
12.4.6. Key Strategies
12.5. Amazon Web Services
12.5.1. Company Overview
12.5.2. Financial Overview
12.5.3. Products Offered
12.5.4. Key Developments
12.5.5. SWOT Analysis
12.5.6. Key Strategies
12.6. Salesforce.com, Inc.
12.6.1. Company Overview
12.6.2. Financial Overview
12.6.3. Products Offered
12.6.4. Key Developments
12.6.5. SWOT Analysis
12.6.6. Key Strategies
12.7. Teradata Corporation
12.7.1. Company Overview
12.7.2. Financial Overview
12.7.3. Products Offered
12.7.4. Key Developments
12.7.5. SWOT Analysis
12.7.6. Key Strategies
12.8. IBM Corporation
12.8.1. Company Overview
12.8.2. Financial Overview
12.8.3. Products Offered
12.8.4. Key Developments
12.8.5. SWOT Analysis
12.8.6. Key Strategies
12.9. Microsoft Corporation
12.9.1. Company Overview
12.9.2. Financial Overview
12.9.3. Products Offered
12.9.4. Key Developments
12.9.5. SWOT Analysis
12.9.6. Key Strategies
12.10. Oracle Corporation
12.10.1. Company Overview
12.10.2. Financial Overview
12.10.3. Products Offered
12.10.4. Key Developments
12.10.5. SWOT Analysis
12.10.6. Key Strategies
12.11. Hitachi, Ltd.
12.11.1. Company Overview
12.11.2. Financial Overview
12.11.3. Products Offered
12.11.4. Key Developments
12.11.5. SWOT Analysis
12.11.6. Key Strategies
12.12. PTC
12.12.1. Company Overview
12.12.2. Financial Overview
12.12.3. Products Offered
12.12.4. Key Developments
12.12.5. SWOT Analysis
12.12.6. Key Strategies
12.13. Greenwave Systems
12.13.1. Company Overview
12.13.2. Financial Overview
12.13.3. Products Offered
12.13.4. Key Developments
12.13.5. SWOT Analysis
12.13.6. Key Strategies
12.14. MNUBO
12.14.1. Company Overview
12.14.2. Financial Overview
12.14.3. Products Offered
12.14.4. Key Developments
12.14.5. SWOT Analysis
12.14.6. Key Strategies
List of Tables
TABLE 1 LIST OF ASSUMPTIONS
TABLE 2 GLOBAL ANALYTICS OF THINGS MARKET, BY TYPE, 2020β2027 (USD MILLION)
TABLE 3 GLOBAL ANALYTICS OF THINGS MARKET, BY APPLICATION, 2020β2027 (USD MILLION)
TABLE 4 GLOBAL ANALYTICS OF THINGS MARKET, BY COMPONENT, 2020β2027 (USD MILLION)
TABLE 6 GLOBAL ANALYTICS OF THINGS MARKET, BY VERTICAL, 2020β2027 (USD MILLION)
TABLE 7 GLOBAL ANALYTICS OF THINGS MARKET, BY REGION, 2020β2027 (USD MILLION)
TABLE 8 NORTH AMERICA: ANALYTICS OF THINGS MARKET, BY COUNTRY, 2020β2027 (USD MILLION)
TABLE 9 NORTH AMERICA: ANALYTICS OF THINGS MARKET, BY TYPE, 2020β2027 (USD MILLION)
TABLE 10 NORTH AMERICA: ANALYTICS OF THINGS MARKET, BY APPLICATION, 2020β2027 (USD MILLION)
TABLE 11 NORTH AMERICA: ANALYTICS OF THINGS MARKET, BY COMPONENT, 2020β2027 (USD MILLION)
TABLE 13 NORTH AMERICA: ANALYTICS OF THINGS MARKET, BY VERTICAL, 2020β2027 (USD MILLION)
TABLE 14 US: ANALYTICS OF THINGS MARKET, BY TYPE, 2020β2027 (USD MILLION)
TABLE 15 US: ANALYTICS OF THINGS MARKET, BY APPLICATION, 2020β2027 (USD MILLION)
TABLE 16 US: ANALYTICS OF THINGS MARKET, BY COMPONENT, 2020β2027 (USD MILLION)
TABLE 18 US: ANALYTICS OF THINGS MARKET, BY VERTICAL, 2020β2027 (USD MILLION)
TABLE 19 CANADA: ANALYTICS OF THINGS MARKET, BY TYPE, 2020β2027 (USD MILLION)
TABLE 20 CANADA: ANALYTICS OF THINGS MARKET, BY APPLICATION, 2020β2027 (USD MILLION)
TABLE 21 CANADA: ANALYTICS OF THINGS MARKET, BY COMPONENT, 2020β2027 (USD MILLION)
TABLE 23 CANADA: ANALYTICS OF THINGS MARKET, BY VERTICAL, 2020β2027 (USD MILLION)
TABLE 24 MEXICO: ANALYTICS OF THINGS MARKET, BY TYPE, 2020β2027 (MEXICOD MILLION)
TABLE 25 MEXICO: ANALYTICS OF THINGS MARKET, BY APPLICATION, 2020β2027 (MEXICOD MILLION)
TABLE 26 MEXICO: ANALYTICS OF THINGS MARKET, BY COMPONENT, 2020β2027 (MEXICOD MILLION)
TABLE 28 MEXICO: ANALYTICS OF THINGS MARKET, BY VERTICAL, 2020β2027 (MEXICOD MILLION)
TABLE 29 EUROPE: ANALYTICS OF THINGS MARKET, BY COUNTRY, 2020β2027 (USD MILLION)
TABLE 30 EUROPE: ANALYTICS OF THINGS MARKET, BY TYPE, 2020β2027 (USD MILLION)
TABLE 31 EUROPE: ANALYTICS OF THINGS MARKET, BY APPLICATION, 2020β2027 (USD MILLION)
TABLE 32 EUROPE: ANALYTICS OF THINGS MARKET, BY COMPONENT, 2020β2027 (USD MILLION)
TABLE 34 EUROPE: ANALYTICS OF THINGS MARKET, BY VERTICAL, 2020β2027 (USD MILLION)
TABLE 35 UK: ANALYTICS OF THINGS MARKET, BY TYPE, 2020β2027 (USD MILLION)
TABLE 36 UK: ANALYTICS OF THINGS MARKET, BY APPLICATION, 2020β2027 (USD MILLION)
TABLE 37 UK: ANALYTICS OF THINGS MARKET, BY COMPONENT, 2020β2027 (USD MILLION)
TABLE 39 UK: ANALYTICS OF THINGS MARKET, BY VERTICAL, 2020β2027 (USD MILLION)
TABLE 40 GERMANY: ANALYTICS OF THINGS MARKET, BY TYPE, 2020β2027 (USD MILLION)
TABLE 41 GERMANY: ANALYTICS OF THINGS MARKET, BY APPLICATION, 2020β2027 (USD MILLION)
TABLE 42 GERMANY: ANALYTICS OF THINGS MARKET, BY COMPONENT, 2020β2027 (USD MILLION)
TABLE 44 GERMANY: ANALYTICS OF THINGS MARKET, BY VERTICAL, 2020β2027 (USD MILLION)
TABLE 45 FRANCE: ANALYTICS OF THINGS MARKET, BY TYPE, 2020β2027 (USD MILLION)
TABLE 46 FRANCE: ANALYTICS OF THINGS MARKET, BY APPLICATION, 2020β2027 (USD MILLION)
TABLE 47 FRANCE: ANALYTICS OF THINGS MARKET, BY COMPONENT, 2020β2027 (USD MILLION)
TABLE 49 FRANCE: ANALYTICS OF THINGS MARKET, BY VERTICAL, 2020β2027 (USD MILLION)
TABLE 50 REST OF EUROPE: ANALYTICS OF THINGS MARKET, BY TYPE, 2020β2027 (USD MILLION)
TABLE 51 REST OF EUROPE: ANALYTICS OF THINGS MARKET, BY APPLICATION, 2020β2027 (USD MILLION)
TABLE 52 REST OF EUROPE: ANALYTICS OF THINGS MARKET, BY COMPONENT, 2020β2027 (USD MILLION)
TABLE 54 REST OF EUROPE: ANALYTICS OF THINGS MARKET, BY VERTICAL, 2020β2027 (USD MILLION)
TABLE 55 ASIA-PACIFIC: ANALYTICS OF THINGS MARKET, BY COUNTRY, 2020β2027 (USD MILLION)
TABLE 56 ASIA-PACIFIC: ANALYTICS OF THINGS MARKET, BY TYPE, 2020β2027 (USD MILLION)
TABLE 57 ASIA-PACIFIC: ANALYTICS OF THINGS MARKET, BY APPLICATION, 2020β2027 (USD MILLION)
TABLE 58 ASIA-PACIFIC: ANALYTICS OF THINGS MARKET, BY COMPONENT, 2020β2027 (USD MILLION)
TABLE 60 ASIA-PACIFIC: ANALYTICS OF THINGS MARKET, BY VERTICAL, 2020β2027 (USD MILLION)
TABLE 61 CHINA: ANALYTICS OF THINGS MARKET, BY TYPE, 2020β2027 (USD MILLION)
TABLE 62 CHINA: ANALYTICS OF THINGS MARKET, BY APPLICATION, 2020β2027 (USD MILLION)
TABLE 63 CHINA: ANALYTICS OF THINGS MARKET, BY COMPONENT, 2020β2027 (USD MILLION)
TABLE 65 CHINA: ANALYTICS OF THINGS MARKET, BY VERTICAL, 2020β2027 (USD MILLION)
TABLE 66 INDIA: ANALYTICS OF THINGS MARKET, BY TYPE, 2020β2027 (USD MILLION)
TABLE 67 INDIA: ANALYTICS OF THINGS MARKET, BY APPLICATION, 2020β2027 (USD MILLION)
TABLE 68 INDIA: ANALYTICS OF THINGS MARKET, BY COMPONENT, 2020β2027 (USD MILLION)
TABLE 70 INDIA: ANALYTICS OF THINGS MARKET, BY VERTICAL, 2020β2027 (USD MILLION)
TABLE 71 JAPAN: ANALYTICS OF THINGS MARKET, BY TYPE, 2020β2027 (USD MILLION)
TABLE 72 JAPAN: ANALYTICS OF THINGS MARKET, BY APPLICATION, 2020β2027 (USD MILLION)
TABLE 73 JAPAN: ANALYTICS OF THINGS MARKET, BY COMPONENT, 2020β2027 (USD MILLION)
TABLE 75 JAPAN: ANALYTICS OF THINGS MARKET, BY VERTICAL, 2020β2027 (USD MILLION)
TABLE 76 REST OF ASIA-PACIFIC: ANALYTICS OF THINGS MARKET, BY TYPE, 2020β2027 (USD MILLION)
TABLE 77 REST OF ASIA-PACIFIC: ANALYTICS OF THINGS MARKET, BY APPLICATION, 2020β2027 (USD MILLION)
TABLE 78 REST OF ASIA-PACIFIC: ANALYTICS OF THINGS MARKET, BY COMPONENT, 2020β2027 (USD MILLION)
TABLE 80 REST OF ASIA-PACIFIC: ANALYTICS OF THINGS MARKET, BY VERTICAL, 2020β2027 (USD MILLION)
TABLE 81 MIDDLE EAST & AFRICA: ANALYTICS OF THINGS MARKET, BY TYPE, 2020β2027 (USD MILLION)
TABLE 82 MIDDLE EAST & AFRICA: ANALYTICS OF THINGS MARKET, BY APPLICATION, 2020β2027 (USD MILLION)
TABLE 83 MIDDLE EAST & AFRICA: ANALYTICS OF THINGS MARKET, BY COMPONENT, 2020β2027 (USD MILLION)
TABLE 85 MIDDLE EAST & AFRICA: ANALYTICS OF THINGS MARKET, BY VERTICAL, 2020β2027 (USD MILLION)
TABLE 86 SOUTH AMERICA: ANALYTICS OF THINGS MARKET, BY TYPE, 2020β2027 (USD MILLION)
TABLE 87 SOUTH AMERICA: ANALYTICS OF THINGS MARKET, BY APPLICATION, 2020β2027 (USD MILLION)
TABLE 88 SOUTH AMERICA: ANALYTICS OF THINGS MARKET, BY COMPONENT, 2020β2027 (USD MILLION)
TABLE 90 SOUTH AMERICA: ANALYTICS OF THINGS MARKET, BY VERTICAL, 2020β2027 (USD MILLION)
β
β
LIST OF FIGURES
FIGURE 1 MARKET SYNOPSIS
FIGURE 2 RESEARCH PROCESS OF MRFR
FIGURE 3 TOP-DOWN AND BOTTOM-UP APPROACH
FIGURE 4 GLOBAL ANALYTICS OF THINGS MARKET, BY TYPE, 2020β2027 (USD MILLION)
FIGURE 5 GLOBAL ANALYTICS OF THINGS MARKET, BY APPLICATION, 2020β2027 (USD MILLION)
FIGURE 6 GLOBAL ANALYTICS OF THINGS MARKET, BY COMPONENT, 2020β2027 (USD MILLION)
FIGURE 8 GLOBAL ANALYTICS OF THINGS MARKET, BY VERTICAL, 2020β2027 (USD MILLION)
FIGURE 9 GLOBAL ANALYTICS OF THINGS MARKET, BY REGION, 2020β2027 (USD MILLION)
FIGURE 10 GLOBAL ANALYTICS OF THINGS MARKET, BY REGION, 2020β2027 (USD MILLION)
FIGURE 11 NORTH AMERICA: ANALYTICS OF THINGS MARKET, BY COUNTRY, 2020β2027 (USD MILLION)
FIGURE 12 NORTH AMERICA: ANALYTICS OF THINGS MARKET, BY TYPE, 2020β2027 (USD MILLION)
FIGURE 13 NORTH AMERICA: ANALYTICS OF THINGS MARKET, BY APPLICATION, 2020β2027 (USD MILLION)
FIGURE 14 NORTH AMERICA: ANALYTICS OF THINGS MARKET, BY COMPONENT, 2020β2027 (USD MILLION)
FIGURE 16 NORTH AMERICA: ANALYTICS OF THINGS MARKET, BY VERTICAL, 2020β2027 (USD MILLION)
FIGURE 17 EUROPE: ANALYTICS OF THINGS MARKET, BY COUNTRY, 2020β2027 (USD MILLION)
FIGURE 18 EUROPE: ANALYTICS OF THINGS MARKET, BY TYPE, 2020β2027 (USD MILLION)
FIGURE 19 EUROPE: ANALYTICS OF THINGS MARKET, BY APPLICATION, 2020β2027 (USD MILLION)
FIGURE 20 EUROPE: ANALYTICS OF THINGS MARKET, BY COMPONENT, 2020β2027 (USD MILLION)
FIGURE 22 EUROPE: ANALYTICS OF THINGS MARKET, BY VERTICAL, 2020β2027 (USD MILLION)
FIGURE 23 ASIA-PACIFIC: ANALYTICS OF THINGS MARKET, BY COUNTRY, 2020β2027 (USD MILLION)
FIGURE 24 ASIA-PACIFIC: ANALYTICS OF THINGS MARKET, BY TYPE, 2020β2027 (USD MILLION)
FIGURE 25 ASIA-PACIFIC: ANALYTICS OF THINGS MARKET, BY APPLICATION, 2020β2027 (USD MILLION)
FIGURE 26 ASIA-PACIFIC: ANALYTICS OF THINGS MARKET, BY COMPONENT, 2020β2027 (USD MILLION)
FIGURE 28 ASIA-PACIFIC: ANALYTICS OF THINGS MARKET, BY VERTICAL, 2020β2027 (USD MILLION)
FIGURE 29 MIDDLE EAST & AFRICA: ANALYTICS OF THINGS MARKET, BY TYPE, 2020β2027 (USD MILLION)
FIGURE 30 MIDDLE EAST & AFRICA: ANALYTICS OF THINGS MARKET, BY APPLICATION, 2020β2027 (USD MILLION)
FIGURE 31 MIDDLE EAST & AFRICA: ANALYTICS OF THINGS MARKET, BY COMPONENT, 2020β2027 (USD MILLION)
FIGURE 33 MIDDLE EAST & AFRICA: ANALYTICS OF THINGS MARKET, BY VERTICAL, 2020β2027 (USD MILLION)
FIGURE 34 SOUTH AMERICA: ANALYTICS OF THINGS MARKET, BY TYPE, 2020β2027 (USD MILLION)
FIGURE 35 SOUTH AMERICA: ANALYTICS OF THINGS MARKET, BY APPLICATION, 2020β2027 (USD MILLION)
FIGURE 36 SOUTH AMERICA: ANALYTICS OF THINGS MARKET, BY COMPONENT, 2020β2027 (USD MILLION)
FIGURE 38 SOUTH AMERICA: ANALYTICS OF THINGS MARKET, BY VERTICAL, 2020β2027 (USD MILLION)
$120.4 Billion
33.40%
North America
2020-2030
Analytics of things relates to the analysis of data gathered by the internet of things connected to the internet. Analytics of things provides helpful data insights for devices and organizations. Analytics of things, therefore, supports the decisions of the organizations with data insights and information. Similarly, data processed by analytics of things helps in making devices smarter because they make informed decisions. The quest for smarter devices and better organizations has supported our dependence on the Analytics of Things Market. The Global Market has been growing since the late 2010s. Moreover, this trend of growth will continue in the new decade.
However, currently, Analytics of Things as a branch of information technology is still in its nascent phase. It is an allied technology to the Internet of Things. The development of Analytics of Things into a full-fledged technology will take more time. Moreover, the process will take further research and development. There are different processes involved in the Analytics of Things. For example, Analytics of Things deals with both data collection from the Internet of Things devices and its subsequent analysis. Both the branches need to develop equally well for Analytics of Things to properly apply in areas.
The process of Analytics of Things is very complex. The systems look for any prominent patterns, anomalies, and variations in the data. The process of analysis yields results related to data patterns and inferences. The Analytics of Things yield insights from deep analysis of data. Analytics of Things Market is important because today a lot depends on the internet. The internet is a bottomless well of data and information. Without a proper system for the analysis of large-scale data, infrastructure does not reach its operational efficiency. The market for Analytics of Things, therefore, grows in importance and size as time passes.
COVID 19 Analysis:
The COVID 19 pandemic was a setback for most industries. However, the disruption caused by the pandemic is a positive factor for technology segments like the Internet of Things and the Analytics of Things Market. As the manufacturing and other services segment declined in growth, information technology and other allied sectors grew in importance. The dependence on technology increased, both at an organizational level and personal level. Therefore, the revenue of the technology industry shot up in the pandemic period. Investors moved their major investments into the technology segment, which further supports the growth of this Market. A huge factor in promoting the growth of thiss Market is the need for digital transformation. Now that people have adapted to technology and its applications, new age technology like Analytics of Things will only become more widespread in the application.
Once the growth of the Analytics of Things Market is supported by the pandemic, the path forward is also towards growth. Analytics of Things is now used to track COVID 19 spread across the world. The global Market benefits from the need to analyze bulk data collected during the pandemic.
Analytics of Things Market Dynamics:
Driver:
The evolution of Big Data and other allied analytics is a huge factor in the growth of the global Market. The need for digital transformation is also a key driver of the market during the forecast period. The investment of business organizations in advanced technology and skilled manpower is also a key driver of the segment. The need for smarter devices that can take over manual duties also creates growth for the market. Apart from these, there are various opportunities for growth for the Analytics of Things market.
Opportunities:
There are many significant opportunities for market growth in the Analytics of Things segment. The recognition of Analytics of Things as a separate arm of technology and employment of advanced analytics bolsters market growth. Secondly, the increase in the number of connected devices is also a huge opportunity for this Market growth. As connected devices increase in number, it becomes easy for advanced analytics to gather data. Thirdly, the diversity of applications and types of Analytics of Things is also an opportunity for growth for the market.
Restraints:
There are many restraints that are present in the Analytics of things market at this time. Like all other developing technology segments, this market also faces concerns of data privacy and leaks. There is an absence of robust infrastructure in the segment, which restrains growth in certain ways. The lack of skilled manpower to carry on research and development in the sector is also a market restraint. There is ample investment in the segment, but it needs to be backed by other factors that support cumulative growth.
Major Challenges of the Market:
The Analytics of things market faces the challenge of ample research and development in the sector. Since this market is in a nascent stage right now, there is a need to support its growth with targeted research and development. For the Analytics of things market to develop, the internet of things segment has to develop. Maintaining the growth of both segments is a challenge that data scientists have to address.
Cumulative growth Analysis:
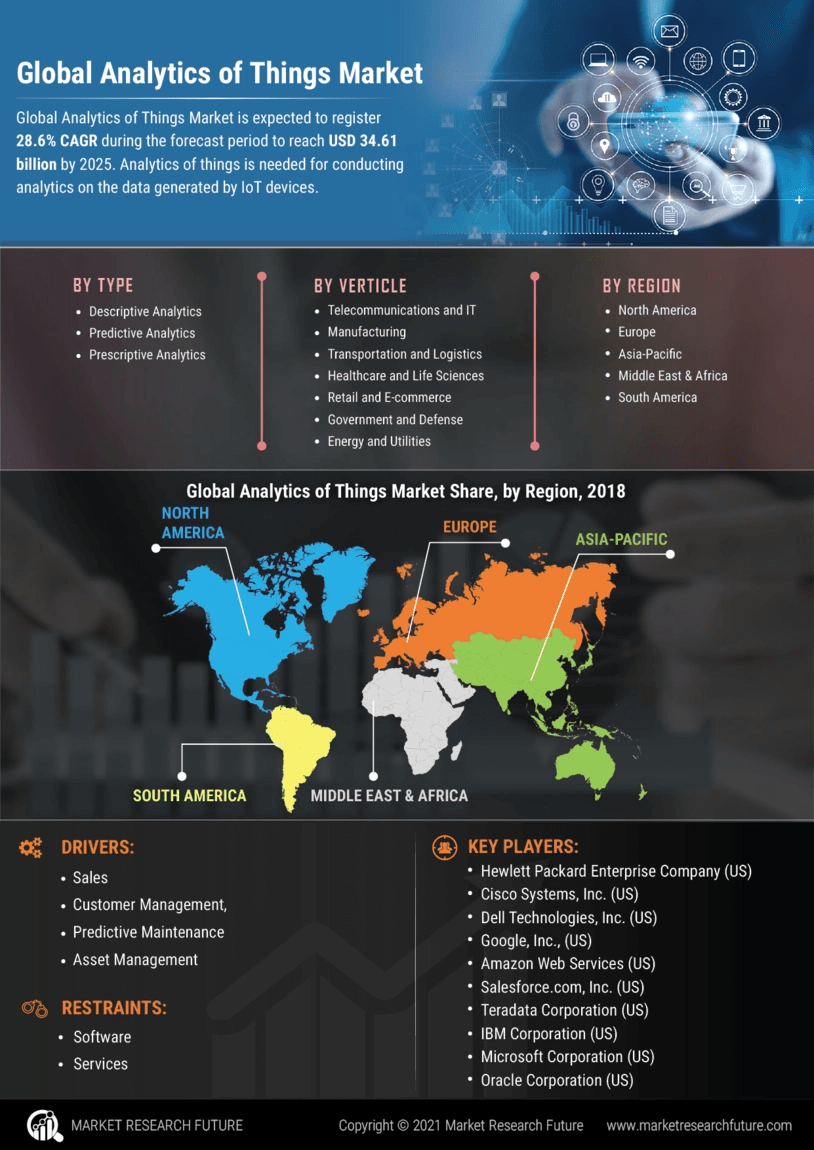
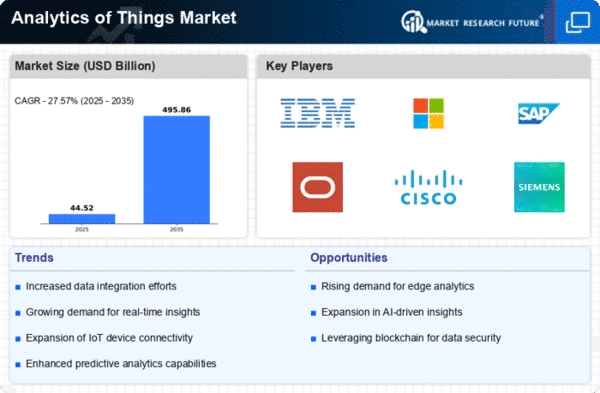
The Global Analytics of Things industry research states that the Analytics of Things Industry will grow at a rate of 28.6 percent till 2025. The CAGR indicates that the Analytics of Things Market Size will increase at a tremendous rate in the post-pandemic era. Analytics of Things Market Analysis puts the future valuation of the Analytics of Things Industry at a whopping 36.41 billion US Dollars. Thus, the Global Analytics of Things Market projects a double-digit growth rate in the forecast period. The fact that the Analytics of Things Market growth rate is beyond 20 percent in the forecast period is also a sign that the Global Analytics of Things Market will be a huge one in the future.
Analytics of Things Market Segment Overview:
The Analytics of Things market size divides into different segments depending on criteria. The Analytics of Things Market Segments divides on the basis of type, component, application, and verticals. The Analytics of Things Market Segments is as follows.
By Type:
The Analytics of Things Industry divides into prescriptive analytics, predictive analytics, and descriptive analytics based on type.
By Component:
The Analytics of Things Industry divides into segmented software and services based on the components of the system.
By Application:
By application, the Analytics of Things market has categories like predictive management, customer management, asset management, etc. the application of Analytics of Things is expanding day by day.
By Verticals:
Based on the verticals, the global market is Telecommunication, transportation, and logistics as well as health care.
Analytics of Things Market Regional Overview:
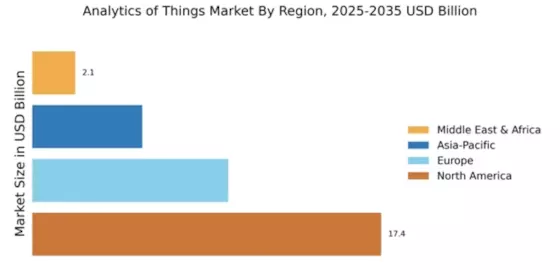
Based on regions, the Analytics of Things Market disperses over different global regions. For example, the major regional markets of the Analytics of Things Market are North America, Asia Pacific, and Europe. Other minor regional markets combine into the Rest of the World. The North American region will be the leading regional market for the forecast period. The North American countries, especially the US, are already prominent in the global analytics market. However, the Analytics of Things Market trends predicts that the Asia Pacific will be the fastest-growing regional market for Analytics of Things. A reason behind this trend is the development of the IT sector in the Asia Pacific region.
Competitive Landscape:
The competitive landscape of the Analytics of Things market projects multiple growth opportunities for all the key players. However, the drive to create new products will also enhance competition between the key players of the market.
According to the Analytics of Things Market Analysis, the key players of the competitive landscape are
Recent Developments:
There are many recent developments in the Analytics of Things market that drive growth for individual key players as well as for the market.
The recent developments are as follows.
Report Overview:
The global Analytics of Things market outlook or overview is as follows:
The above market research report covers the current market situation. Secondly, it also sheds on the short-term and long-term impact of COVID 19 on the market so that the Analytics of Things market trends are understood. Thirdly, it explains the current market dynamics as well as segment and regional overview. Therefore, the report also focuses on the competitive landscape and recent developments to present a wholesome view of the future market.
Report Attribute/Metric | Details |
---|---|
Market Size | USD 120.4 billion 2030 |
CAGR | 33.40% 2030 |
Base Year | 2019 |
Forecast Period | 2021-2030 |
Historical Data | 2018 |
Forecast Units | Value (USD Billion) |
Report Coverage | Revenue Forecast, Competitive Landscape, Growth Factors, and Trends |
Segments Covered | by Type, Application |
Geographies Covered | North America, Europe, Asia-Pacific, and Rest of the World (RoW) |
Key Vendors | Hewlett Packard Enterprise Company (US), Cisco Systems, Inc. (US), Dell Technologies, Inc. (US), Google, Inc., (US), Amazon Web Services (US), Salesforce.com, Inc. (US), Teradata Corporation (US), IBM Corporation (US), Microsoft Corporation (US), Oracle Corporation (US), SAP SE (Germany) |
Key Market Opportunities |
|
Key Market Drivers |
|
Frequently Asked Questions (FAQ) :
The North American region will generate the highest revenue by the end of 2030.
The CAGR of the global Analytics of Things market is a healthy 33.40 percent in the forecast period.
The solution services segment will dominate market demand in the forecast period.