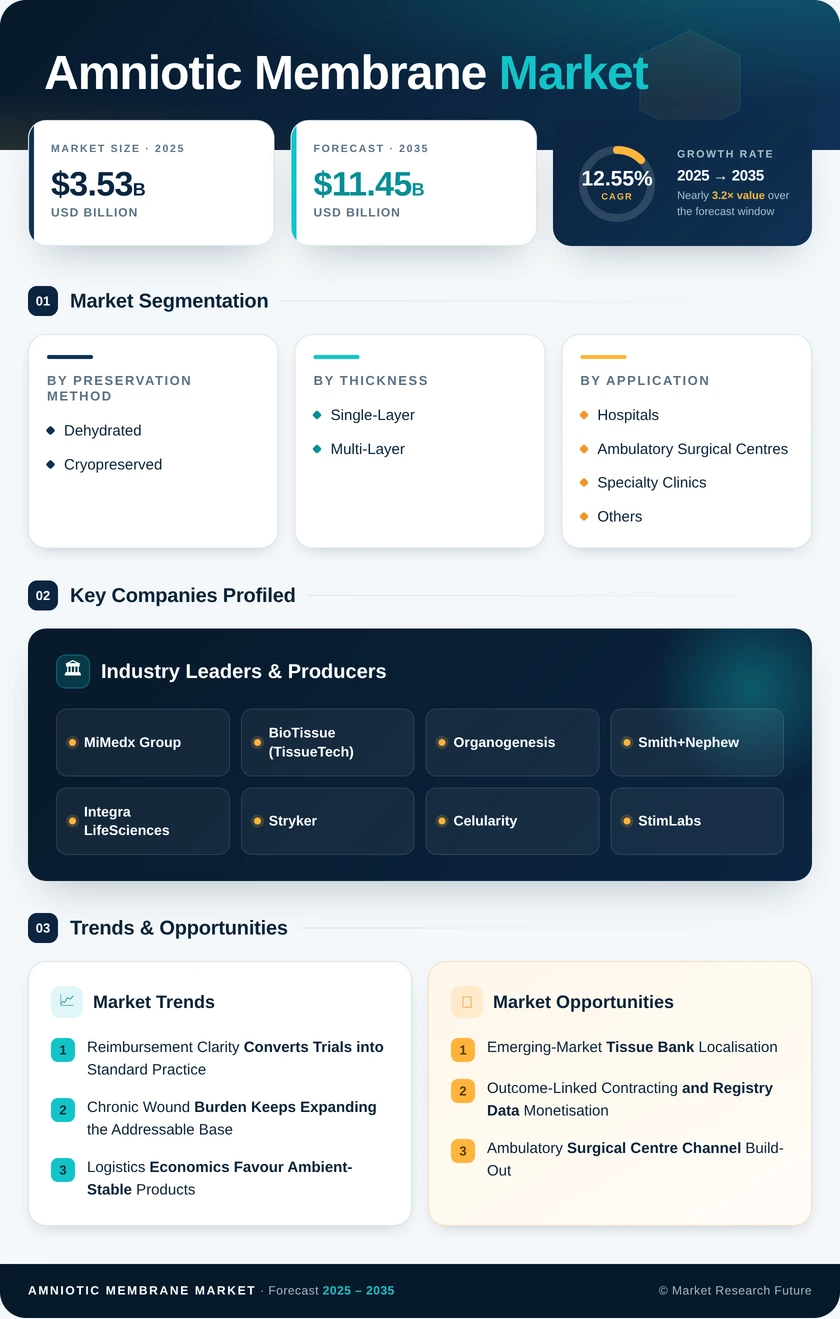
Amniotic Membrane Market (2026 - 2035)

Amniotic Membrane Market Research Report: Size, Share, Trend Analysis By Applications (Ophthalmology, Wound Healing, Plastic Surgery, Orthopedic Surgery), By Types (Cryopreserved Amniotic Membrane, Dehydrated Amniotic Membrane, Amniotic Membrane Patch), By Form (Sheet, Suspension, Gel), By End Use (Hospitals, Ambulatory Surgical Centers, Specialty Clinics) and By Regional (North America, Europe, South America, Asia Pacific, Middle East and Africa) - Growth Outlook & Industry Forecast 2025 To 2035

Forecast Period
2026-2035
CAGR
12.55%
2025 Market Size
USD 3.53 Billion
2035 Market Size
USD 11.45 Billion
Healthcare ● Updated September 7, 2026 Report ID: MRFR/HC/4190-CR | Pages: 200 | Author: Vikita Thakur, Rahul Gotadki
  1. 1 Market Summary |
    1. 1.1 Study Assumptions & Market Definition |
    2. 1.2 Scope of the Study |
    3. 1.3 Research Methodology
  2. 2 Key Report Takeaways |
    1. 2.1 By Preservation Method and Thickness |
    2. 2.2 By Application and End-User |
    3. 2.3 By Geography
  3. 3 Market Size & Forecast (2021–2035) |
    1. 3.1 Historical Market Size (2021–2025) |
    2. 3.2 Current & Forecast Market Size (2026–2035) |
    3. 3.3 Year-over-Year Growth Analysis
  4. 4 Driver Impact Analysis |
    1. 4.1 Reimbursement Clarity Converts Trials into Standard Practice |
    2. 4.2 Chronic Wound Burden Keeps Expanding the Addressable Base |
    3. 4.3 Ocular Surface Surgery Volumes Are Structurally Rising |
    4. 4.4 Logistics Economics Favour Ambient-Stable Products
  5. 5 Restraints Impact Analysis |
    1. 5.1 Payer Scrutiny Is the Sharpest Near-Term Risk |
    2. 5.2 Donor Supply Cannot Be Scaled on Demand |
    3. 5.3 Evidence Depth Lags Indication Breadth
  6. 6 Opportunities |
    1. 6.1 Emerging-Market Tissue Bank Localisation |
    2. 6.2 Outcome-Linked Contracting and Registry Data Monetisation |
    3. 6.3 Ambulatory Surgical Centre Channel Build-Out |
    4. 6.4 Ophthalmic Sutureless Delivery Systems |
    5. 6.5 Regulatory Harmonisation Across Asia-Pacific
  7. 7 Regional Market Share & Country-Level Analysis |
    1. 7.1 North America | |
      1. 7.1.1 US | |
      2. 7.1.2 Canada | |
      3. 7.1.3 Mexico |
    2. 7.2 Europe | |
      1. 7.2.1 Germany | |
      2. 7.2.2 UK | |
      3. 7.2.3 France | |
      4. 7.2.4 Italy | |
      5. 7.2.5 Spain | |
      6. 7.2.6 Nordic Countries | |
      7. 7.2.7 Russia | |
      8. 7.2.8 Rest of Europe |
    3. 7.3 Asia-Pacific | |
      1. 7.3.1 China | |
      2. 7.3.2 India | |
      3. 7.3.3 Japan | |
      4. 7.3.4 South Korea | |
      5. 7.3.5 ASEAN | |
      6. 7.3.6 Rest of Asia-Pacific |
    4. 7.4 South America | |
      1. 7.4.1 Brazil | |
      2. 7.4.2 Argentina | |
      3. 7.4.3 Rest of South America |
    5. 7.5 Middle East & Africa | |
      1. 7.5.1 Saudi Arabia | |
      2. 7.5.2 UAE | |
      3. 7.5.3 South Africa | |
      4. 7.5.4 Egypt | |
      5. 7.5.5 Rest of Middle East & Africa
  8. 8 Future Outlook (2026–2035) |
    1. 8.1 Standardisation Will Beat Differentiation |
    2. 8.2 Clinic-Based Application Reshapes Unit Economics |
    3. 8.3 Combination Products and Regenerative Research Pipeline |
    4. 8.4 Supply Chain Traceability Becomes a Purchase Criterion
  9. 9 Market Segmentation Analysis |
    1. 9.1 By Preservation Method | |
      1. 9.1.1 Cryopreserved | |
      2. 9.1.2 Dehydrated |
    2. 9.2 By Thickness | |
      1. 9.2.1 Single-Layer | |
      2. 9.2.2 Multi-Layer |
    3. 9.3 By Application | |
      1. 9.3.1 Ophthalmology | |
      2. 9.3.2 Surgical and Chronic Wounds | |
      3. 9.3.3 Orthopedics & Sports Medicine | |
      4. 9.3.4 Burn Management | |
      5. 9.3.5 Others |
    4. 9.4 By End-User | |
      1. 9.4.1 Hospitals | |
      2. 9.4.2 Ambulatory Surgical Centres | |
      3. 9.4.3 Specialty Clinics | |
      4. 9.4.4 Others
  10. 10 Competitive Landscape |
    1. 10.1 Market Concentration Analysis (2026) |
    2. 10.2 Competitive Benchmarking Matrix |
    3. 10.3 Company Profiles | |
      1. 10.3.1 MiMedx Group | |
      2. 10.3.2 BioTissue (TissueTech) | |
      3. 10.3.3 Organogenesis | |
      4. 10.3.4 Smith+Nephew | |
      5. 10.3.5 Integra LifeSciences | |
      6. 10.3.6 Stryker | |
      7. 10.3.7 Celularity | |
      8. 10.3.8 StimLabs | |
      9. 10.3.9 Skye Biologics | |
      10. 10.3.10 Amnio Technology
  11. 11 Recent News & Developments
  12. 12 Report Scope & Methodology |
    1. 12.1 Study Period & Base Year |
    2. 12.2 Data Sources & Citations |
    3. 12.3 Abbreviations
  13. 13 Detailed Sources and Citations
  14. 14 Frequently Asked Questions
  15. 15 LIST OF TABLES |
  16. TABLE 1 Global Amniotic Membrane Market Size & Forecast, by Revenue (USD Billion), 2021–2035 |
  17. TABLE 2 Global Amniotic Membrane Market – Year-over-Year Growth Analysis, 2021–2035 |
  18. TABLE 3 Driver Impact Analysis – Estimated Contribution to CAGR, 2026–2035 |
  19. TABLE 4 Restraint Impact Analysis – Estimated Drag on CAGR, 2026–2035 |
  20. TABLE 5 Global Amniotic Membrane Market Size, by Region, 2021–2035 (USD Billion) |
  21. TABLE 6 North America Amniotic Membrane Market Size, by Country, 2021–2035 (USD Billion) |
  22. TABLE 7 Europe Amniotic Membrane Market Size, by Country, 2021–2035 (USD Billion) |
  23. TABLE 8 Asia-Pacific Amniotic Membrane Market Size, by Country, 2021–2035 (USD Billion) |
  24. TABLE 9 South America Amniotic Membrane Market Size, by Country, 2021–2035 (USD Billion) |
  25. TABLE 10 Middle East & Africa Amniotic Membrane Market Size, by Country, 2021–2035 (USD Billion) |
  26. TABLE 11 Global Amniotic Membrane Market Size, by Preservation Method, 2021–2035 (USD Billion) |
  27. TABLE 12 Global Amniotic Membrane Market Size, by Thickness, 2021–2035 (USD Billion) |
  28. TABLE 13 Global Amniotic Membrane Market Size, by Application, 2021–2035 (USD Billion) |
  29. TABLE 14 Global Amniotic Membrane Market Size, by End-User, 2021–2035 (USD Billion) |
  30. TABLE 15 North America Amniotic Membrane Market Size, by Application, 2021–2035 (USD Billion) |
  31. TABLE 16 Europe Amniotic Membrane Market Size, by Application, 2021–2035 (USD Billion) |
  32. TABLE 17 Asia-Pacific Amniotic Membrane Market Size, by Application, 2021–2035 (USD Billion) |
  33. TABLE 18 South America Amniotic Membrane Market Size, by End-User, 2021–2035 (USD Billion) |
  34. TABLE 19 Middle East & Africa Amniotic Membrane Market Size, by End-User, 2021–2035 (USD Billion) |
  35. TABLE 20 Competitive Benchmarking Matrix – Global Amniotic Membrane Market, 2026 |
  36. TABLE 21 Company Profiles – Key Players, Global Amniotic Membrane Market |
  37. TABLE 22 Recent Developments & Strategic Announcements, 2023–2025 |
  38. TABLE 23 Report Scope & Methodology Summary |
  39. TABLE 24 Detailed Sources and Citations Index
  40. 16 LIST OF FIGURES |
  41. FIGURE 1 Global Amniotic Membrane Market – Market Dynamics Overview (Drivers, Restraints, Opportunities) |
  42. FIGURE 2 Industry Value Chain Analysis – Donor Recovery to Clinical Application |
  43. FIGURE 3 Porter's Five Forces Analysis – Global Amniotic Membrane Market |
  44. FIGURE 4 Global Market Size Trend Line, 2021–2035 (USD Billion) |
  45. FIGURE 5 Year-over-Year Growth Curve, 2022–2035 (%) |
  46. FIGURE 6 Market Share by Preservation Method, 2025 vs 2035 (%) |
  47. FIGURE 7 Market Share by Thickness, 2025 vs 2035 (%) |
  48. FIGURE 8 Market Share by Application, 2025 (%) |
  49. FIGURE 9 Market Share by End-User, 2025 (%) |
  50. FIGURE 10 Regional Revenue Share Distribution, 2025 (%) |
  51. FIGURE 11 Regional CAGR Comparison, 2026–2035 (%) |
  52. FIGURE 12 Country-Level Revenue Contribution – Top 10 Markets, 2025 |
  53. FIGURE 13 Competitive Landscape – Estimated Revenue Share Bands, 2026 |
  54. FIGURE 14 Strategic Positioning Matrix – Evidence Depth vs Distribution Reach |
  55. FIGURE 15 Driver Impact Waterfall – Contribution to Forecast CAGR

Segmentation Quick Reference

DimensionSub-SegmentsDominant SegmentFastest Growing Segment
Preservation MethodCryopreserved; DehydratedDehydratedCryopreserved
ThicknessSingle-Layer; Multi-LayerSingle-LayerMulti-Layer
ApplicationOphthalmology; Surgical and Chronic Wounds; Orthopedics & Sports Medicine; Burn Management; OthersOphthalmologySurgical and Chronic Wounds
End-UserHospitals; Ambulatory Surgical Centres; Specialty Clinics; OthersHospitalsSpecialty Clinics
GeographyNorth America; Europe; Asia-Pacific; South America; Middle East & AfricaNorth AmericaAsia-Pacific


Market Segmentation Overview

By Preservation Method

Sub-SegmentKey Trend
CryopreservedTertiary centres favour higher retained growth-factor content for complex defects.
DehydratedAmbient storage and five-year shelf life drive penetration into secondary hospital tiers.


Preservation choice is now an infrastructure decision as much as a clinical one. Facilities with ultra-low temperature capacity increasingly stock both formats, reserving cryopreserved product for deep or non-responsive wounds while defaulting to ambient-stable stock for routine cases.

By Thickness

Sub-SegmentKey Trend
Single-LayerRemains standard for ocular surface work where optical clarity is required
Multi-LayerAdoption accelerating in orthopedic and deep surgical defects requiring structural bulk.


Thickness selection maps closely onto defect depth. Multi-layer constructs command a price premium of roughly 40–60% per unit, which value-analysis committees accept only where single-layer failure rates are documented.

By Application

Sub-SegmentKey Trend
OphthalmologySutureless delivery formats shifting procedures from theatre to clinic
Surgical and Chronic WoundsRepeat-application protocols and payer coverage expand episode value.
Orthopedics & Sports MedicineAdhesion-barrier use grows ahead of formal reimbursement pathways.
Burn ManagementPartial-thickness coverage adopted in specialised burn centres
OthersDental, urology and veterinary uses remain early-stage but expanding.


Application mix is the single largest determinant of revenue trajectory. Ophthalmology supplies stable, evidence-backed baseline demand; chronic wound care supplies the volume upside that will define the second half of the forecast window.

By End-User

Sub-SegmentKey Trend
HospitalsRetain the largest share via inpatient surgical and burn volume
Ambulatory Surgical CentresGaining share as procedures migrate out of inpatient settings
Specialty ClinicsFastest expansion, led by dedicated wound care and ophthalmology practices
OthersLong-term care and military medicine represent niche but stable demand.


Channel economics differ sharply. Hospitals buy through group purchasing organisations at compressed margins, while specialty clinics buy direct and value simplified packaging and training over headline price.

By Geography

Sub-SegmentKey Trend
North AmericaReimbursement policy shifts redistribute share toward evidence-backed suppliers.
EuropeTender-driven procurement rewards traceability and cost-per-healed-wound data
Asia-PacificLocal processing partnerships and clearer regulatory pathways unlock volume.
South AmericaBrazil anchors regional demand through an established tissue-establishment framework.
Middle East & AfricaGulf flagship hospitals and burn-care capacity drive premium-tier purchasing


Geographic strategy increasingly diverges by maturity. Mature markets require evidence and payer engagement; emerging markets require supply localisation and distributor depth.


just now

Opus 5 High

Download PDF ×

We do not share your information with anyone. However, we may send you emails based on your report interest from time to time. You may contact us at any time to opt-out.