Request Free Sample ×

Kindly complete the form below to receive a free sample of this Report

* Please use a valid business email

Leading companies partner with us for data-driven Insights

clients tt-cursor
Hero Background
English
Chinese
French
Japanese
Korean
German
Spanish

Amines Market Size

ID: MRFR/CnM/1459-CR
111 Pages
Chitranshi Jaiswal
Last Updated: April 16, 2026

Amines Market Research Report Information By Type (Primary Amines (R-NH₂) [Methylamine, Ethylamine, Aniline, Fatty Amines, Monoethanolamine (MEA), Others], Secondary Amines (R₂-NH)[ Dimethylamine, Diethylamine, Dipropylamine, N-Ethylaniline, Diethanolamine (DEA), Others], Tertiary Amines (R₃-N)[ Trimethylamine, Triethylamine, Tributylamine, N,N-Dimethylaniline, Triethanolamine (TEA), Others]) By Hydrogenation Catalyst (Nickel (Ni)-Based Catalysts, Cobalt (Co)-Based Catalysts, Chromium-Based Catalysts, Platinum (Pt)-Based Catalysts, Iron (Fe)-Based Catalysts, Others), By Function (Solvent, Surfactant, Corrosion Inhibitor, Dispersant, Chelating Agent, Others), By End Use(Personal Care & Cosmetics, Agrochemicals, Pharmaceuticals, Cleaning Products, Oil & Gas, Textiles, Rubber & Plastics, Paper & Pulp, Others) By Region (North America, Europe, Asia Pacific, Latin America, Middle East & Africa) -Global Forecast to 2035

Share:
Download PDF ×

We do not share your information with anyone. However, we may send you emails based on your report interest from time to time. You may contact us at any time to opt-out.

Amines Market Infographic
Purchase Options

Amines Size

Amines Market Growth Projections and Opportunities

The Amines Market is impacted by numerous market parameters that act as an essential part of shaping its conditions. These parameters are regulatory landscapes, supply and demand, technological improvements, and macroeconomic tendencies.

A considerable propelling aspect for the Amines Market is the mounting query from end-use trades such as pharmaceuticals, agriculture, and chemicals. Amines obtain extensive applications in these sectors, remarkably in the manufacture of pharmaceutical drugs, pesticides, and specialty chemicals.

The global populace's steady development, linked with intelligent urbanization, impacts the emerging demand for amine-based products. Urbanization leads to escalated construction activities, driving the demand for amines in applications like cement and concrete additives.

Strict environmental guidelines and escalating sustainability concerns are regulating the Amines Market. As industries seek greener alternatives, there is a shift towards developing and adopting environmentally friendly amine products. Businesses are investing in research and development to create sustainable amine formulations.

Consistent developments in production technologies are regulating the Amines Market. Innovations in manufacturing processes lead to escalated efficiency, lowered production costs, and the development of novel amine derivatives with enhanced properties.

The Amines Market is sensible to modifications in raw material prices, exclusively those resulting from petrochemical sources. Instability in raw material prices can alter production costs and, subsequently, product evaluation in the market. Businesses need to traverse these variations to maintain competitiveness.

Geopolitical parameters and international trade relations impact the Amines Market. Taxes, geopolitical tensions, and trade agreements can impact the availability and pricing of amines, affecting the global supply chain. Businesses operating in this market are required to monitor geopolitical developments for strategic decision-making.

Investments in research and development play a pivotal role in shaping the Amines Market. Businesses that actively invest in R&D can stay ahead of the competition by introducing new and improved amine products. Consistent innovation allows businesses to fulfill evolving customer and regulatory requirements.

Strict health and safety guidelines governing the handling and use of amines impact market conditions. Agreement with these guidelines is essential for market contributors, touching product interpretations and production attempts. Businesses that spotlight safety amounts gain a competitive advantage in the market.

Broader economic trends impact the Amines Market. Economic downturns can lead to lowered demand from numerous end-use industries, while economic development can spur escalated consumption. Monitoring global economic conditions is essential for shareholders in the Amines Market to make informed business decisions.

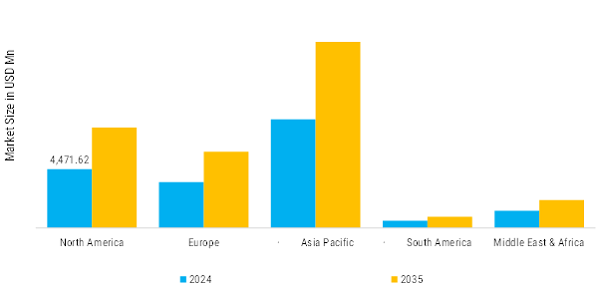
The Amines Market undergoes variations in demand and supply across different regions. Emerging markets, with their escalating industrialization and infrastructure development, present new opportunities for market participants. Understanding regional conditions is essential for effective market penetration and expansion strategies.

Amines Market Size Graph
Author
Author Profile
Chitranshi Jaiswal
Team Lead - Research

Chitranshi is a Team Leader in the Chemicals & Materials (CnM) and Energy & Power (EnP) domains, with 6+ years of experience in market research. She leads and mentors teams to deliver cross-domain projects that equip clients with actionable insights and growth strategies. She is skilled in market estimation, forecasting, competitive benchmarking, and both primary & secondary research, enabling her to turn complex data into decision-ready insights. An engineer and MBA professional, she combines technical expertise with strategic acumen to solve dynamic market challenges. Chitranshi has successfully managed projects that support market entry, investment planning, and competitive positioning, while building strong client relationships. Certified in Advanced Excel & Power BI she leverages data-driven approaches to ensure accuracy, clarity, and impactful outcomes.

Leave a Comment

FAQs

What is the projected market valuation of the Amines Market by 2035?

<p>The Amines Market is projected to reach a valuation of 3587.32 USD Million by 2035.</p>

What was the market valuation of the Amines Market in 2024?

<p>In 2024, the Amines Market was valued at 1173.83 USD Million.</p>

What is the expected CAGR for the Amines Market during the forecast period 2025 - 2035?

<p>The expected CAGR for the Amines Market during the forecast period 2025 - 2035 is 10.69%.</p>

Which companies are considered key players in the Amines Market?

<p>Key players in the Amines Market include BASF SE, Huntsman Corporation, Dow Inc., and Eastman Chemical Company.</p>

What are the primary applications of amines in various industries?

<p>Amines are primarily applied in agriculture, pharmaceuticals, personal care, textiles, and food and beverage sectors.</p>

How does the valuation of the Pharmaceuticals segment compare to others in the Amines Market?

The Pharmaceuticals segment is valued between 300.0 and 900.0 USD Million, indicating a substantial share in the Amines Market.

What is the valuation range for the Chemical Manufacturing end-use segment?

The Chemical Manufacturing end-use segment is valued between 300.0 and 900.0 USD Million.

What types of amines are included in the market analysis?

The market analysis includes primary amines, secondary amines, tertiary amines, and quaternary ammonium compounds.

What functionalities do amines serve in various applications?

Amines serve various functionalities, including solvents, surfactants, corrosion inhibitors, and catalysts.

What is the projected valuation for the Food and Beverage application segment by 2035?

The Food and Beverage application segment is projected to reach a valuation between 273.83 and 887.32 USD Million by 2035.

Market Summary

As per MRFR analysis, The Amines Market Size was valued at USD 18,074.472 Million in 2024. The Amines industry is projected to grow from USD 18,958.86 Million in 2025 to USD 30,568.72 Million by 2035, exhibiting a compound annual growth rate (CAGR) of 4.893% during the forecast period (2025–2035).

Key Market Trends & Highlights

The Amines Market dynamic shifts driven by sustainability demands, technological innovations, and expanding end-use applications.

  • Manufacturers are prioritizing bio-based and green amines to meet stringent environmental regulations and consumer preferences for low-toxicity products. Surfactants remain dominant, but specialty amines for pharmaceuticals and crop protection are surging due to high-performance needs. Hydrogenation innovations enable greener fatty amines for surfactants, improving yield and purity for personal care products. Agrochemicals leverage amine-based adjuvants for better pesticide efficacy amid climate-resilient farming needs.

Market Size & Forecast

2024 Market Size 18,074.472 (USD Million)
2035 Market Size 30,568.72 (USD Million)
CAGR (2025 - 2035) 4.893%

Major Players

BASF SE, Dow Inc., Huntsman Corporation, Eastman Chemical Company, Arkema S.A, among others.

Market Trends

The Growth of Pharmaceutical and Agricultural industry

The pharmaceutical industry heavily relies on amines for the synthesis of active pharmaceutical ingredients (APIs), which are essential in the production of a wide array of medications, including pain relievers, antihistamines, antidepressants, and more. Amines like monoethanolamine and diethanolamine are crucial building blocks in drug formulation, enabling the creation of the necessary chemical structures for therapeutic effectiveness. These amines are vital in ensuring the potency, safety, and overall quality of pharmaceutical products, which makes their role indispensable in drug development. With continuous advancements in medical research, the pharmaceutical sector is constantly innovating by introducing new drugs designed to tackle emerging health concerns, such as chronic diseases, infections, mental health disorders, and even personalized medicine. This growth in pharmaceutical innovation directly correlates to an increased demand for amines, as they are essential in synthesizing the complex molecular structures required for these drugs. As drug formulations become more specialized, there is a growing need for high-purity and tailored amines.

Strict regulatory requirements for pharmaceutical-grade chemicals mean that amines used in drug production must meet exacting standards, free of impurities to ensure both safety and effectiveness. As the market sees the introduction of new and more complex medications, including those targeting rare and niche diseases, the demand for amines with unique properties—such as improved solubility, stability, and compatibility—will continue to rise. In addition, the global expansion of pharmaceutical production to meet worldwide health needs will further drive the demand for amines. This includes the development of novel drug delivery systems, biologics, and an increasing focus on managing chronic health conditions like diabetes and cardiovascular diseases.

As pharmaceutical companies diversify their portfolios, amines are also becoming integral to the formulation of biologics and gene therapies, which require precise chemical compositions for their development. The ongoing expansion and innovation within the pharmaceutical industry, coupled with rising global healthcare demands, will significantly boost the need for amines. With these compounds being central to the creation of safe, effective, and high-quality pharmaceutical products, the amines market is poised for considerable growth, driven by their increasing use in drug development and the continuous advancement of new therapeutic options.

The increasing demand in agriculture is a major driving force for the amines market, primarily due to the growing reliance on chemical solutions for crop protection, soil enhancement, and pest management. With the global population rising, there is escalating pressure on the agricultural sector to produce food more efficiently and sustainably. Amines play a pivotal role in addressing these challenges, especially in the development of pesticides, herbicides, fungicides, and fertilizers. These chemicals are essential for safeguarding crops from pests, weeds, and diseases, while also improving soil health and the availability of nutrients. For instance, amine-based compounds like alkylamines and aromatic amines are integral to the formulation of various agrochemicals, including herbicides and insecticides, which are vital for boosting agricultural productivity. These agrochemical products help farmers fight the growing threat of pests, a significant concern for food security.

Amines Market Market Drivers

Growing demand in agriculture

The growing demand in agriculture is a key driver for the amines market due to the increasing reliance on chemical solutions for crop protection, soil fertility, and pest management. As the global population continues to grow, the pressure on agriculture to produce more food efficiently and sustainably intensifies. Amines play a critical role in this, especially in the formulation of pesticides, herbicides, fungicides, and fertilizers. These chemicals help protect crops from pests, weeds, and diseases, while also improving soil quality and nutrient availability. For example, amine-based compounds like alkylamines and aromatic amines are key ingredients in the synthesis of various agrochemicals. They are used to create herbicides and insecticides that are essential for increasing agricultural yields. These products help farmers combat the challenges posed by pests, which are a growing threat to food security.
 
As more sustainable farming practices are adopted worldwide, there is also an increasing demand for biological pesticides and bio-based fertilizers, many of which rely on amines for formulation. This shift toward more eco-friendly and efficient agricultural chemicals further drives the use of amines in the sector. Additionally, amines are crucial in the production of nitrogen-based fertilizers, which are indispensable for modern farming. Fertilizers like urea, ammonium nitrate, and ammonium sulphate are essential for boosting soil fertility and improving crop productivity.

Rise in pharmaceutical application

The pharmaceutical sector depends significantly on amines for the production of active pharmaceutical ingredients (APIs). Key amines like monoethanolamine and diethanolamine play a crucial role in the synthesis of a diverse range of medications, including pain relievers, antihistamines, and antidepressants. These amines serve as essential components in drug formulation, acting as building blocks that facilitate the creation of the chemical structures needed for therapeutic effectiveness. The use of high-purity amines is vital in ensuring the safety, potency, and overall quality of pharmaceutical products, making their role in drug development indispensable. With advancements in medical research, the pharmaceutical industry is continually introducing new drugs to address emerging health challenges, ranging from chronic diseases to infections, mental health issues, and even personalized medicine. This surge in pharmaceutical innovation directly correlates to a higher demand for amines, which are integral to the synthesis of the complex chemical structures of these medications. Moreover, the need for higher purity and more specialized amines is growing as drug formulations become more sophisticated.

Market Segment Insights

By Application: Agriculture (Largest) vs. Pharmaceuticals (Fastest-Growing)

In the Amines Market, the application segment is characterized by a diverse range of industries, with Agriculture holding the largest market share. This segment's dominance is primarily driven by the high demand for agrochemicals, particularly <a title="herbicides" href="https://www.marketresearchfuture.com/reports/herbicides-market-4853" target="_blank" rel="noopener">herbicides</a> and fertilizers, which utilize amines for enhanced efficacy. Other applications, such as Pharmaceuticals, Personal Care, Textiles, and Food and Beverage, also contribute but represent smaller proportions of the overall market. Each application plays a crucial role in driving demand for amines, reflecting their wide-reaching utility across sectors. Growth trends within the Amines Market highlight a remarkable increase in the Pharmaceuticals application, making it the fastest-growing segment. Advances in drug formulation and a rising focus on healthcare are propelling this growth, alongside a growing population that necessitates an increase in pharmaceutical production. Additionally, the Personal Care and Food and Beverage applications are expected to witness substantial growth due to shifting consumer preferences towards natural and safe ingredients. This diverse growth across applications underlines the flexibility and adaptability of amines in meeting varied market needs.

Agriculture: Dominant vs. Pharmaceuticals: Emerging

Agriculture stands as the dominant application in the Amines Market, primarily due to its extensive use in agrochemical formulations. The featurization of amines in pesticides and fertilizers significantly enhances crop yield and resilience, making it an integral component in modern farming practices. On the other hand, Pharmaceuticals represents an emerging and rapidly growing segment, driven by increasing investments in the healthcare sector and a focus on innovative drug delivery systems. Amines serve as versatile intermediates in pharmaceutical manufacturing, leading to improved therapeutic outcomes. The rising awareness regarding health and wellness further propels demand within this sector, positioning Pharmaceuticals as a competitive and crucial application amid the vast landscape of the Amines Market.

By End Use: Chemical Manufacturing (Largest) vs. Water Treatment (Fastest-Growing)

The amines market is significantly influenced by various end-use applications, with chemical manufacturing capturing the largest share. This sector benefits from the versatile use of amines in producing solvents, surfactants, and agrochemicals. Water treatment follows closely, as environmental regulations and the necessity for clean water drive significant demand for amines as chelating agents and corrosion inhibitors. The construction, automotive, and electronics sectors also contribute to market dynamics, albeit at a smaller scale compared to these prominent segments. Growth trends in the amines market are buoyed by the increasing demand for specialized chemicals in chemical manufacturing, which remains central to industrial processes. Meanwhile, the water treatment segment is emerging rapidly, driven by a growing focus on sustainable practices and the global rise in water scarcity. The automotive and electronics industries support this growth by requiring advanced materials, thus creating a synergistic effect that propels the amines market forward.

Chemical Manufacturing (Dominant) vs. Automotive (Emerging)

Chemical manufacturing stands as the dominant end-use sector within the amines market, characterized by extensive engagement in formulation and production processes that utilize a variety of amines as building blocks. These compounds serve critical roles in synthesizing chemicals that are pivotal to various applications, enabling interactions that enhance product efficacy. Conversely, the automotive sector is an emerging player, rapidly adopting amines for their roles in producing lightweight materials and advanced coatings that improve vehicle performance and fuel efficiency. This growing adoption highlights a shift in industry dynamics, as automotive suppliers increasingly depend on innovative amine-based products to meet evolving consumer expectations and environmental regulations.

By Type: Primary Amines (Largest) vs. Secondary Amines (Fastest-Growing)

The Amines Market is broadly categorized into four segments: Primary Amines, Secondary Amines, Tertiary Amines, and Quaternary Ammonium Compounds. Among these, Primary Amines hold the largest share, due to their extensive applications in the production of pharmaceuticals, agrochemicals, and surfactants. Secondary Amines, while smaller in market share, are experiencing rapid growth as demand increases across various industries like personal care and cosmetics, where they are valued for their surfactant and emulsifying properties.

Primary Amines (Dominant) vs. Secondary Amines (Emerging)

Primary Amines are the dominant segment in the Amines Market, prized for their versatility and essential role in manufacturing key chemical intermediates and specialty chemicals. The increasing utilization of Primary Amines in industries such as pharmaceuticals, agriculture, and personal care underscores their critical market position. Conversely, Secondary Amines are emerging as preferred choices in applications that require superior performance, particularly in the formulation of surfactants and personal care products. This rise is driven by consumer trends advocating for multifunctional and environmentally friendly products, presenting growth opportunities against a backdrop of competitive offerings.

By Functionality: Solvents (Largest) vs. Surfactants (Fastest-Growing)

In the Amines Market, the functionality segment showcases a diverse distribution of market share among its key components. Solvents currently lead the segment as the largest share holder due to their widespread application in various industries, including pharmaceuticals, agrochemicals, and coatings. Surfactants, on the other hand, hold a significant place, particularly in personal care and household cleaning products, thus demonstrating their relevance in current market dynamics. Growth trends in the Amines Market's functionality segment indicate a robust demand for surfactants, which are positioned as the fastest-growing category. This surge is largely driven by increasing consumer awareness of eco-friendly products and effective cleaners. The corrosion inhibitors and catalysts also show promising growth, aided by advancement in technologies and rising industrial applications where efficient chemical processes are essential.

Solvents (Dominant) vs. Catalysts (Emerging)

Solvents serve as a dominant force in the Amines Market, widely recognized for their versatility and efficacy in various applications such as solvents for chemical reactions and formulations in coatings and inks. Their chemical properties enable smooth operation across a range of temperatures and conditions, solidifying their position in industries like pharmaceuticals and automotive. Conversely, catalysts represent an emerging segment in this market, gaining traction due to their ability to enhance chemical reactions and reduce energy consumption across manufacturing processes. With the growing emphasis on sustainability, the demand for efficient catalysts, particularly in green chemistry applications, is on the rise. As industries evolve, both solvents and catalysts will play crucial roles in shaping market trends.

By Form: Liquid (Largest) vs. Solid (Fastest-Growing)

The amines market is characterized by its diverse forms, with liquid amines holding the largest market share. This segment is primarily driven by the widespread application of liquid amines in agriculture, pharmaceuticals, and chemical manufacturing. Solid amines, while smaller in overall share, are rapidly gaining traction due to their unique benefits in specific applications, including catalysts and polymerization processes. Gas amines, although present, represent a minimal segment in comparison to liquid and solid forms.

Liquid (Dominant) vs. Solid (Emerging)

Liquid amines dominate the amines market thanks to their versatile applications across various industries. Their fluid nature allows for easy handling and integration into numerous processes, particularly in solvents and surfactants. In contrast, solid amines are emerging as critical components in specialized applications such as polymer production and construction materials. Despite their smaller market share, the increasing demand for high-performance materials is driving innovation and growth in the solid amines segment. These evolving formulations are likely to position solid amines as a vital alternative to their liquid counterparts, catering to niche industries seeking enhanced performance.

Get more detailed insights about Amines Market Research Report - Forecast Till 2035

Regional Insights

North America: Growth Amines

In North America, the supply of amines is predominantly driven by established chemical manufacturing hubs in the United States and Canada. Major producers in this region include both global chemical companies and regional players, who supply amines for pharmaceuticals, agriculture, and industrial applications. North America’s industrial and chemical markets. The supply chain in this region remains relatively stable, but future supply disruptions could arise due to trade tensions, raw material costs, or environmental regulations.

Amines Market Regional Insights

Europe: Emerging Amines production

Europe’s supply of amines is robust, with several key chemical manufacturing countries, including Germany, France, and the Netherlands, serving as primary production hubs. The European market is heavily integrated with global supply chains, allowing access to amines produced both domestically and through imports, particularly from the Middle East and Asia. The region’s supply is characterized by high standards for product quality and regulatory compliance, especially for applications in pharmaceuticals, textiles, and personal care. The European Union’s REACH (Registration, Evaluation, Authorisation, and Restriction of Chemicals) regulations have prompted stricter controls over chemical production, ensuring that only safe, high-quality amines are used. While Europe is largely self-sufficient in amine production, the increasing demand for specialty amines, particularly in biotech and pharma, may lead to a rise in imports from other regions to meet the specialized requirements.

Asia-Pacific: Rapidly Growing producer and consumer Amines

Asia-Pacific is both the large producer and consumer of amines globally, led by China and India. The region benefits from large-scale petrochemical production, lower labour costs, and established infrastructure, which positions it as the dominant supplier of amines for industrial, agricultural, and pharmaceutical applications. The growing demand for high-performance amines in the automotive, agriculture, and personal care industries has also bolstered regional supply. However, supply in the region faces challenges such as air and water pollution regulations, volatility in raw material prices, and the risk of supply chain disruptions due to geopolitical tensions, such as the U.S.-China trade war.

Middle East and Africa: Emerging Amine Supply

The Middle East, particularly countries like Saudi Arabia and the UAE, has a well-established petrochemical industry that supports a strong amine supply. The region's advantage lies in its access to inexpensive raw materials derived from oil and natural gas, making amines production relatively cost-effective. However, the supply of amines in the Middle East is often oriented toward industrial applications, such as in the production of fertilizers, petrochemicals, and textiles. As demand grows for industrial and agricultural products, and with increasing investments in pharmaceutical infrastructure in Africa, imports of amines are expected to rise.

South America: Growth rapidly Amines

South America’s amine supply is primarily concentrated in Brazil and Argentina, which have the most developed chemical manufacturing sectors in the region. While these countries are capable of producing a range of amines, their domestic production is often insufficient to meet local demand, particularly for high-purity or specialty grades of amines. As a result, South American countries rely on imports from North America, Europe, and Asia to fill the supply gap. The demand for amines in the region is primarily driven by the agricultural and industrial sectors, with increasing applications in pharmaceuticals and personal care. However, the supply chain in South America can be vulnerable to fluctuations in commodity prices, political instability, and logistical challenges, such as transportation inefficiencies and infrastructure limitations.

Key Players and Competitive Insights

Many global, regional, and local vendors characterize the Amines Market. The market is highly competitive, with all the players competing to gain market share. Intense competition, rapid advances in technology, frequent changes in government policies, and environmental regulations are key factors that confront market growth. The vendors compete based on cost, product quality, reliability, and government regulations. Vendors must provide cost-efficient, high-quality products to survive and succeed in an intensely competitive market.
 
The major players in the market include BASF SE, Dow Inc., Huntsman Corporation, Eastman Chemical Company, Arkema S.A, among others strategic market developments and decisions to improve operational effectiveness.

Key Companies in the Amines Market include

Industry Developments

In 2024, Nouryon announced that it is now certified to the International Sustainability and Carbon Certification standard ISCC PLUS for the production of green ethylene oxide, ethanolamines, ethylene amines, and the surfactants derived from these raw materials at its site in Stenungsund, Sweden.

Future Outlook

Amines Market Future Outlook

Amines Market is projected to grow at a 4.983% CAGR from 2025 to 2035, driven by growing geriatric population and technological advancements.

New opportunities lie in:

  • <p>Growing Demand in Personal Care &amp; Cosmetics</p>
  • <p>Increasing Adoption of Green Chemistry</p>
  • <p>Booming Textile Industry.</p>

By 2035, the Amines Market is expected to achieve robust growth, solidifying its position as a key industry.

Market Segmentation

Amines Market, By Type Outlook

  • Primary Amines (R-NH₂)
  • Secondary Amines (R₂-NH)
  • Tertiary Amines (R₃-N)

Amines Market, By End-Use Outlook

  • Personal Care & Cosmetics
  • Agrochemicals
  • Pharmaceuticals
  • Cleaning Products
  • Oil & Gas
  • Textiles
  • Rubber & Plastics
  • Paper & Pulp
  • Others

Amines Market, By Function Outlook

  • Solvent
  • Surfactant
  • Corrosion Inhibitor
  • Dispersant
  • Chelating Agent
  • Others

Amines Market, Hydrogenation Catalyst Type Outlook

  • Nickel (Ni)-Based Catalysts
  • Cobalt (Co)-Based Catalysts
  • Chromium-Based Catalysts
  • Platinum (Pt)-Based Catalysts
  • Iron (Fe)-Based Catalysts
  • Others

Report Scope

Market Size 2024 18,074.472 (USD Million)
Market Size 2025 18,958.86 (USD Million)
Market Size 2035 30,568.72 (USD Million)
Compound Annual Growth Rate (CAGR) 4.893% (2025 - 2035)
Report Coverage Revenue Forecast, Competitive Landscape, Growth Factors, and Trends
Base Year 2024
Market Forecast Period 2025 - 2035
Historical Data 2019 - 2023
Market Forecast Units USD Million
Key Companies Profiled BASF SE, Dow Inc., Huntsman Corporation, Eastman Chemical Company, Arkema S.A, among other
Segments Covered By Type, By Hydrogenation Catalyst Type, By Function, By End-Use
Key Market Opportunities ·         Growing Demand in Personal Care & Cosmetics ·         Increasing Adoption of Green Chemistry ·         Booming Textile Industry
Key Market Dynamics ·         Growing Demand in Agriculture ·         Rise in Pharmaceutical Application
Region Covered North America, Europe, Asia-Pacific, South America, Middle East & Africa.


FAQs

What is the projected market valuation of the Amines Market by 2035?

<p>The Amines Market is projected to reach a valuation of 3587.32 USD Million by 2035.</p>

What was the market valuation of the Amines Market in 2024?

<p>In 2024, the Amines Market was valued at 1173.83 USD Million.</p>

What is the expected CAGR for the Amines Market during the forecast period 2025 - 2035?

<p>The expected CAGR for the Amines Market during the forecast period 2025 - 2035 is 10.69%.</p>

Which companies are considered key players in the Amines Market?

<p>Key players in the Amines Market include BASF SE, Huntsman Corporation, Dow Inc., and Eastman Chemical Company.</p>

What are the primary applications of amines in various industries?

<p>Amines are primarily applied in agriculture, pharmaceuticals, personal care, textiles, and food and beverage sectors.</p>

How does the valuation of the Pharmaceuticals segment compare to others in the Amines Market?

The Pharmaceuticals segment is valued between 300.0 and 900.0 USD Million, indicating a substantial share in the Amines Market.

What is the valuation range for the Chemical Manufacturing end-use segment?

The Chemical Manufacturing end-use segment is valued between 300.0 and 900.0 USD Million.

What types of amines are included in the market analysis?

The market analysis includes primary amines, secondary amines, tertiary amines, and quaternary ammonium compounds.

What functionalities do amines serve in various applications?

Amines serve various functionalities, including solvents, surfactants, corrosion inhibitors, and catalysts.

What is the projected valuation for the Food and Beverage application segment by 2035?

The Food and Beverage application segment is projected to reach a valuation between 273.83 and 887.32 USD Million by 2035.

  1. SECTION I: EXECUTIVE SUMMARY AND KEY HIGHLIGHTS |
    1. EXECUTIVE SUMMARY | |
      1. Market Overview | |
      2. Key Findings | |
      3. Market Segmentation | |
      4. Competitive Landscape | |
      5. Challenges and Opportunities | |
      6. Future Outlook 2
  2. SECTION II: SCOPING, METHODOLOGY AND MARKET STRUCTURE |
    1. MARKET INTRODUCTION | |
      1. Definition | |
      2. Scope of the study | | |
    2. RESEARCH METHODOLOGY | |
      1. Overview | |
      2. Data Mining | |
      3. Secondary Research | |
      4. Primary Research | | |
      5. Forecasting Model | |
      6. Market Size Estimation | | |
      7. Data Triangulation | |
      8. Validation 3
  3. SECTION III: QUALITATIVE ANALYSIS |
    1. MARKET DYNAMICS | |
      1. Overview | |
      2. Drivers | |
      3. Restraints | |
      4. Opportunities |
    2. MARKET FACTOR ANALYSIS | |
      1. Value chain Analysis | |
      2. Porter's Five Forces Analysis | | |
      3. COVID-19 Impact Analysis | | |
  4. SECTION IV: QUANTITATIVE ANALYSIS |
    1. Chemicals and Materials, BY Application (USD Million) | |
      1. Agriculture | |
      2. Pharmaceuticals | |
      3. Personal Care | |
      4. Textiles | |
      5. Food and Beverage |
    2. Chemicals and Materials, BY End Use (USD Million) | |
      1. Chemical Manufacturing | |
      2. Water Treatment | |
      3. Construction | |
      4. Automotive | |
      5. Electronics |
    3. Chemicals and Materials, BY Type (USD Million) | |
      1. Primary Amines | |
      2. Secondary Amines | |
      3. Tertiary Amines | |
      4. Quaternary Ammonium Compounds |
    4. Chemicals and Materials, BY Functionality (USD Million) | |
      1. Solvents | |
      2. Surfactants | |
      3. Corrosion Inhibitors | |
      4. Catalysts |
    5. Chemicals and Materials, BY Form (USD Million) | |
      1. Liquid | |
      2. Solid | |
      3. Gas |
    6. Chemicals and Materials, BY Region (USD Million) | |
      1. North America | | |
      2. Europe | | |
      3. APAC | | |
      4. South America | | |
      5. MEA | | |
  5. SECTION V: COMPETITIVE ANALYSIS |
    1. Competitive Landscape | |
      1. Overview | |
      2. Competitive Analysis | |
      3. Market share Analysis | |
      4. Major Growth Strategy in the Chemicals and Materials | |
      5. Competitive Benchmarking | |
      6. Leading Players in Terms of Number of Developments in the Chemicals and Materials | |
      7. Key developments and growth strategies | | |
      8. Major Players Financial Matrix | | |
    2. Company Profiles | |
      1. BASF SE (DE) | | |
      2. Huntsman Corporation (US) | | |
      3. Dow Inc. (US) | | |
      4. Eastman Chemical Company (US) | | |
      5. AkzoNobel N.V. (NL) | | |
      6. Mitsubishi Gas Chemical Company, Inc. (JP) | | |
      7. Solvay S.A. (BE) | | |
      8. Alkyl Amines Chemicals Limited (IN) | | |
      9. Taminco (BE) | | |
    3. Appendix | |
      1. References | |
      2. Related Reports 6 LIST OF FIGURES |
    4. MARKET SYNOPSIS |
    5. NORTH AMERICA MARKET ANALYSIS |
    6. US MARKET ANALYSIS BY APPLICATION |
    7. US MARKET ANALYSIS BY END USE |
    8. US MARKET ANALYSIS BY TYPE |
    9. US MARKET ANALYSIS BY FUNCTIONALITY |
    10. US MARKET ANALYSIS BY FORM |
    11. CANADA MARKET ANALYSIS BY APPLICATION |
    12. CANADA MARKET ANALYSIS BY END USE |
    13. CANADA MARKET ANALYSIS BY TYPE |
    14. CANADA MARKET ANALYSIS BY FUNCTIONALITY |
    15. CANADA MARKET ANALYSIS BY FORM |
    16. EUROPE MARKET ANALYSIS |
    17. GERMANY MARKET ANALYSIS BY APPLICATION |
    18. GERMANY MARKET ANALYSIS BY END USE |
    19. GERMANY MARKET ANALYSIS BY TYPE |
    20. GERMANY MARKET ANALYSIS BY FUNCTIONALITY |
    21. GERMANY MARKET ANALYSIS BY FORM |
    22. UK MARKET ANALYSIS BY APPLICATION |
    23. UK MARKET ANALYSIS BY END USE |
    24. UK MARKET ANALYSIS BY TYPE |
    25. UK MARKET ANALYSIS BY FUNCTIONALITY |
    26. UK MARKET ANALYSIS BY FORM |
    27. FRANCE MARKET ANALYSIS BY APPLICATION |
    28. FRANCE MARKET ANALYSIS BY END USE |
    29. FRANCE MARKET ANALYSIS BY TYPE |
    30. FRANCE MARKET ANALYSIS BY FUNCTIONALITY |
    31. FRANCE MARKET ANALYSIS BY FORM |
    32. RUSSIA MARKET ANALYSIS BY APPLICATION |
    33. RUSSIA MARKET ANALYSIS BY END USE |
    34. RUSSIA MARKET ANALYSIS BY TYPE |
    35. RUSSIA MARKET ANALYSIS BY FUNCTIONALITY |
    36. RUSSIA MARKET ANALYSIS BY FORM |
    37. ITALY MARKET ANALYSIS BY APPLICATION |
    38. ITALY MARKET ANALYSIS BY END USE |
    39. ITALY MARKET ANALYSIS BY TYPE |
    40. ITALY MARKET ANALYSIS BY FUNCTIONALITY |
    41. ITALY MARKET ANALYSIS BY FORM |
    42. SPAIN MARKET ANALYSIS BY APPLICATION |
    43. SPAIN MARKET ANALYSIS BY END USE |
    44. SPAIN MARKET ANALYSIS BY TYPE |
    45. SPAIN MARKET ANALYSIS BY FUNCTIONALITY |
    46. SPAIN MARKET ANALYSIS BY FORM |
    47. REST OF EUROPE MARKET ANALYSIS BY APPLICATION |
    48. REST OF EUROPE MARKET ANALYSIS BY END USE |
    49. REST OF EUROPE MARKET ANALYSIS BY TYPE |
    50. REST OF EUROPE MARKET ANALYSIS BY FUNCTIONALITY |
    51. REST OF EUROPE MARKET ANALYSIS BY FORM |
    52. APAC MARKET ANALYSIS |
    53. CHINA MARKET ANALYSIS BY APPLICATION |
    54. CHINA MARKET ANALYSIS BY END USE |
    55. CHINA MARKET ANALYSIS BY TYPE |
    56. CHINA MARKET ANALYSIS BY FUNCTIONALITY |
    57. CHINA MARKET ANALYSIS BY FORM |
    58. INDIA MARKET ANALYSIS BY APPLICATION |
    59. INDIA MARKET ANALYSIS BY END USE |
    60. INDIA MARKET ANALYSIS BY TYPE |
    61. INDIA MARKET ANALYSIS BY FUNCTIONALITY |
    62. INDIA MARKET ANALYSIS BY FORM |
    63. JAPAN MARKET ANALYSIS BY APPLICATION |
    64. JAPAN MARKET ANALYSIS BY END USE |
    65. JAPAN MARKET ANALYSIS BY TYPE |
    66. JAPAN MARKET ANALYSIS BY FUNCTIONALITY |
    67. JAPAN MARKET ANALYSIS BY FORM |
    68. SOUTH KOREA MARKET ANALYSIS BY APPLICATION |
    69. SOUTH KOREA MARKET ANALYSIS BY END USE |
    70. SOUTH KOREA MARKET ANALYSIS BY TYPE |
    71. SOUTH KOREA MARKET ANALYSIS BY FUNCTIONALITY |
    72. SOUTH KOREA MARKET ANALYSIS BY FORM |
    73. MALAYSIA MARKET ANALYSIS BY APPLICATION |
    74. MALAYSIA MARKET ANALYSIS BY END USE |
    75. MALAYSIA MARKET ANALYSIS BY TYPE |
    76. MALAYSIA MARKET ANALYSIS BY FUNCTIONALITY |
    77. MALAYSIA MARKET ANALYSIS BY FORM |
    78. THAILAND MARKET ANALYSIS BY APPLICATION |
    79. THAILAND MARKET ANALYSIS BY END USE |
    80. THAILAND MARKET ANALYSIS BY TYPE |
    81. THAILAND MARKET ANALYSIS BY FUNCTIONALITY |
    82. THAILAND MARKET ANALYSIS BY FORM |
    83. INDONESIA MARKET ANALYSIS BY APPLICATION |
    84. INDONESIA MARKET ANALYSIS BY END USE |
    85. INDONESIA MARKET ANALYSIS BY TYPE |
    86. INDONESIA MARKET ANALYSIS BY FUNCTIONALITY |
    87. INDONESIA MARKET ANALYSIS BY FORM |
    88. REST OF APAC MARKET ANALYSIS BY APPLICATION |
    89. REST OF APAC MARKET ANALYSIS BY END USE |
    90. REST OF APAC MARKET ANALYSIS BY TYPE |
    91. REST OF APAC MARKET ANALYSIS BY FUNCTIONALITY |
    92. REST OF APAC MARKET ANALYSIS BY FORM |
    93. SOUTH AMERICA MARKET ANALYSIS |
    94. BRAZIL MARKET ANALYSIS BY APPLICATION |
    95. BRAZIL MARKET ANALYSIS BY END USE |
    96. BRAZIL MARKET ANALYSIS BY TYPE |
    97. BRAZIL MARKET ANALYSIS BY FUNCTIONALITY |
    98. BRAZIL MARKET ANALYSIS BY FORM |
    99. MEXICO MARKET ANALYSIS BY APPLICATION |
    100. MEXICO MARKET ANALYSIS BY END USE |
    101. MEXICO MARKET ANALYSIS BY TYPE |
    102. MEXICO MARKET ANALYSIS BY FUNCTIONALITY |
    103. MEXICO MARKET ANALYSIS BY FORM |
    104. ARGENTINA MARKET ANALYSIS BY APPLICATION |
    105. ARGENTINA MARKET ANALYSIS BY END USE |
    106. ARGENTINA MARKET ANALYSIS BY TYPE |
    107. ARGENTINA MARKET ANALYSIS BY FUNCTIONALITY |
    108. ARGENTINA MARKET ANALYSIS BY FORM |
    109. REST OF SOUTH AMERICA MARKET ANALYSIS BY APPLICATION |
    110. REST OF SOUTH AMERICA MARKET ANALYSIS BY END USE |
    111. REST OF SOUTH AMERICA MARKET ANALYSIS BY TYPE |
    112. REST OF SOUTH AMERICA MARKET ANALYSIS BY FUNCTIONALITY |
    113. REST OF SOUTH AMERICA MARKET ANALYSIS BY FORM |
    114. MEA MARKET ANALYSIS |
    115. GCC COUNTRIES MARKET ANALYSIS BY APPLICATION |
    116. GCC COUNTRIES MARKET ANALYSIS BY END USE |
    117. GCC COUNTRIES MARKET ANALYSIS BY TYPE |
    118. GCC COUNTRIES MARKET ANALYSIS BY FUNCTIONALITY |
    119. GCC COUNTRIES MARKET ANALYSIS BY FORM |
    120. SOUTH AFRICA MARKET ANALYSIS BY APPLICATION |
    121. SOUTH AFRICA MARKET ANALYSIS BY END USE |
    122. SOUTH AFRICA MARKET ANALYSIS BY TYPE |
    123. SOUTH AFRICA MARKET ANALYSIS BY FUNCTIONALITY |
    124. SOUTH AFRICA MARKET ANALYSIS BY FORM |
    125. REST OF MEA MARKET ANALYSIS BY APPLICATION |
    126. REST OF MEA MARKET ANALYSIS BY END USE |
    127. REST OF MEA MARKET ANALYSIS BY TYPE |
    128. REST OF MEA MARKET ANALYSIS BY FUNCTIONALITY |
    129. REST OF MEA MARKET ANALYSIS BY FORM |
    130. KEY BUYING CRITERIA OF CHEMICALS AND MATERIALS |
    131. RESEARCH PROCESS OF MRFR |
    132. DRO ANALYSIS OF CHEMICALS AND MATERIALS |
    133. DRIVERS IMPACT ANALYSIS: CHEMICALS AND MATERIALS |
    134. RESTRAINTS IMPACT ANALYSIS: CHEMICALS AND MATERIALS |
    135. SUPPLY / VALUE CHAIN: CHEMICALS AND MATERIALS |
    136. CHEMICALS AND MATERIALS, BY APPLICATION, 2024 (% SHARE) |
    137. CHEMICALS AND MATERIALS, BY APPLICATION, 2024 TO 2035 (USD Million) |
    138. CHEMICALS AND MATERIALS, BY END USE, 2024 (% SHARE) |
    139. CHEMICALS AND MATERIALS, BY END USE, 2024 TO 2035 (USD Million) |
    140. CHEMICALS AND MATERIALS, BY TYPE, 2024 (% SHARE) |
    141. CHEMICALS AND MATERIALS, BY TYPE, 2024 TO 2035 (USD Million) |
    142. CHEMICALS AND MATERIALS, BY FUNCTIONALITY, 2024 (% SHARE) |
    143. CHEMICALS AND MATERIALS, BY FUNCTIONALITY, 2024 TO 2035 (USD Million) |
    144. CHEMICALS AND MATERIALS, BY FORM, 2024 (% SHARE) |
    145. CHEMICALS AND MATERIALS, BY FORM, 2024 TO 2035 (USD Million) |
    146. BENCHMARKING OF MAJOR COMPETITORS 7 LIST OF TABLES |
    147. LIST OF ASSUMPTIONS | |
      1. |
    148. North America MARKET SIZE ESTIMATES; FORECAST | |
      1. BY APPLICATION, 2025-2035 (USD Million) | |
      2. BY END USE, 2025-2035 (USD Million) | |
      3. BY TYPE, 2025-2035 (USD Million) | |
      4. BY FUNCTIONALITY, 2025-2035 (USD Million) | |
      5. BY FORM, 2025-2035 (USD Million) |
    149. US MARKET SIZE ESTIMATES; FORECAST | |
      1. BY APPLICATION, 2025-2035 (USD Million) | |
      2. BY END USE, 2025-2035 (USD Million) | |
      3. BY TYPE, 2025-2035 (USD Million) | |
      4. BY FUNCTIONALITY, 2025-2035 (USD Million) | |
      5. BY FORM, 2025-2035 (USD Million) |
    150. Canada MARKET SIZE ESTIMATES; FORECAST | |
      1. BY APPLICATION, 2025-2035 (USD Million) | |
      2. BY END USE, 2025-2035 (USD Million) | |
      3. BY TYPE, 2025-2035 (USD Million) | |
      4. BY FUNCTIONALITY, 2025-2035 (USD Million) | |
      5. BY FORM, 2025-2035 (USD Million) |
    151. Europe MARKET SIZE ESTIMATES; FORECAST | |
      1. BY APPLICATION, 2025-2035 (USD Million) | |
      2. BY END USE, 2025-2035 (USD Million) | |
      3. BY TYPE, 2025-2035 (USD Million) | |
      4. BY FUNCTIONALITY, 2025-2035 (USD Million) | |
      5. BY FORM, 2025-2035 (USD Million) |
    152. Germany MARKET SIZE ESTIMATES; FORECAST | |
      1. BY APPLICATION, 2025-2035 (USD Million) | |
      2. BY END USE, 2025-2035 (USD Million) | |
      3. BY TYPE, 2025-2035 (USD Million) | |
      4. BY FUNCTIONALITY, 2025-2035 (USD Million) | |
      5. BY FORM, 2025-2035 (USD Million) |
    153. UK MARKET SIZE ESTIMATES; FORECAST | |
      1. BY APPLICATION, 2025-2035 (USD Million) | |
      2. BY END USE, 2025-2035 (USD Million) | |
      3. BY TYPE, 2025-2035 (USD Million) | |
      4. BY FUNCTIONALITY, 2025-2035 (USD Million) | |
      5. BY FORM, 2025-2035 (USD Million) |
    154. France MARKET SIZE ESTIMATES; FORECAST | |
      1. BY APPLICATION, 2025-2035 (USD Million) | |
      2. BY END USE, 2025-2035 (USD Million) | |
      3. BY TYPE, 2025-2035 (USD Million) | |
      4. BY FUNCTIONALITY, 2025-2035 (USD Million) | |
      5. BY FORM, 2025-2035 (USD Million) |
    155. Russia MARKET SIZE ESTIMATES; FORECAST | |
      1. BY APPLICATION, 2025-2035 (USD Million) | |
      2. BY END USE, 2025-2035 (USD Million) | |
      3. BY TYPE, 2025-2035 (USD Million) | |
      4. BY FUNCTIONALITY, 2025-2035 (USD Million) | |
      5. BY FORM, 2025-2035 (USD Million) |
    156. Italy MARKET SIZE ESTIMATES; FORECAST | |
      1. BY APPLICATION, 2025-2035 (USD Million) | |
      2. BY END USE, 2025-2035 (USD Million) | |
      3. BY TYPE, 2025-2035 (USD Million) | |
      4. BY FUNCTIONALITY, 2025-2035 (USD Million) | |
      5. BY FORM, 2025-2035 (USD Million) |
    157. Spain MARKET SIZE ESTIMATES; FORECAST | |
      1. BY APPLICATION, 2025-2035 (USD Million) | |
      2. BY END USE, 2025-2035 (USD Million) | |
      3. BY TYPE, 2025-2035 (USD Million) | |
      4. BY FUNCTIONALITY, 2025-2035 (USD Million) | |
      5. BY FORM, 2025-2035 (USD Million) |
    158. Rest of Europe MARKET SIZE ESTIMATES; FORECAST | |
      1. BY APPLICATION, 2025-2035 (USD Million) | |
      2. BY END USE, 2025-2035 (USD Million) | |
      3. BY TYPE, 2025-2035 (USD Million) | |
      4. BY FUNCTIONALITY, 2025-2035 (USD Million) | |
      5. BY FORM, 2025-2035 (USD Million) |
    159. APAC MARKET SIZE ESTIMATES; FORECAST | |
      1. BY APPLICATION, 2025-2035 (USD Million) | |
      2. BY END USE, 2025-2035 (USD Million) | |
      3. BY TYPE, 2025-2035 (USD Million) | |
      4. BY FUNCTIONALITY, 2025-2035 (USD Million) | |
      5. BY FORM, 2025-2035 (USD Million) |
    160. China MARKET SIZE ESTIMATES; FORECAST | |
      1. BY APPLICATION, 2025-2035 (USD Million) | |
      2. BY END USE, 2025-2035 (USD Million) | |
      3. BY TYPE, 2025-2035 (USD Million) | |
      4. BY FUNCTIONALITY, 2025-2035 (USD Million) | |
      5. BY FORM, 2025-2035 (USD Million) |
    161. India MARKET SIZE ESTIMATES; FORECAST | |
      1. BY APPLICATION, 2025-2035 (USD Million) | |
      2. BY END USE, 2025-2035 (USD Million) | |
      3. BY TYPE, 2025-2035 (USD Million) | |
      4. BY FUNCTIONALITY, 2025-2035 (USD Million) | |
      5. BY FORM, 2025-2035 (USD Million) |
    162. Japan MARKET SIZE ESTIMATES; FORECAST | |
      1. BY APPLICATION, 2025-2035 (USD Million) | |
      2. BY END USE, 2025-2035 (USD Million) | |
      3. BY TYPE, 2025-2035 (USD Million) | |
      4. BY FUNCTIONALITY, 2025-2035 (USD Million) | |
      5. BY FORM, 2025-2035 (USD Million) |
    163. South Korea MARKET SIZE ESTIMATES; FORECAST | |
      1. BY APPLICATION, 2025-2035 (USD Million) | |
      2. BY END USE, 2025-2035 (USD Million) | |
      3. BY TYPE, 2025-2035 (USD Million) | |
      4. BY FUNCTIONALITY, 2025-2035 (USD Million) | |
      5. BY FORM, 2025-2035 (USD Million) |
    164. Malaysia MARKET SIZE ESTIMATES; FORECAST | |
      1. BY APPLICATION, 2025-2035 (USD Million) | |
      2. BY END USE, 2025-2035 (USD Million) | |
      3. BY TYPE, 2025-2035 (USD Million) | |
      4. BY FUNCTIONALITY, 2025-2035 (USD Million) | |
      5. BY FORM, 2025-2035 (USD Million) |
    165. Thailand MARKET SIZE ESTIMATES; FORECAST | |
      1. BY APPLICATION, 2025-2035 (USD Million) | |
      2. BY END USE, 2025-2035 (USD Million) | |
      3. BY TYPE, 2025-2035 (USD Million) | |
      4. BY FUNCTIONALITY, 2025-2035 (USD Million) | |
      5. BY FORM, 2025-2035 (USD Million) |
    166. Indonesia MARKET SIZE ESTIMATES; FORECAST | |
      1. BY APPLICATION, 2025-2035 (USD Million) | |
      2. BY END USE, 2025-2035 (USD Million) | |
      3. BY TYPE, 2025-2035 (USD Million) | |
      4. BY FUNCTIONALITY, 2025-2035 (USD Million) | |
      5. BY FORM, 2025-2035 (USD Million) |
    167. Rest of APAC MARKET SIZE ESTIMATES; FORECAST | |
      1. BY APPLICATION, 2025-2035 (USD Million) | |
      2. BY END USE, 2025-2035 (USD Million) | |
      3. BY TYPE, 2025-2035 (USD Million) | |
      4. BY FUNCTIONALITY, 2025-2035 (USD Million) | |
      5. BY FORM, 2025-2035 (USD Million) |
    168. South America MARKET SIZE ESTIMATES; FORECAST | |
      1. BY APPLICATION, 2025-2035 (USD Million) | |
      2. BY END USE, 2025-2035 (USD Million) | |
      3. BY TYPE, 2025-2035 (USD Million) | |
      4. BY FUNCTIONALITY, 2025-2035 (USD Million) | |
      5. BY FORM, 2025-2035 (USD Million) |
    169. Brazil MARKET SIZE ESTIMATES; FORECAST | |
      1. BY APPLICATION, 2025-2035 (USD Million) | |
      2. BY END USE, 2025-2035 (USD Million) | |
      3. BY TYPE, 2025-2035 (USD Million) | |
      4. BY FUNCTIONALITY, 2025-2035 (USD Million) | |
      5. BY FORM, 2025-2035 (USD Million) |
    170. Mexico MARKET SIZE ESTIMATES; FORECAST | |
      1. BY APPLICATION, 2025-2035 (USD Million) | |
      2. BY END USE, 2025-2035 (USD Million) | |
      3. BY TYPE, 2025-2035 (USD Million) | |
      4. BY FUNCTIONALITY, 2025-2035 (USD Million) | |
      5. BY FORM, 2025-2035 (USD Million) |
    171. Argentina MARKET SIZE ESTIMATES; FORECAST | |
      1. BY APPLICATION, 2025-2035 (USD Million) | |
      2. BY END USE, 2025-2035 (USD Million) | |
      3. BY TYPE, 2025-2035 (USD Million) | |
      4. BY FUNCTIONALITY, 2025-2035 (USD Million) | |
      5. BY FORM, 2025-2035 (USD Million) |
    172. Rest of South America MARKET SIZE ESTIMATES; FORECAST | |
      1. BY APPLICATION, 2025-2035 (USD Million) | |
      2. BY END USE, 2025-2035 (USD Million) | |
      3. BY TYPE, 2025-2035 (USD Million) | |
      4. BY FUNCTIONALITY, 2025-2035 (USD Million) | |
      5. BY FORM, 2025-2035 (USD Million) |
    173. MEA MARKET SIZE ESTIMATES; FORECAST | |
      1. BY APPLICATION, 2025-2035 (USD Million) | |
      2. BY END USE, 2025-2035 (USD Million) | |
      3. BY TYPE, 2025-2035 (USD Million) | |
      4. BY FUNCTIONALITY, 2025-2035 (USD Million) | |
      5. BY FORM, 2025-2035 (USD Million) |
    174. GCC Countries MARKET SIZE ESTIMATES; FORECAST | |
      1. BY APPLICATION, 2025-2035 (USD Million) | |
      2. BY END USE, 2025-2035 (USD Million) | |
      3. BY TYPE, 2025-2035 (USD Million) | |
      4. BY FUNCTIONALITY, 2025-2035 (USD Million) | |
      5. BY FORM, 2025-2035 (USD Million) |
    175. South Africa MARKET SIZE ESTIMATES; FORECAST | |
      1. BY APPLICATION, 2025-2035 (USD Million) | |
      2. BY END USE, 2025-2035 (USD Million) | |
      3. BY TYPE, 2025-2035 (USD Million) | |
      4. BY FUNCTIONALITY, 2025-2035 (USD Million) | |
      5. BY FORM, 2025-2035 (USD Million) |
    176. Rest of MEA MARKET SIZE ESTIMATES; FORECAST | |
      1. BY APPLICATION, 2025-2035 (USD Million) | |
      2. BY END USE, 2025-2035 (USD Million) | |
      3. BY TYPE, 2025-2035 (USD Million) | |
      4. BY FUNCTIONALITY, 2025-2035 (USD Million) | |
      5. BY FORM, 2025-2035 (USD Million) |
    177. PRODUCT LAUNCH/PRODUCT DEVELOPMENT/APPROVAL | |
      1. |
    178. ACQUISITION/PARTNERSHIP | |

Chemicals and Materials Market Segmentation

Chemicals and Materials By Application (USD Million, 2025-2035)

  • Agriculture
  • Pharmaceuticals
  • Personal Care
  • Textiles
  • Food and Beverage

Chemicals and Materials By End Use (USD Million, 2025-2035)

  • Chemical Manufacturing
  • Water Treatment
  • Construction
  • Automotive
  • Electronics

Chemicals and Materials By Type (USD Million, 2025-2035)

  • Primary Amines
  • Secondary Amines
  • Tertiary Amines
  • Quaternary Ammonium Compounds

Chemicals and Materials By Functionality (USD Million, 2025-2035)

  • Solvents
  • Surfactants
  • Corrosion Inhibitors
  • Catalysts

Chemicals and Materials By Form (USD Million, 2025-2035)

  • Liquid
  • Solid
  • Gas
Infographic

Free Sample Request

Kindly complete the form below to receive a free sample of this Report

Get Free Sample

Customer Strories

Compare Licence

×
Features License Type
Single User Multiuser License Enterprise User
Price $4,950 $5,950 $7,250
Maximum User Access Limit 1 User Upto 10 Users Unrestricted Access Throughout the Organization
Free Customization
Direct Access to Analyst
Deliverable Format
Platform Access
Discount on Next Purchase 10% 15% 15%
Printable Versions