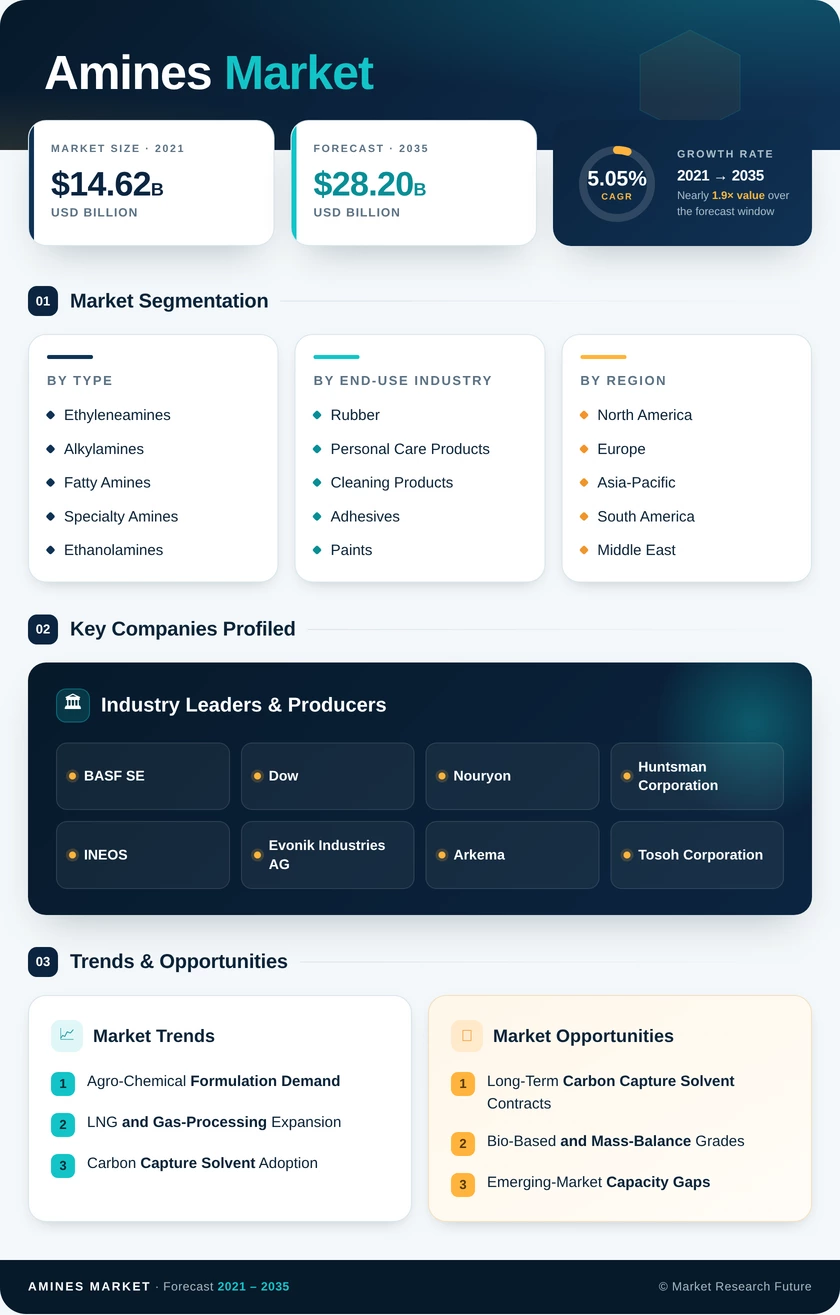
Amines Market (2026 - 2035)

ID: MRFR/CnM/1459-CR 111 Pages Chitranshi Jaiswal Last Updated: October 23, 2026
Amines Market Research Report Information By Type (Ethyleneamines, Alkylamines, Fatty Amines, Specialty Amines, and Ethanolamines), By End-Use Industry (Rubber, Personal Care Products, Cleaning Products, Adhesives, Paints and Resins, Agro-Chemicals, Oil and Petrochemicals, and Other End-Uses), And By Region (North America, Europe, Asia-Pacific, and Rest of the World) – Market Forecast Till 2035.
Amines Market
Market Size
Forecast Period2026-2035
CAGR (2026-2035)5.05%
2025 Market SizeUSD 17.23 Billion
2035 Market SizeUSD 28.20 Billion
Key Players
BASF SE
Dow
Nouryon
Huntsman Corporation
INEOS
Evonik Industries AG
Opportunities
  • Long-Term Carbon Capture Solvent Contracts
  • Bio-Based and Mass-Balance Grades
  • Emerging-Market Capacity Gaps
  1. 1 Market Summary | |
  2. 2 Key Report Takeaways | |
    1. 2.1 By Type | |
    2. 2.2 By End-use Industry | |
    3. 2.3 By Region | |
  3. 3 Market Size and Forecast (2021–2035) | |
  4. 4 Driver Impact Analysis | |
    1. 4.1 Agro-Chemical Formulation Demand | |
    2. 4.2 LNG and Gas-Processing Expansion | |
    3. 4.3 Carbon Capture Solvent Adoption | |
    4. 4.4 Shift to Mild, Plant-Based Surfactants | |
    5. 4.5 Construction Chemicals and Epoxy Curing Agents | |
    6. 4.6 Semiconductor and Pharmaceutical Purity Grades | |
  5. 5 Restraints Impact Analysis | |
    1. 5.1 Feedstock and Energy Price Volatility | |
    2. 5.2 Nitrosamine and Toxicity Regulation | |
    3. 5.3 Ethylene Oxide Emission Rules | |
    4. 5.4 Carbon Border Costs on Ammonia Imports | |
    5. 5.5 Chinese Overcapacity and Price Erosion | |
  6. 6 Opportunities | |
    1. 6.1 Long-Term Carbon Capture Solvent Contracts | |
    2. 6.2 Bio-Based and Mass-Balance Grades | |
    3. 6.3 Emerging-Market Capacity Gaps | |
    4. 6.4 Solvent Management and Data-Driven Service Models | |
    5. 6.5 Replacing 6PPD in Tire Antioxidants | |
  7. 7 Regional Market Share and Country-Level Analysis | |
    1. 7.1 Asia-Pacific | | |
      1. 7.1.1 China | | |
      2. 7.1.2 India | | |
      3. 7.1.3 Japan | | |
      4. 7.1.4 South Korea | | |
      5. 7.1.5 Rest of Asia-Pacific | |
    2. 7.2 North America | | |
      1. 7.2.1 United States | | |
      2. 7.2.2 Canada | | |
      3. 7.2.3 Mexico | |
    3. 7.3 Europe | | |
      1. 7.3.1 Germany | | |
      2. 7.3.2 United Kingdom | | |
      3. 7.3.3 France | | |
      4. 7.3.4 Italy | | |
      5. 7.3.5 Rest of Europe | |
    4. 7.4 South America | | |
      1. 7.4.1 Brazil | | |
      2. 7.4.2 Argentina | | |
      3. 7.4.3 Rest of South America | |
    5. 7.5 Middle East and Africa | | |
      1. 7.5.1 Saudi Arabia | | |
      2. 7.5.2 South Africa | | |
      3. 7.5.3 Rest of Middle East and Africa | |
  8. 8 Future Outlook (2026–2035) | |
    1. 8.1 Decarbonisation and Carbon Capture Scale-Up | |
    2. 8.2 Low-Carbon Feedstock Transition | |
    3. 8.3 Digital and AI-Enabled Operations | |
    4. 8.4 ESG Disclosure and Product Carbon Footprints | |
  9. 9 Segmentation Analysis | |
    1. 9.1 By Type | | |
      1. 9.1.1 Ethyleneamines | | |
      2. 9.1.2 Alkylamines | | |
      3. 9.1.3 Fatty Amines | | |
      4. 9.1.4 Specialty Amines | | |
      5. 9.1.5 Ethanolamines | |
    2. 9.2 By End-use Industry | | |
      1. 9.2.1 Rubber | | |
      2. 9.2.2 Personal Care Products | | |
      3. 9.2.3 Cleaning Products | | |
      4. 9.2.4 Adhesives, Paints and Resins | | |
      5. 9.2.5 Agro-Chemicals | | |
      6. 9.2.6 Oil and Petrochemicals | | |
      7. 9.2.7 Other End-uses | |
  10. 10 Competitive Landscape | |
    1. 10.1 Market Concentration Analysis | |
    2. 10.2 Competitive Benchmarking Matrix | |
    3. 10.3 Company Profiles | | |
      1. 10.3.1 BASF SE | | |
      2. 10.3.2 Dow | | |
      3. 10.3.3 Nouryon | | |
      4. 10.3.4 Huntsman Corporation | | |
      5. 10.3.5 Eastman Chemical Company | | |
      6. 10.3.6 INEOS | | |
      7. 10.3.7 Evonik Industries AG | | |
      8. 10.3.8 Arkema | | |
      9. 10.3.9 Mitsubishi Gas Chemical Company | | |
      10. 10.3.10 Tosoh Corporation | | |
      11. 10.3.11 Balaji Amines Ltd | |
  11. 11 Recent News & Developments | |
  12. 12 Report Scope and Methodology | |
  13. 13 Detailed Sources and Citations | |
  14. 14 Frequently Asked Questions (FAQs) | | LIST OF TABLES | |
  15. TABLE 1 Global Amines Industry Size & Forecast, by Revenue (USD Billion), 2021–2035 | |
  16. TABLE 2 Year-over-Year Growth Analysis, 2021–2035 | |
  17. TABLE 3 Driver Impact Analysis | |
  18. TABLE 4 Restraints Impact Analysis | |
  19. TABLE 5 Regional Summary, by Region, 2025 (USD Billion) | |
  20. TABLE 6 Asia-Pacific Country-Level Analysis, 2025 | |
  21. TABLE 7 North America Country-Level Analysis, 2025 | |
  22. TABLE 8 Europe Country-Level Analysis, 2025 | |
  23. TABLE 9 South America Country-Level Analysis, 2025 | |
  24. TABLE 10 Middle East and Africa Country-Level Analysis, 2025 | |
  25. TABLE 11 Global Amines Industry Size, by Type, 2021–2035 (USD Billion) | |
  26. TABLE 12 Global Amines Industry Size, by End-use Industry, 2021–2035 (USD Billion) | |
  27. TABLE 13 Competitive Benchmarking Matrix, 2025 | |
  28. TABLE 14 Report Scope and Methodology | |
  29. TABLE 15 Detailed Sources and Citations | | LIST OF FIGURES | |
  30. FIGURE 1 Market Dynamics Overview — Drivers, Restraints and Opportunities | |
  31. FIGURE 2 Industry Value Chain Analysis | |
  32. FIGURE 3 Porter's Five Forces Analysis | |
  33. FIGURE 4 Global Amines Industry Size Trend, 2021–2035 (USD Billion) | |
  34. FIGURE 5 Share by Type, 2025 (%) | |
  35. FIGURE 6 Share by End-use Industry, 2025 (%) | |
  36. FIGURE 7 Regional Share, 2025 (%) | |
  37. FIGURE 8 Country Share within Asia-Pacific, 2025 (%) | |
  38. FIGURE 9 Competitive Landscape — Estimated Revenue Share Ranges of Key Players, 2025

Segmentation Quick Reference

DimensionSub-SegmentsDominant SegmentFastest Growing Segment
By TypeEthyleneamines, Alkylamines, Fatty Amines, Specialty Amines, EthanolaminesEthanolamines (45.2% share)Specialty Amines (5.2% CAGR)
By End-use IndustryRubber, Personal Care Products, Cleaning Products, Adhesives, Paints and Resins, Agro-Chemicals, Oil and Petrochemicals, Other End-usesAgro-Chemicals (37.9% share)Cleaning Products (5.7% CAGR)
By RegionNorth America, Europe, Asia-Pacific, South America, Middle East and AfricaAsia-Pacific (46.8% share)Asia-Pacific (5.6% CAGR)

Market Segmentation Overview

By Type

Sub-SegmentKey Trend
EthyleneaminesEpoxy curing demand from coatings and wind-blade composites
AlkylaminesAgrochemical intermediates and water-treatment chemistries
Fatty AminesOleochemical feedstocks for softeners, emulsifiers and adjuvants
Specialty AminesMultipurpose reactors producing electronics and pharmaceutical grades
EthanolaminesGas sweetening, carbon capture solvents and cement grinding aids

Ethanolamines lead this dimension with a 45.2% share because a single product family serves gas treating, surfactants and cement additives. Specialty Amines grow fastest at a 5.2% CAGR, as semiconductor fabs and drug makers pay premiums for parts-per-billion purity and chiral intermediates. Alkylamines and Fatty Amines hold steady positions tied to crop protection and oleochemical supply.

By End-use Industry

Sub-SegmentKey Trend
RubberSearch for 6PPD antioxidant alternatives
Personal Care ProductsSulfate-free conditioning and mild surfactant systems
Cleaning ProductsPlant-based, readily biodegradable formulations
Adhesives, Paints and ResinsEthyleneamine curing agents for protective coatings
Agro-ChemicalsHerbicide salts, drift-reduction adjuvants and fertilizer scrubbing
Oil and PetrochemicalsLNG acid-gas treating and refinery corrosion control
Other End-usesWater treatment, pharmaceuticals and textiles

Agro-Chemicals dominate with a 37.9% share, since amine salts make leading herbicides water-soluble and adjuvants improve spray performance. Cleaning Products grow fastest at a 5.7% CAGR as ecolabel criteria and consumer preference push formulators toward plant-derived amine oxides and betaines. Personal Care Products follow a similar reformulation path, while Rubber demand hinges on qualifying safer antioxidants.


Download PDF ×

We do not share your information with anyone. However, we may send you emails based on your report interest from time to time. You may contact us at any time to opt-out.