info@marketresearchfuture.com   📞 +1 (855) 661-4441(US)   📞 +44 1720 412 167(UK)   📞 +91 2269738890(APAC)
Certified Global Research Member
Isomar 1 Iso 1
Key Questions Answered
  • Global Market Outlook
  • In-depth analysis of global and regional trends
  • Analyze and identify the major players in the market, their market share, key developments, etc.
  • To understand the capability of the major players based on products offered, financials, and strategies.
  • Identify disrupting products, companies, and trends.
  • To identify opportunities in the market.
  • Analyze the key challenges in the market.
  • Analyze the regional penetration of players, products, and services in the market.
  • Comparison of major players financial performance.
  • Evaluate strategies adopted by major players.
  • Recommendations
Why Choose Market Research Future?
  • Vigorous research methodologies for specific market.
  • Knowledge partners across the globe
  • Large network of partner consultants.
  • Ever-increasing/ Escalating data base with quarterly monitoring of various markets
  • Trusted by fortune 500 companies/startups/ universities/organizations
  • Large database of 5000+ markets reports.
  • Effective and prompt pre- and post-sales support.

Aluminum Ingots Market Research Report: By Grade (Primary Aluminum, Secondary Aluminum, Alloy Ingots), By End-Use Industry (Transportation, Construction, Electrical, Packaging, Industrial Machinery), By Application (Automotive Parts, Aircraft Components, Building Structures, Electrical Conductors, Machinery Components), By Purity Level (99.0%, 99.5%, 99.7%, 99.9%) and By Regional (North America, Europe, South America, Asia Pacific, Middle East and Africa) - Forecast to 2034


ID: MRFR/CnM/21529-HCR | 111 Pages | Author: Chitranshi Jaiswal| July 2025

Global Aluminum Ingots Market Overview

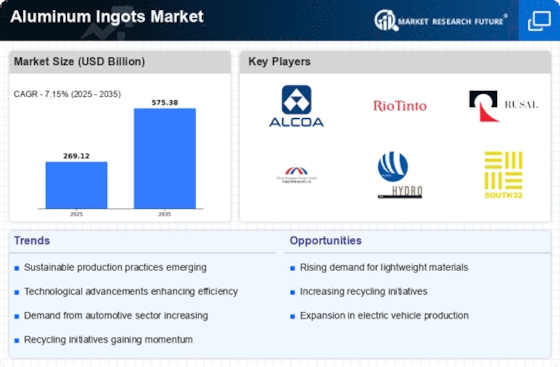
The Aluminum Ingots Market Size was estimated at 269.12 (USD Billion) in 2024. The Aluminum Ingots Market Industry is expected to grow from 288.37 (USD Billion) in 2025 to 536.97 (USD Billion) by 2034. The Aluminum Ingots Market CAGR (growth rate) is expected to be around 7.15% during the forecast period (2025 - 2034).

Key Aluminum Ingots Market Trends Highlighted

Aluminum Ingots Market Overview

Source: Primary Research, Secondary Research, MRFR Database and Analyst Review

Aluminum Ingots Market Drivers

Rising Demand from Automotive Sector

The automotive industry is one of the major users of aluminum ingots since they offer lightweight and strong vehicle parts. For example, both engine blocks and body panels are key parts of the construction of that or another car. Also, other parts and important details, including vehicles’ wheels, exhausts, and many others, are made of Aluminum. Moreover, the increasing adoption of lightweight metal in the automobile industry is explained by the latter’s desire to protect the environment and reduce the consumption of fuel.These factors have resulted in the great popularity of electric automobiles and their producers in the  market. It is worth noting that manufacturers of such vehicles are the industry’s second most important drives today, and this is not surprising since this automobile type’s key distinction is its lightweight, which is ensured by making vehicle parts of Aluminum.

Growing Use in Construction and Infrastructure

Construction and infrastructure sectors are the major areas where aluminum ingots are heavily used in roofing, siding, windows, and structure construction. It propels the growth of the market as the demand for durable and sustainable building materials expands. In addition, the rapidly increasing investments in infrastructure development, primarily in emerging countries, present considerable opportunities for companies dealing with aluminum ingots.

Expansion of Aerospace Industry

The aerospace segment is one of the main consumers of aluminum ingots, as they are used for producing fuselages, wings, landing gears, and other components of aircraft. A great number of people travel by air, so the demand for new aircraft, as well as for increasing the number of air companies, grows. At the same time, manufacturers seek to develop new models that would be more convenient for passengers and meet the requirements for reducing fuel consumption.Therefore, the demand for ingots in the aerospace market is expected to grow.

Aluminum Ingots Market Segment Insights

Aluminum Ingots Market Grade Insights

Based on Grade, the  Aluminum Ingots Market is segmented into Primary Aluminum and Alloy Ingots. The primary Aluminum segment is projected to hold the largest market share in 2023 and is likely to continue the same in the forecast period. The primary Aluminum segment is further split into 566,744,459,537,550,593,117,821,596, and the demand for primary Aluminum is attributed to their production process. Primary Aluminum is produced from bauxite ore and is the purest form of Aluminum. This type of Aluminum is also the most commonly used Grade and is found to be extensively used across transportation, construction, and electrical engineering.The secondary Aluminum segment is projected to register significant growth in the forecast period, owing to the rising demand for recycled Aluminum. Secondary Aluminum is produced out of recycled Aluminum scrap and is far more inexpensive than Primary Aluminum. Secondary Aluminum is expected to register a substantial growth rate over the period, owing to the relatively low cost of production, and it is likely to be used in the production of aluminum ingots. By type, the market is segmented into Aluminum Fuming Ingot, Aluminum Torch, Aluminum Fish Ingots, A356.2, LMF156, and IRFA – 401.3677,499.5418.Aluminum ingots are aluminum ingots infused with a mixture of other metals, such as copper, manganese, and silicon, and are produced in ingot form. The alloy ingots are found to be extensively used in aerospace, automotive, and construction. The growth of the market is attributed to the rising demand for Aluminum Ingots from several industries.Aluminum Ingots Market Segment

Source: Primary Research, Secondary Research, MRFR Database and Analyst Review

Aluminum Ingots Market End-Use Industry Insights

The information on the market wireframe is given in the table in the form of  aluminum ingots market segmentation by End-Use Industry. The information is valuable in providing information on the various uses of aluminum ingots in various industries. From the information, it can be deduced that the transportation segment uses the largest share of the market. This is attributed to the increasing demand for lightweight and fuel-efficient vehicles. In the last segment, aluminum ingot is used in the production of various automotive products, such as body panels, wheels, and engine parts.The construction segment also contributes to the growth of the market since aluminum ingots are commonly used in the production of roofing, siding, and window frames because they are durable and resistant to corrosion. In the electrical section, aluminum ingot is used to make conductors, transformers, and other electrical appliances because of Aluminum’s great electrical conductivity. The packaging segment uses aluminum ingot to make cans for food and beverages, foil, wraps, and packaging since they are relatively inert. Finally, the Industrial Machinery’ segment uses aluminum ingots in different machinery parts such as gears, bearings, and housings because of Aluminum’s strength-to-weight ratio and ease of machinability.

Aluminum Ingots Market Application Insights

The Aluminum Ingots Market segmentation by application comprises Automotive Parts, Aircraft Components, Building Structures, Electrical Conductors, Machinery Components, and others. The Automotive Parts segment is expected to lead the  Aluminum Ingots Market with a significant market share in 2024, driven by the increasing demand for lightweight and fuel-efficient vehicles. The growing aviation industry is projected to drive the demand for Aircraft Components, leading to a substantial market valuation in 2024. Building Structures is another key application segment, with the rising construction activities ly contributing to its growth.Electrical Conductors utilized in power transmission and distribution networks are expected to witness steady demand in the coming years. Machinery Components employed in various industrial machinery and equipment are anticipated to contribute to the overall market growth.

Aluminum Ingots Market Purity Level Insights

The purity level segment plays a crucial role in determining the  Aluminum Ingots Market revenue. In 2023, the 99.0% purity level segment held the largest market share, accounting for over 40% of the  Aluminum Ingots Market segmentation revenue. This dominance is attributed to its wide application in the construction industry, particularly in structural components, roofing, and siding. Moreover, the rising demand for high-purity Aluminum in the automotive and aerospace industries is further driving the growth of this segment. The 99.5% purity level segment is also witnessing significant growth, capturing a market share of around 30% in 2023.This growth is primarily driven by increasing demand from the electrical and electronics industries, where high-purity Aluminum is used in conductors, capacitors, and heat sinks. The 99.7% and 99.9% purity level segments are expected to exhibit steady growth in the coming years, owing to their increasing use in specialized applications such as aerospace, defense, and medical devices. These high-purity grades offer superior strength, corrosion resistance, and electrical conductivity, making them indispensable for demanding applications. Overall, the purity level segment is expected to continue to drive the growth of the  Aluminum Ingots Market statistics industry, with each segment catering to specific end-use industries and applications.

Aluminum Ingots Market Regional Insights

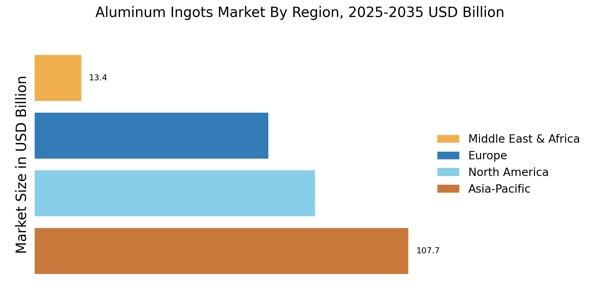
The  Aluminum Ingots Market is segmented regionally into North America, Europe, APAC, South America, and MEA. The APAC region dominated the market in 2023, accounting for over 40% of the  revenue. The region is expected to continue to lead the market over the forecast period, driven by the growing demand from the automotive and construction industries. North America and Europe are also significant markets for aluminum ingots, with a combined share of over 35% in 2023. The market in these regions is expected to grow steadily over the forecast period, supported by the increasing demand from the aerospace and defense industries.South America and MEA are expected to witness moderate growth over the forecast period, driven by the growing demand from the packaging and consumer goods industries.Aluminum Ingots Market Regional

Source: Primary Research, Secondary Research, MRFR Database and Analyst Review

Aluminum Ingots Market Key Players And Competitive Insights

Aluminum Ingots Market's major players continuously focus on developing new products to meet the increasing demand for aluminum ingots. The companies are also investing in research and development to improve the efficiency of their production processes. The aluminum ingots market industry is highly competitive, whereby leading aluminum ingots market players such as Rio Tinto, Alcoa, and Rusal have a higher market share in the  market. These companies exist in the aluminum ingots market and have a well-established presence. The leading Aluminum Ingots Market players have a proven track record of developing innovative aluminum ingots to meet the specific needs of the different customers in the market. Aluminum Ingots Market growth is driven by the increasing demand for aluminum products in the construction, aerospace, and automotive industries. Aluminum is a lightweight, strong, and corrosion-resistant metal that is used in a wide range of applications. The development of Aluminum Ingots Market Competitive Landscape is expected to remain competitive in the years to come, with new entrants expected to be part of the market.Norsk Hydro ASA is a Norwegian company that is one of the leading producers of aluminum ingots in the market. The company has a  presence, and it operates in more than 50 countries across the globe. Norsk Hydro ASA aims to become a carbon-neutral company by 2030, and the company has established a path to reach that goal. At the same time, the company is also investing in new technologies to enhance the efficiency of its production process, thus increasing its market presence.China Hongqiao Group Limited is also a major company in the Aluminum Ingots Market. It is one of the largest aluminum producers in China and the world. The company has a diverse product range in the aluminum industry, including aluminum ingots, aluminum billets, and aluminum extrusions. The company is focused on increasing its presence in the domestic market while also expanding into other countries.

Key Companies in the Aluminum Ingots Market Include

    • Alcoa
    • Norsk Hydro
    • Constellium
    • Rusal
    • China Hongqiao Group
    • China Zhongwang
    • Century Aluminum
    • South32
    • Vedanta Resources
    • Novelis
    • Hydro Extrusion
    • United Company RUSAL
    • SAPA
    • Emirates Aluminium

Aluminum Ingots Market Industry Developments

In July 2022, Alcoa Corporation announced that it would soon start the project construction aimed at expanding the casting capabilities of its Deschambault smelter in Canada to incorporate standard ingots. The subsequent development of the new casting for the Deschambault smelter was located in one of the buildings, and the entire project was forecast to be completed by the end of the first quarter of 2023. In August 2022, Rio Tinto indicated that it would invest 29 million US dollars to adjust the existing infrastructure facilities and methods so as to accommodate the establishment of a new aluminum recycling plant at its Arvida Plant based in Saguenay-Lac-Saint-Jean, Quebec. It aims to enhance its market availability of low-carbon aluminum supply to the construction, packaging and automotive sectors. In July 2023, Alcoa commenced the process of adding the casting capabilities for standard ingots at its Deschambault smelter in Canada. Should everything go according to the estimation, it is anticipated that the project will be fully functional during the first month of 2024. In August 2023, the announcement was made Rio Tinto said it will put 29 million towards the construction of new aluminum recycling methods at the Arvida Plant in Quebec, which targets the provision of low-source aluminum in various industries. In October, a document issued by RUSAL indicated that there is an intention to boost their green aluminum ingot production on the basis of the company’s facilities situated in Siberia while utilizing green energy sources, which is in line with global standards. In May 2024, Norsk Hydro introduced its new range of aluminum ingots, Hydro CIRCAL, claiming high levels of recycled materials to targeted green markets. In March 2024 Chalco finished the expansion of the production of ingots in Henan Province with an aim to better serve the needs of the automotive and construction industry. In February 2024, Vedanta opted for a planned move of shifting its focus on manufacturing and shipping low-carbon aluminum alloy ingots to Europe because its Indian exports can support renewable energy integration. EGA (Emirates Global Aluminium): In June 2024, EGA signed an agreement with an American automotive manufacturer to provide high-strength automotive-grade aluminum alloy ingots for use in electric cars, thereby increasing its portfolio in the EV market. In September 2024, Constellium announced R&D expenditures aimed at the implementation of an advanced design smelting process at its French plant to produce aluminum alloy ingots in a composition of reduced weight for the aircraft aerospace industry.

Aluminum Ingots Market Segmentation Insights

Aluminum Ingots Market Grade Outlook

    • Primary Aluminum
    • Secondary Aluminum
    • Alloy Ingots

Aluminum Ingots Market End-Use Industry Outlook

    • Transportation
    • Construction
    • Electrical
    • Packaging
    • Industrial Machinery

Aluminum Ingots Market Application Outlook

    • Automotive Parts
    • Aircraft Components
    • Building Structures
    • Electrical Conductors
    • Machinery Components

Aluminum Ingots Market Purity Level Outlook

    • 0%
    • 5%
    • 7%
    • 9%

Aluminum Ingots Market Regional Outlook

    • North America
    • Europe
    • South America
    • Asia Pacific
    • Middle East and Africa
Report Attribute/Metric Details
Market Size 2024 269.12 (USD Billion)
Market Size 2025 288.37 (USD Billion)
Market Size 2034 536.97 (USD Billion)
Compound Annual Growth Rate (CAGR) 7.15% (2025 - 2034)
Report Coverage Revenue Forecast, Competitive Landscape, Growth Factors, and Trends
Base Year 2024
Market Forecast Period 2025 - 2034
Historical Data 2020 - 2024
Market Forecast Units USD Billion
Key Companies Profiled Alcoa, Norsk Hydro, Constellium, Rio Tinto, Rusal, China Hongqiao Group, China Zhongwang, Century Aluminum, South32, Vedanta Resources, Novelis, Hydro Extrusion, United Company RUSAL, SAPA, Emirates  Aluminium
Segments Covered Grade, End-Use Industry, Application, Purity Level, Regional
Key Market Opportunities Increased demand for Aluminum in the transportation sector Growing use of Aluminum in the construction industry Rising demand from consumer electronics sector Expanding applications in the packaging industry Government initiatives promoting aluminum recycling
Key Market Dynamics Increasing demand from the aerospace industry Rising consumption in the construction sector Technological advancements in production processes Growing automotive industry Environmental regulations driving demand
Countries Covered North America, Europe, APAC, South America, MEA


Frequently Asked Questions (FAQ) :

The aluminum ingots market was valued at 288.37 USD billion in 2025, and it is projected to reach 536.97 USD billion by 2034, exhibiting a CAGR of 7.15% during the forecast period.

Asia-Pacific is expected to dominate the aluminum ingots market throughout the forecast period. The region's dominance can be attributed to the increasing demand for Aluminum in various industries, including construction, transportation, and packaging.

The key growth drivers of the aluminum ingots market include rising demand from the construction, transportation, and packaging industries, increasing urbanization, and growing disposable incomes.

Some of the key competitors in the aluminum ingots market include Alcoa, Norsk Hydro, Constellium, Rio Tinto, Rusal, China Hongqiao Group, China Zhongwang, Century Aluminum, South32, Vedanta Resources, Novelis, Hydro Extrusion, United Company RUSAL, SAPA, Emirates Aluminium.

Aluminum ingots are primarily used in the production of rolled products, such as sheets, plates, and foils. These rolled products find applications in various industries, including construction, transportation, packaging, and consumer durables.

The outlook for the aluminum ingots market is positive. The market is expected to witness steady growth over the forecast period, driven by increasing demand from various end-use industries.

The aluminum ingot market faces challenges such as volatile raw material prices, geopolitical uncertainties, and stringent environmental regulations.

Key trends in the aluminum ingots market include the growing adoption of sustainable practices, increasing demand for lightweight materials, and technological advancements in production processes.

The COVID-19 pandemic had a negative impact on the aluminum ingots market in the short term due to disruptions in supply chains and reduced demand from end-use industries. However, the market is expected to recover and continue to grow in the long term.

Opportunities for growth in the aluminum ingots market include expanding into emerging markets, developing new alloys and applications, and investing in research and development.

Comments

Aluminum Ingots Market Segmentation


  • Aluminum Ingots Market By Grade (USD Billion, 2019-2032)


    • Primary Aluminum

    • Secondary Aluminum

    • Alloy Ingots


  • Aluminum Ingots Market By End-Use Industry (USD Billion, 2019-2032)


    • Transportation

    • Construction

    • Electrical

    • Packaging

    • Industrial Machinery


  • Aluminum Ingots Market By Application (USD Billion, 2019-2032)


    • Automotive Parts

    • Aircraft Components

    • Building Structures

    • Electrical Conductors

    • Machinery Components


  • Aluminum Ingots Market By Purity Level (USD Billion, 2019-2032)


    • 99.0%

    • 99.5%

    • 99.7%

    • 99.9%


  • Aluminum Ingots Market By Regional (USD Billion, 2019-2032)


    • North America

    • Europe

    • South America

    • Asia Pacific

    • Middle East and Africa


Aluminum Ingots Market Regional Outlook (USD Billion, 2019-2032)


  • North America Aluminum Ingots Market Outlook (USD Billion, 2019-2032)


    • North America Market by Grade Type


      • Primary Aluminum

      • Secondary Aluminum

      • Alloy Ingots


    • North America Market by End-Use Industry Type


      • Transportation

      • Construction

      • Electrical

      • Packaging

      • Industrial Machinery


    • North America Market by Application Type


      • Automotive Parts

      • Aircraft Components

      • Building Structures

      • Electrical Conductors

      • Machinery Components


    • North America Market by Purity Level Type


      • 99.0%

      • 99.5%

      • 99.7%

      • 99.9%


    • North America Market by Regional Type


      • US

      • Canada


    • US Aluminum Ingots Market Outlook (USD Billion, 2019-2032)

    • US Market by Grade Type


      • Primary Aluminum

      • Secondary Aluminum

      • Alloy Ingots


    • US Market by End-Use Industry Type


      • Transportation

      • Construction

      • Electrical

      • Packaging

      • Industrial Machinery


    • US Market by Application Type


      • Automotive Parts

      • Aircraft Components

      • Building Structures

      • Electrical Conductors

      • Machinery Components


    • US Market by Purity Level Type


      • 99.0%

      • 99.5%

      • 99.7%

      • 99.9%


    • CANADA Aluminum Ingots Market Outlook (USD Billion, 2019-2032)

    • CANADA Market by Grade Type


      • Primary Aluminum

      • Secondary Aluminum

      • Alloy Ingots


    • CANADA Market by End-Use Industry Type


      • Transportation

      • Construction

      • Electrical

      • Packaging

      • Industrial Machinery


    • CANADA Market by Application Type


      • Automotive Parts

      • Aircraft Components

      • Building Structures

      • Electrical Conductors

      • Machinery Components


    • CANADA Market by Purity Level Type


      • 99.0%

      • 99.5%

      • 99.7%

      • 99.9%


  • Europe Aluminum Ingots Market Outlook (USD Billion, 2019-2032)


    • Europe Market by Grade Type


      • Primary Aluminum

      • Secondary Aluminum

      • Alloy Ingots


    • Europe Market by End-Use Industry Type


      • Transportation

      • Construction

      • Electrical

      • Packaging

      • Industrial Machinery


    • Europe Market by Application Type


      • Automotive Parts

      • Aircraft Components

      • Building Structures

      • Electrical Conductors

      • Machinery Components


    • Europe Market by Purity Level Type


      • 99.0%

      • 99.5%

      • 99.7%

      • 99.9%


    • Europe Market by Regional Type


      • Germany

      • UK

      • France

      • Russia

      • Italy

      • Spain

      • Rest of Europe


    • GERMANY Aluminum Ingots Market Outlook (USD Billion, 2019-2032)

    • GERMANY Market by Grade Type


      • Primary Aluminum

      • Secondary Aluminum

      • Alloy Ingots


    • GERMANY Market by End-Use Industry Type


      • Transportation

      • Construction

      • Electrical

      • Packaging

      • Industrial Machinery


    • GERMANY Market by Application Type


      • Automotive Parts

      • Aircraft Components

      • Building Structures

      • Electrical Conductors

      • Machinery Components


    • GERMANY Market by Purity Level Type


      • 99.0%

      • 99.5%

      • 99.7%

      • 99.9%


    • UK Aluminum Ingots Market Outlook (USD Billion, 2019-2032)

    • UK Market by Grade Type


      • Primary Aluminum

      • Secondary Aluminum

      • Alloy Ingots


    • UK Market by End-Use Industry Type


      • Transportation

      • Construction

      • Electrical

      • Packaging

      • Industrial Machinery


    • UK Market by Application Type


      • Automotive Parts

      • Aircraft Components

      • Building Structures

      • Electrical Conductors

      • Machinery Components


    • UK Market by Purity Level Type


      • 99.0%

      • 99.5%

      • 99.7%

      • 99.9%


    • FRANCE Aluminum Ingots Market Outlook (USD Billion, 2019-2032)

    • FRANCE Market by Grade Type


      • Primary Aluminum

      • Secondary Aluminum

      • Alloy Ingots


    • FRANCE Market by End-Use Industry Type


      • Transportation

      • Construction

      • Electrical

      • Packaging

      • Industrial Machinery


    • FRANCE Market by Application Type


      • Automotive Parts

      • Aircraft Components

      • Building Structures

      • Electrical Conductors

      • Machinery Components


    • FRANCE Market by Purity Level Type


      • 99.0%

      • 99.5%

      • 99.7%

      • 99.9%


    • RUSSIA Aluminum Ingots Market Outlook (USD Billion, 2019-2032)

    • RUSSIA Market by Grade Type


      • Primary Aluminum

      • Secondary Aluminum

      • Alloy Ingots


    • RUSSIA Market by End-Use Industry Type


      • Transportation

      • Construction

      • Electrical

      • Packaging

      • Industrial Machinery


    • RUSSIA Market by Application Type


      • Automotive Parts

      • Aircraft Components

      • Building Structures

      • Electrical Conductors

      • Machinery Components


    • RUSSIA Market by Purity Level Type


      • 99.0%

      • 99.5%

      • 99.7%

      • 99.9%


    • ITALY Aluminum Ingots Market Outlook (USD Billion, 2019-2032)

    • ITALY Market by Grade Type


      • Primary Aluminum

      • Secondary Aluminum

      • Alloy Ingots


    • ITALY Market by End-Use Industry Type


      • Transportation

      • Construction

      • Electrical

      • Packaging

      • Industrial Machinery


    • ITALY Market by Application Type


      • Automotive Parts

      • Aircraft Components

      • Building Structures

      • Electrical Conductors

      • Machinery Components


    • ITALY Market by Purity Level Type


      • 99.0%

      • 99.5%

      • 99.7%

      • 99.9%


    • SPAIN Aluminum Ingots Market Outlook (USD Billion, 2019-2032)

    • SPAIN Market by Grade Type


      • Primary Aluminum

      • Secondary Aluminum

      • Alloy Ingots


    • SPAIN Market by End-Use Industry Type


      • Transportation

      • Construction

      • Electrical

      • Packaging

      • Industrial Machinery


    • SPAIN Market by Application Type


      • Automotive Parts

      • Aircraft Components

      • Building Structures

      • Electrical Conductors

      • Machinery Components


    • SPAIN Market by Purity Level Type


      • 99.0%

      • 99.5%

      • 99.7%

      • 99.9%


    • REST OF EUROPE Aluminum Ingots Market Outlook (USD Billion, 2019-2032)

    • REST OF EUROPE Market by Grade Type


      • Primary Aluminum

      • Secondary Aluminum

      • Alloy Ingots


    • REST OF EUROPE Market by End-Use Industry Type


      • Transportation

      • Construction

      • Electrical

      • Packaging

      • Industrial Machinery


    • REST OF EUROPE Market by Application Type


      • Automotive Parts

      • Aircraft Components

      • Building Structures

      • Electrical Conductors

      • Machinery Components


    • REST OF EUROPE Market by Purity Level Type


      • 99.0%

      • 99.5%

      • 99.7%

      • 99.9%


  • APAC Aluminum Ingots Market Outlook (USD Billion, 2019-2032)


    • APAC Market by Grade Type


      • Primary Aluminum

      • Secondary Aluminum

      • Alloy Ingots


    • APAC Market by End-Use Industry Type


      • Transportation

      • Construction

      • Electrical

      • Packaging

      • Industrial Machinery


    • APAC Market by Application Type


      • Automotive Parts

      • Aircraft Components

      • Building Structures

      • Electrical Conductors

      • Machinery Components


    • APAC Market by Purity Level Type


      • 99.0%

      • 99.5%

      • 99.7%

      • 99.9%


    • APAC Market by Regional Type


      • China

      • India

      • Japan

      • South Korea

      • Malaysia

      • Thailand

      • Indonesia

      • Rest of APAC


    • CHINA Aluminum Ingots Market Outlook (USD Billion, 2019-2032)

    • CHINA Market by Grade Type


      • Primary Aluminum

      • Secondary Aluminum

      • Alloy Ingots


    • CHINA Market by End-Use Industry Type


      • Transportation

      • Construction

      • Electrical

      • Packaging

      • Industrial Machinery


    • CHINA Market by Application Type


      • Automotive Parts

      • Aircraft Components

      • Building Structures

      • Electrical Conductors

      • Machinery Components


    • CHINA Market by Purity Level Type


      • 99.0%

      • 99.5%

      • 99.7%

      • 99.9%


    • INDIA Aluminum Ingots Market Outlook (USD Billion, 2019-2032)

    • INDIA Market by Grade Type


      • Primary Aluminum

      • Secondary Aluminum

      • Alloy Ingots


    • INDIA Market by End-Use Industry Type


      • Transportation

      • Construction

      • Electrical

      • Packaging

      • Industrial Machinery


    • INDIA Market by Application Type


      • Automotive Parts

      • Aircraft Components

      • Building Structures

      • Electrical Conductors

      • Machinery Components


    • INDIA Market by Purity Level Type


      • 99.0%

      • 99.5%

      • 99.7%

      • 99.9%


    • JAPAN Aluminum Ingots Market Outlook (USD Billion, 2019-2032)

    • JAPAN Market by Grade Type


      • Primary Aluminum

      • Secondary Aluminum

      • Alloy Ingots


    • JAPAN Market by End-Use Industry Type


      • Transportation

      • Construction

      • Electrical

      • Packaging

      • Industrial Machinery


    • JAPAN Market by Application Type


      • Automotive Parts

      • Aircraft Components

      • Building Structures

      • Electrical Conductors

      • Machinery Components


    • JAPAN Market by Purity Level Type


      • 99.0%

      • 99.5%

      • 99.7%

      • 99.9%


    • SOUTH KOREA Aluminum Ingots Market Outlook (USD Billion, 2019-2032)

    • SOUTH KOREA Market by Grade Type


      • Primary Aluminum

      • Secondary Aluminum

      • Alloy Ingots


    • SOUTH KOREA Market by End-Use Industry Type


      • Transportation

      • Construction

      • Electrical

      • Packaging

      • Industrial Machinery


    • SOUTH KOREA Market by Application Type


      • Automotive Parts

      • Aircraft Components

      • Building Structures

      • Electrical Conductors

      • Machinery Components


    • SOUTH KOREA Market by Purity Level Type


      • 99.0%

      • 99.5%

      • 99.7%

      • 99.9%


    • MALAYSIA Aluminum Ingots Market Outlook (USD Billion, 2019-2032)

    • MALAYSIA Market by Grade Type


      • Primary Aluminum

      • Secondary Aluminum

      • Alloy Ingots


    • MALAYSIA Market by End-Use Industry Type


      • Transportation

      • Construction

      • Electrical

      • Packaging

      • Industrial Machinery


    • MALAYSIA Market by Application Type


      • Automotive Parts

      • Aircraft Components

      • Building Structures

      • Electrical Conductors

      • Machinery Components


    • MALAYSIA Market by Purity Level Type


      • 99.0%

      • 99.5%

      • 99.7%

      • 99.9%


    • THAILAND Aluminum Ingots Market Outlook (USD Billion, 2019-2032)

    • THAILAND Market by Grade Type


      • Primary Aluminum

      • Secondary Aluminum

      • Alloy Ingots


    • THAILAND Market by End-Use Industry Type


      • Transportation

      • Construction

      • Electrical

      • Packaging

      • Industrial Machinery


    • THAILAND Market by Application Type


      • Automotive Parts

      • Aircraft Components

      • Building Structures

      • Electrical Conductors

      • Machinery Components


    • THAILAND Market by Purity Level Type


      • 99.0%

      • 99.5%

      • 99.7%

      • 99.9%


    • INDONESIA Aluminum Ingots Market Outlook (USD Billion, 2019-2032)

    • INDONESIA Market by Grade Type


      • Primary Aluminum

      • Secondary Aluminum

      • Alloy Ingots


    • INDONESIA Market by End-Use Industry Type


      • Transportation

      • Construction

      • Electrical

      • Packaging

      • Industrial Machinery


    • INDONESIA Market by Application Type


      • Automotive Parts

      • Aircraft Components

      • Building Structures

      • Electrical Conductors

      • Machinery Components


    • INDONESIA Market by Purity Level Type


      • 99.0%

      • 99.5%

      • 99.7%

      • 99.9%


    • REST OF APAC Aluminum Ingots Market Outlook (USD Billion, 2019-2032)

    • REST OF APAC Market by Grade Type


      • Primary Aluminum

      • Secondary Aluminum

      • Alloy Ingots


    • REST OF APAC Market by End-Use Industry Type


      • Transportation

      • Construction

      • Electrical

      • Packaging

      • Industrial Machinery


    • REST OF APAC Market by Application Type


      • Automotive Parts

      • Aircraft Components

      • Building Structures

      • Electrical Conductors

      • Machinery Components


    • REST OF APAC Market by Purity Level Type


      • 99.0%

      • 99.5%

      • 99.7%

      • 99.9%


  • South America Aluminum Ingots Market Outlook (USD Billion, 2019-2032)


    • South America Market by Grade Type


      • Primary Aluminum

      • Secondary Aluminum

      • Alloy Ingots


    • South America Market by End-Use Industry Type


      • Transportation

      • Construction

      • Electrical

      • Packaging

      • Industrial Machinery


    • South America Market by Application Type


      • Automotive Parts

      • Aircraft Components

      • Building Structures

      • Electrical Conductors

      • Machinery Components


    • South America Market by Purity Level Type


      • 99.0%

      • 99.5%

      • 99.7%

      • 99.9%


    • South America Market by Regional Type


      • Brazil

      • Mexico

      • Argentina

      • Rest of South America


    • BRAZIL Aluminum Ingots Market Outlook (USD Billion, 2019-2032)

    • BRAZIL Market by Grade Type


      • Primary Aluminum

      • Secondary Aluminum

      • Alloy Ingots


    • BRAZIL Market by End-Use Industry Type


      • Transportation

      • Construction

      • Electrical

      • Packaging

      • Industrial Machinery


    • BRAZIL Market by Application Type


      • Automotive Parts

      • Aircraft Components

      • Building Structures

      • Electrical Conductors

      • Machinery Components


    • BRAZIL Market by Purity Level Type


      • 99.0%

      • 99.5%

      • 99.7%

      • 99.9%


    • MEXICO Aluminum Ingots Market Outlook (USD Billion, 2019-2032)

    • MEXICO Market by Grade Type


      • Primary Aluminum

      • Secondary Aluminum

      • Alloy Ingots


    • MEXICO Market by End-Use Industry Type


      • Transportation

      • Construction

      • Electrical

      • Packaging

      • Industrial Machinery


    • MEXICO Market by Application Type


      • Automotive Parts

      • Aircraft Components

      • Building Structures

      • Electrical Conductors

      • Machinery Components


    • MEXICO Market by Purity Level Type


      • 99.0%

      • 99.5%

      • 99.7%

      • 99.9%


    • ARGENTINA Aluminum Ingots Market Outlook (USD Billion, 2019-2032)

    • ARGENTINA Market by Grade Type


      • Primary Aluminum

      • Secondary Aluminum

      • Alloy Ingots


    • ARGENTINA Market by End-Use Industry Type


      • Transportation

      • Construction

      • Electrical

      • Packaging

      • Industrial Machinery


    • ARGENTINA Market by Application Type


      • Automotive Parts

      • Aircraft Components

      • Building Structures

      • Electrical Conductors

      • Machinery Components


    • ARGENTINA Market by Purity Level Type


      • 99.0%

      • 99.5%

      • 99.7%

      • 99.9%


    • REST OF SOUTH AMERICA Aluminum Ingots Market Outlook (USD Billion, 2019-2032)

    • REST OF SOUTH AMERICA Market by Grade Type


      • Primary Aluminum

      • Secondary Aluminum

      • Alloy Ingots


    • REST OF SOUTH AMERICA Market by End-Use Industry Type


      • Transportation

      • Construction

      • Electrical

      • Packaging

      • Industrial Machinery


    • REST OF SOUTH AMERICA Market by Application Type


      • Automotive Parts

      • Aircraft Components

      • Building Structures

      • Electrical Conductors

      • Machinery Components


    • REST OF SOUTH AMERICA Market by Purity Level Type


      • 99.0%

      • 99.5%

      • 99.7%

      • 99.9%


  • MEA Aluminum Ingots Market Outlook (USD Billion, 2019-2032)


    • MEA Market by Grade Type


      • Primary Aluminum

      • Secondary Aluminum

      • Alloy Ingots


    • MEA Market by End-Use Industry Type


      • Transportation

      • Construction

      • Electrical

      • Packaging

      • Industrial Machinery


    • MEA Market by Application Type


      • Automotive Parts

      • Aircraft Components

      • Building Structures

      • Electrical Conductors

      • Machinery Components


    • MEA Market by Purity Level Type


      • 99.0%

      • 99.5%

      • 99.7%

      • 99.9%


    • MEA Market by Regional Type


      • GCC Countries

      • South Africa

      • Rest of MEA


    • GCC COUNTRIES Aluminum Ingots Market Outlook (USD Billion, 2019-2032)

    • GCC COUNTRIES Market by Grade Type


      • Primary Aluminum

      • Secondary Aluminum

      • Alloy Ingots


    • GCC COUNTRIES Market by End-Use Industry Type


      • Transportation

      • Construction

      • Electrical

      • Packaging

      • Industrial Machinery


    • GCC COUNTRIES Market by Application Type


      • Automotive Parts

      • Aircraft Components

      • Building Structures

      • Electrical Conductors

      • Machinery Components


    • GCC COUNTRIES Market by Purity Level Type


      • 99.0%

      • 99.5%

      • 99.7%

      • 99.9%


    • SOUTH AFRICA Aluminum Ingots Market Outlook (USD Billion, 2019-2032)

    • SOUTH AFRICA Market by Grade Type


      • Primary Aluminum

      • Secondary Aluminum

      • Alloy Ingots


    • SOUTH AFRICA Market by End-Use Industry Type


      • Transportation

      • Construction

      • Electrical

      • Packaging

      • Industrial Machinery


    • SOUTH AFRICA Market by Application Type


      • Automotive Parts

      • Aircraft Components

      • Building Structures

      • Electrical Conductors

      • Machinery Components


    • SOUTH AFRICA Market by Purity Level Type


      • 99.0%

      • 99.5%

      • 99.7%

      • 99.9%


    • REST OF MEA Aluminum Ingots Market Outlook (USD Billion, 2019-2032)

    • REST OF MEA Market by Grade Type


      • Primary Aluminum

      • Secondary Aluminum

      • Alloy Ingots


    • REST OF MEA Market by End-Use Industry Type


      • Transportation

      • Construction

      • Electrical

      • Packaging

      • Industrial Machinery


    • REST OF MEA Market by Application Type


      • Automotive Parts

      • Aircraft Components

      • Building Structures

      • Electrical Conductors

      • Machinery Components


    • REST OF MEA Market by Purity Level Type


      • 99.0%

      • 99.5%

      • 99.7%

      • 99.9%


TABLE OF CONTENTS

1. EXECUTIVE SUMMARY

1.1. Market Overview

1.2. Key Findings

1.3. Market Segmentation

1.4. Competitive Landscape

1.5. Challenges and Opportunities

1.6. Future Outlook

2. MARKET INTRODUCTION

2.1. Definition

2.2. Scope of the study

2.2.1. Research Objective

2.2.2. Assumption

2.2.3. Limitations

3. RESEARCH METHODOLOGY

3.1. Overview

3.2. Data Mining

3.3. Secondary Research

3.4. Primary Research

3.4.1. Primary Interviews and Information Gathering Process

3.4.2. Breakdown of Primary Respondents

3.5. Forecasting Model

3.6. Market Size Estimation

3.6.1. Bottom-Up Approach

3.6.2. Top-Down Approach

3.7. Data Triangulation

3.8. Validation

4. MARKET DYNAMICS

4.1. Overview

4.2. Drivers

4.3. Restraints

4.4. Opportunities

5. MARKET FACTOR ANALYSIS

5.1. Value chain Analysis

5.2. Porter's Five Forces Analysis

5.2.1. Bargaining Power of Suppliers

5.2.2. Bargaining Power of Buyers

5.2.3. Threat of New Entrants

5.2.4. Threat of Substitutes

5.2.5. Intensity of Rivalry

5.3. COVID-19 Impact Analysis

5.3.1. Market Impact Analysis

5.3.2. Regional Impact

5.3.3. Opportunity and Threat Analysis

6. ALUMINUM INGOTS MARKET, BY GRADE (USD BILLION)

6.1. Primary Aluminum

6.2. Secondary Aluminum

6.3. Alloy Ingots

7. ALUMINUM INGOTS MARKET, BY END-USE INDUSTRY (USD BILLION)

7.1. Transportation

7.2. Construction

7.3. Electrical

7.4. Packaging

7.5. Industrial Machinery

8. ALUMINUM INGOTS MARKET, BY APPLICATION (USD BILLION)

8.1. Automotive Parts

8.2. Aircraft Components

8.3. Building Structures

8.4. Electrical Conductors

8.5. Machinery Components

9. ALUMINUM INGOTS MARKET, BY PURITY LEVEL (USD BILLION)

9.1. 99.0%

9.2. 99.5%

9.3. 99.7%

9.4. 99.9%

10. ALUMINUM INGOTS MARKET, BY REGIONAL (USD BILLION)

10.1. North America

10.1.1. US

10.1.2. Canada

10.2. Europe

10.2.1. Germany

10.2.2. UK

10.2.3. France

10.2.4. Russia

10.2.5. Italy

10.2.6. Spain

10.2.7. Rest of Europe

10.3. APAC

10.3.1. China

10.3.2. India

10.3.3. Japan

10.3.4. South Korea

10.3.5. Malaysia

10.3.6. Thailand

10.3.7. Indonesia

10.3.8. Rest of APAC

10.4. South America

10.4.1. Brazil

10.4.2. Mexico

10.4.3. Argentina

10.4.4. Rest of South America

10.5. MEA

10.5.1. GCC Countries

10.5.2. South Africa

10.5.3. Rest of MEA

11. COMPETITIVE LANDSCAPE

11.1. Overview

11.2. Competitive Analysis

11.3. Market share Analysis

11.4. Major Growth Strategy in the Aluminum Ingots Market

11.5. Competitive Benchmarking

11.6. Leading Players in Terms of Number of Developments in the Aluminum Ingots Market

11.7. Key developments and growth strategies

11.7.1. New Product Launch/Service Deployment

11.7.2. Merger & Acquisitions

11.7.3. Joint Ventures

11.8. Major Players Financial Matrix

11.8.1. Sales and Operating Income

11.8.2. Major Players R&D Expenditure. 2023

12. COMPANY PROFILES

12.1. Alcoa

12.1.1. Financial Overview

12.1.2. Products Offered

12.1.3. Key Developments

12.1.4. SWOT Analysis

12.1.5. Key Strategies

12.2. Norsk Hydro

12.2.1. Financial Overview

12.2.2. Products Offered

12.2.3. Key Developments

12.2.4. SWOT Analysis

12.2.5. Key Strategies

12.3. Constellium

12.3.1. Financial Overview

12.3.2. Products Offered

12.3.3. Key Developments

12.3.4. SWOT Analysis

12.3.5. Key Strategies

12.4. Rio Tinto

12.4.1. Financial Overview

12.4.2. Products Offered

12.4.3. Key Developments

12.4.4. SWOT Analysis

12.4.5. Key Strategies

12.5. Rusal

12.5.1. Financial Overview

12.5.2. Products Offered

12.5.3. Key Developments

12.5.4. SWOT Analysis

12.5.5. Key Strategies

12.6. China Hongqiao Group

12.6.1. Financial Overview

12.6.2. Products Offered

12.6.3. Key Developments

12.6.4. SWOT Analysis

12.6.5. Key Strategies

12.7. China Zhongwang

12.7.1. Financial Overview

12.7.2. Products Offered

12.7.3. Key Developments

12.7.4. SWOT Analysis

12.7.5. Key Strategies

12.8. Century Aluminum

12.8.1. Financial Overview

12.8.2. Products Offered

12.8.3. Key Developments

12.8.4. SWOT Analysis

12.8.5. Key Strategies

12.9. South32

12.9.1. Financial Overview

12.9.2. Products Offered

12.9.3. Key Developments

12.9.4. SWOT Analysis

12.9.5. Key Strategies

12.10. Vedanta Resources

12.10.1. Financial Overview

12.10.2. Products Offered

12.10.3. Key Developments

12.10.4. SWOT Analysis

12.10.5. Key Strategies

12.11. Novelis

12.11.1. Financial Overview

12.11.2. Products Offered

12.11.3. Key Developments

12.11.4. SWOT Analysis

12.11.5. Key Strategies

12.12. Hydro Extrusion

12.12.1. Financial Overview

12.12.2. Products Offered

12.12.3. Key Developments

12.12.4. SWOT Analysis

12.12.5. Key Strategies

12.13. United Company RUSAL

12.13.1. Financial Overview

12.13.2. Products Offered

12.13.3. Key Developments

12.13.4. SWOT Analysis

12.13.5. Key Strategies

12.14. SAPA

12.14.1. Financial Overview

12.14.2. Products Offered

12.14.3. Key Developments

12.14.4. SWOT Analysis

12.14.5. Key Strategies

12.15. Emirates Global Aluminium

12.15.1. Financial Overview

12.15.2. Products Offered

12.15.3. Key Developments

12.15.4. SWOT Analysis

12.15.5. Key Strategies

13. APPENDIX

13.1. References

13.2. Related Reports

LIST OF TABLES

TABLE 1. LIST OF ASSUMPTIONS

TABLE 2. NORTH AMERICA ALUMINUM INGOTS MARKET SIZE ESTIMATES & FORECAST BY GRADE, 2025-2034 (USD BILLIONS)

TABLE 3. NORTH AMERICA MARKET SIZE ESTIMATES & FORECAST BY END-USE INDUSTRY, 2025-2034 (USD BILLIONS)

TABLE 4. NORTH AMERICA MARKET SIZE ESTIMATES & FORECAST BY APPLICATION, 2025-2034 (USD BILLIONS)

TABLE 5. NORTH AMERICA MARKET SIZE ESTIMATES & FORECAST BY PURITY LEVEL, 2025-2034 (USD BILLIONS)

TABLE 6. NORTH AMERICA MARKET SIZE ESTIMATES & FORECAST BY REGIONAL, 2025-2034 (USD BILLIONS)

TABLE 7. US ALUMINUM INGOTS MARKET SIZE ESTIMATES & FORECAST BY GRADE, 2025-2034 (USD BILLIONS)

TABLE 8. US MARKET SIZE ESTIMATES & FORECAST BY END-USE INDUSTRY, 2025-2034 (USD BILLIONS)

TABLE 9. US MARKET SIZE ESTIMATES & FORECAST BY APPLICATION, 2025-2034 (USD BILLIONS)

TABLE 10. US MARKET SIZE ESTIMATES & FORECAST BY PURITY LEVEL, 2025-2034 (USD BILLIONS)

TABLE 11. US MARKET SIZE ESTIMATES & FORECAST BY REGIONAL, 2025-2034 (USD BILLIONS)

TABLE 12. CANADA ALUMINUM INGOTS MARKET SIZE ESTIMATES & FORECAST BY GRADE, 2025-2034 (USD BILLIONS)

TABLE 13. CANADA MARKET SIZE ESTIMATES & FORECAST BY END-USE INDUSTRY, 2025-2034 (USD BILLIONS)

TABLE 14. CANADA MARKET SIZE ESTIMATES & FORECAST BY APPLICATION, 2025-2034 (USD BILLIONS)

TABLE 15. CANADA MARKET SIZE ESTIMATES & FORECAST BY PURITY LEVEL, 2025-2034 (USD BILLIONS)

TABLE 16. CANADA MARKET SIZE ESTIMATES & FORECAST BY REGIONAL, 2025-2034 (USD BILLIONS)

TABLE 17. EUROPE ALUMINUM INGOTS MARKET SIZE ESTIMATES & FORECAST BY GRADE, 2025-2034 (USD BILLIONS)

TABLE 18. EUROPE MARKET SIZE ESTIMATES & FORECAST BY END-USE INDUSTRY, 2025-2034 (USD BILLIONS)

TABLE 19. EUROPE MARKET SIZE ESTIMATES & FORECAST BY APPLICATION, 2025-2034 (USD BILLIONS)

TABLE 20. EUROPE MARKET SIZE ESTIMATES & FORECAST BY PURITY LEVEL, 2025-2034 (USD BILLIONS)

TABLE 21. EUROPE MARKET SIZE ESTIMATES & FORECAST BY REGIONAL, 2025-2034 (USD BILLIONS)

TABLE 22. GERMANY ALUMINUM INGOTS MARKET SIZE ESTIMATES & FORECAST BY GRADE, 2025-2034 (USD BILLIONS)

TABLE 23. GERMANY MARKET SIZE ESTIMATES & FORECAST BY END-USE INDUSTRY, 2025-2034 (USD BILLIONS)

TABLE 24. GERMANY MARKET SIZE ESTIMATES & FORECAST BY APPLICATION, 2025-2034 (USD BILLIONS)

TABLE 25. GERMANY MARKET SIZE ESTIMATES & FORECAST BY PURITY LEVEL, 2025-2034 (USD BILLIONS)

TABLE 26. GERMANY MARKET SIZE ESTIMATES & FORECAST BY REGIONAL, 2025-2034 (USD BILLIONS)

TABLE 27. UK ALUMINUM INGOTS MARKET SIZE ESTIMATES & FORECAST BY GRADE, 2025-2034 (USD BILLIONS)

TABLE 28. UK MARKET SIZE ESTIMATES & FORECAST BY END-USE INDUSTRY, 2025-2034 (USD BILLIONS)

TABLE 29. UK MARKET SIZE ESTIMATES & FORECAST BY APPLICATION, 2025-2034 (USD BILLIONS)

TABLE 30. UK MARKET SIZE ESTIMATES & FORECAST BY PURITY LEVEL, 2025-2034 (USD BILLIONS)

TABLE 31. UK MARKET SIZE ESTIMATES & FORECAST BY REGIONAL, 2025-2034 (USD BILLIONS)

TABLE 32. FRANCE ALUMINUM INGOTS MARKET SIZE ESTIMATES & FORECAST BY GRADE, 2025-2034 (USD BILLIONS)

TABLE 33. FRANCE MARKET SIZE ESTIMATES & FORECAST BY END-USE INDUSTRY, 2025-2034 (USD BILLIONS)

TABLE 34. FRANCE MARKET SIZE ESTIMATES & FORECAST BY APPLICATION, 2025-2034 (USD BILLIONS)

TABLE 35. FRANCE MARKET SIZE ESTIMATES & FORECAST BY PURITY LEVEL, 2025-2034 (USD BILLIONS)

TABLE 36. FRANCE MARKET SIZE ESTIMATES & FORECAST BY REGIONAL, 2025-2034 (USD BILLIONS)

TABLE 37. RUSSIA ALUMINUM INGOTS MARKET SIZE ESTIMATES & FORECAST BY GRADE, 2025-2034 (USD BILLIONS)

TABLE 38. RUSSIA MARKET SIZE ESTIMATES & FORECAST BY END-USE INDUSTRY, 2025-2034 (USD BILLIONS)

TABLE 39. RUSSIA MARKET SIZE ESTIMATES & FORECAST BY APPLICATION, 2025-2034 (USD BILLIONS)

TABLE 40. RUSSIA MARKET SIZE ESTIMATES & FORECAST BY PURITY LEVEL, 2025-2034 (USD BILLIONS)

TABLE 41. RUSSIA MARKET SIZE ESTIMATES & FORECAST BY REGIONAL, 2025-2034 (USD BILLIONS)

TABLE 42. ITALY ALUMINUM INGOTS MARKET SIZE ESTIMATES & FORECAST BY GRADE, 2025-2034 (USD BILLIONS)

TABLE 43. ITALY MARKET SIZE ESTIMATES & FORECAST BY END-USE INDUSTRY, 2025-2034 (USD BILLIONS)

TABLE 44. ITALY MARKET SIZE ESTIMATES & FORECAST BY APPLICATION, 2025-2034 (USD BILLIONS)

TABLE 45. ITALY MARKET SIZE ESTIMATES & FORECAST BY PURITY LEVEL, 2025-2034 (USD BILLIONS)

TABLE 46. ITALY MARKET SIZE ESTIMATES & FORECAST BY REGIONAL, 2025-2034 (USD BILLIONS)

TABLE 47. SPAIN ALUMINUM INGOTS MARKET SIZE ESTIMATES & FORECAST BY GRADE, 2025-2034 (USD BILLIONS)

TABLE 48. SPAIN MARKET SIZE ESTIMATES & FORECAST BY END-USE INDUSTRY, 2025-2034 (USD BILLIONS)

TABLE 49. SPAIN MARKET SIZE ESTIMATES & FORECAST BY APPLICATION, 2025-2034 (USD BILLIONS)

TABLE 50. SPAIN MARKET SIZE ESTIMATES & FORECAST BY PURITY LEVEL, 2025-2034 (USD BILLIONS)

TABLE 51. SPAIN MARKET SIZE ESTIMATES & FORECAST BY REGIONAL, 2025-2034 (USD BILLIONS)

TABLE 52. REST OF EUROPE ALUMINUM INGOTS MARKET SIZE ESTIMATES & FORECAST BY GRADE, 2025-2034 (USD BILLIONS)

TABLE 53. REST OF EUROPE MARKET SIZE ESTIMATES & FORECAST BY END-USE INDUSTRY, 2025-2034 (USD BILLIONS)

TABLE 54. REST OF EUROPE MARKET SIZE ESTIMATES & FORECAST BY APPLICATION, 2025-2034 (USD BILLIONS)

TABLE 55. REST OF EUROPE MARKET SIZE ESTIMATES & FORECAST BY PURITY LEVEL, 2025-2034 (USD BILLIONS)

TABLE 56. REST OF EUROPE MARKET SIZE ESTIMATES & FORECAST BY REGIONAL, 2025-2034 (USD BILLIONS)

TABLE 57. APAC ALUMINUM INGOTS MARKET SIZE ESTIMATES & FORECAST BY GRADE, 2025-2034 (USD BILLIONS)

TABLE 58. APAC MARKET SIZE ESTIMATES & FORECAST BY END-USE INDUSTRY, 2025-2034 (USD BILLIONS)

TABLE 59. APAC MARKET SIZE ESTIMATES & FORECAST BY APPLICATION, 2025-2034 (USD BILLIONS)

TABLE 60. APAC MARKET SIZE ESTIMATES & FORECAST BY PURITY LEVEL, 2025-2034 (USD BILLIONS)

TABLE 61. APAC MARKET SIZE ESTIMATES & FORECAST BY REGIONAL, 2025-2034 (USD BILLIONS)

TABLE 62. CHINA ALUMINUM INGOTS MARKET SIZE ESTIMATES & FORECAST BY GRADE, 2025-2034 (USD BILLIONS)

TABLE 63. CHINA MARKET SIZE ESTIMATES & FORECAST BY END-USE INDUSTRY, 2025-2034 (USD BILLIONS)

TABLE 64. CHINA MARKET SIZE ESTIMATES & FORECAST BY APPLICATION, 2025-2034 (USD BILLIONS)

TABLE 65. CHINA MARKET SIZE ESTIMATES & FORECAST BY PURITY LEVEL, 2025-2034 (USD BILLIONS)

TABLE 66. CHINA MARKET SIZE ESTIMATES & FORECAST BY REGIONAL, 2025-2034 (USD BILLIONS)

TABLE 67. INDIA ALUMINUM INGOTS MARKET SIZE ESTIMATES & FORECAST BY GRADE, 2025-2034 (USD BILLIONS)

TABLE 68. INDIA MARKET SIZE ESTIMATES & FORECAST BY END-USE INDUSTRY, 2025-2034 (USD BILLIONS)

TABLE 69. INDIA MARKET SIZE ESTIMATES & FORECAST BY APPLICATION, 2025-2034 (USD BILLIONS)

TABLE 70. INDIA MARKET SIZE ESTIMATES & FORECAST BY PURITY LEVEL, 2025-2034 (USD BILLIONS)

TABLE 71. INDIA MARKET SIZE ESTIMATES & FORECAST BY REGIONAL, 2025-2034 (USD BILLIONS)

TABLE 72. JAPAN ALUMINUM INGOTS MARKET SIZE ESTIMATES & FORECAST BY GRADE, 2025-2034 (USD BILLIONS)

TABLE 73. JAPAN MARKET SIZE ESTIMATES & FORECAST BY END-USE INDUSTRY, 2025-2034 (USD BILLIONS)

TABLE 74. JAPAN MARKET SIZE ESTIMATES & FORECAST BY APPLICATION, 2025-2034 (USD BILLIONS)

TABLE 75. JAPAN MARKET SIZE ESTIMATES & FORECAST BY PURITY LEVEL, 2025-2034 (USD BILLIONS)

TABLE 76. JAPAN MARKET SIZE ESTIMATES & FORECAST BY REGIONAL, 2025-2034 (USD BILLIONS)

TABLE 77. SOUTH KOREA ALUMINUM INGOTS MARKET SIZE ESTIMATES & FORECAST BY GRADE, 2025-2034 (USD BILLIONS)

TABLE 78. SOUTH KOREA MARKET SIZE ESTIMATES & FORECAST BY END-USE INDUSTRY, 2025-2034 (USD BILLIONS)

TABLE 79. SOUTH KOREA MARKET SIZE ESTIMATES & FORECAST BY APPLICATION, 2025-2034 (USD BILLIONS)

TABLE 80. SOUTH KOREA MARKET SIZE ESTIMATES & FORECAST BY PURITY LEVEL, 2025-2034 (USD BILLIONS)

TABLE 81. SOUTH KOREA MARKET SIZE ESTIMATES & FORECAST BY REGIONAL, 2025-2034 (USD BILLIONS)

TABLE 82. MALAYSIA ALUMINUM INGOTS MARKET SIZE ESTIMATES & FORECAST BY GRADE, 2025-2034 (USD BILLIONS)

TABLE 83. MALAYSIA MARKET SIZE ESTIMATES & FORECAST BY END-USE INDUSTRY, 2025-2034 (USD BILLIONS)

TABLE 84. MALAYSIA MARKET SIZE ESTIMATES & FORECAST BY APPLICATION, 2025-2034 (USD BILLIONS)

TABLE 85. MALAYSIA MARKET SIZE ESTIMATES & FORECAST BY PURITY LEVEL, 2025-2034 (USD BILLIONS)

TABLE 86. MALAYSIA MARKET SIZE ESTIMATES & FORECAST BY REGIONAL, 2025-2034 (USD BILLIONS)

TABLE 87. THAILAND ALUMINUM INGOTS MARKET SIZE ESTIMATES & FORECAST BY GRADE, 2025-2034 (USD BILLIONS)

TABLE 88. THAILAND MARKET SIZE ESTIMATES & FORECAST BY END-USE INDUSTRY, 2025-2034 (USD BILLIONS)

TABLE 89. THAILAND MARKET SIZE ESTIMATES & FORECAST BY APPLICATION, 2025-2034 (USD BILLIONS)

TABLE 90. THAILAND MARKET SIZE ESTIMATES & FORECAST BY PURITY LEVEL, 2025-2034 (USD BILLIONS)

TABLE 91. THAILAND MARKET SIZE ESTIMATES & FORECAST BY REGIONAL, 2025-2034 (USD BILLIONS)

TABLE 92. INDONESIA ALUMINUM INGOTS MARKET SIZE ESTIMATES & FORECAST BY GRADE, 2025-2034 (USD BILLIONS)

TABLE 93. INDONESIA MARKET SIZE ESTIMATES & FORECAST BY END-USE INDUSTRY, 2025-2034 (USD BILLIONS)

TABLE 94. INDONESIA MARKET SIZE ESTIMATES & FORECAST BY APPLICATION, 2025-2034 (USD BILLIONS)

TABLE 95. INDONESIA MARKET SIZE ESTIMATES & FORECAST BY PURITY LEVEL, 2025-2034 (USD BILLIONS)

TABLE 96. INDONESIA MARKET SIZE ESTIMATES & FORECAST BY REGIONAL, 2025-2034 (USD BILLIONS)

TABLE 97. REST OF APAC ALUMINUM INGOTS MARKET SIZE ESTIMATES & FORECAST BY GRADE, 2025-2034 (USD BILLIONS)

TABLE 98. REST OF APAC MARKET SIZE ESTIMATES & FORECAST BY END-USE INDUSTRY, 2025-2034 (USD BILLIONS)

TABLE 99. REST OF APAC MARKET SIZE ESTIMATES & FORECAST BY APPLICATION, 2025-2034 (USD BILLIONS)

TABLE 100. REST OF APAC MARKET SIZE ESTIMATES & FORECAST BY PURITY LEVEL, 2025-2034 (USD BILLIONS)

TABLE 101. REST OF APAC MARKET SIZE ESTIMATES & FORECAST BY REGIONAL, 2025-2034 (USD BILLIONS)

TABLE 102. SOUTH AMERICA ALUMINUM INGOTS MARKET SIZE ESTIMATES & FORECAST BY GRADE, 2025-2034 (USD BILLIONS)

TABLE 103. SOUTH AMERICA MARKET SIZE ESTIMATES & FORECAST BY END-USE INDUSTRY, 2025-2034 (USD BILLIONS)

TABLE 104. SOUTH AMERICA MARKET SIZE ESTIMATES & FORECAST BY APPLICATION, 2025-2034 (USD BILLIONS)

TABLE 105. SOUTH AMERICA MARKET SIZE ESTIMATES & FORECAST BY PURITY LEVEL, 2025-2034 (USD BILLIONS)

TABLE 106. SOUTH AMERICA MARKET SIZE ESTIMATES & FORECAST BY REGIONAL, 2025-2034 (USD BILLIONS)

TABLE 107. BRAZIL ALUMINUM INGOTS MARKET SIZE ESTIMATES & FORECAST BY GRADE, 2025-2034 (USD BILLIONS)

TABLE 108. BRAZIL MARKET SIZE ESTIMATES & FORECAST BY END-USE INDUSTRY, 2025-2034 (USD BILLIONS)

TABLE 109. BRAZIL MARKET SIZE ESTIMATES & FORECAST BY APPLICATION, 2025-2034 (USD BILLIONS)

TABLE 110. BRAZIL MARKET SIZE ESTIMATES & FORECAST BY PURITY LEVEL, 2025-2034 (USD BILLIONS)

TABLE 111. BRAZIL MARKET SIZE ESTIMATES & FORECAST BY REGIONAL, 2025-2034 (USD BILLIONS)

TABLE 112. MEXICO ALUMINUM INGOTS MARKET SIZE ESTIMATES & FORECAST BY GRADE, 2025-2034 (USD BILLIONS)

TABLE 113. MEXICO MARKET SIZE ESTIMATES & FORECAST BY END-USE INDUSTRY, 2025-2034 (USD BILLIONS)

TABLE 114. MEXICO MARKET SIZE ESTIMATES & FORECAST BY APPLICATION, 2025-2034 (USD BILLIONS)

TABLE 115. MEXICO MARKET SIZE ESTIMATES & FORECAST BY PURITY LEVEL, 2025-2034 (USD BILLIONS)

TABLE 116. MEXICO MARKET SIZE ESTIMATES & FORECAST BY REGIONAL, 2025-2034 (USD BILLIONS)

TABLE 117. ARGENTINA ALUMINUM INGOTS MARKET SIZE ESTIMATES & FORECAST BY GRADE, 2025-2034 (USD BILLIONS)

TABLE 118. ARGENTINA MARKET SIZE ESTIMATES & FORECAST BY END-USE INDUSTRY, 2025-2034 (USD BILLIONS)

TABLE 119. ARGENTINA MARKET SIZE ESTIMATES & FORECAST BY APPLICATION, 2025-2034 (USD BILLIONS)

TABLE 120. ARGENTINA MARKET SIZE ESTIMATES & FORECAST BY PURITY LEVEL, 2025-2034 (USD BILLIONS)

TABLE 121. ARGENTINA MARKET SIZE ESTIMATES & FORECAST BY REGIONAL, 2025-2034 (USD BILLIONS)

TABLE 122. REST OF SOUTH AMERICA ALUMINUM INGOTS MARKET SIZE ESTIMATES & FORECAST BY GRADE, 2025-2034 (USD BILLIONS)

TABLE 123. REST OF SOUTH AMERICA MARKET SIZE ESTIMATES & FORECAST BY END-USE INDUSTRY, 2025-2034 (USD BILLIONS)

TABLE 124. REST OF SOUTH AMERICA MARKET SIZE ESTIMATES & FORECAST BY APPLICATION, 2025-2034 (USD BILLIONS)

TABLE 125. REST OF SOUTH AMERICA MARKET SIZE ESTIMATES & FORECAST BY PURITY LEVEL, 2025-2034 (USD BILLIONS)

TABLE 126. REST OF SOUTH AMERICA MARKET SIZE ESTIMATES & FORECAST BY REGIONAL, 2025-2034 (USD BILLIONS)

TABLE 127. MEA ALUMINUM INGOTS MARKET SIZE ESTIMATES & FORECAST BY GRADE, 2025-2034 (USD BILLIONS)

TABLE 128. MEA MARKET SIZE ESTIMATES & FORECAST BY END-USE INDUSTRY, 2025-2034 (USD BILLIONS)

TABLE 129. MEA MARKET SIZE ESTIMATES & FORECAST BY APPLICATION, 2025-2034 (USD BILLIONS)

TABLE 130. MEA MARKET SIZE ESTIMATES & FORECAST BY PURITY LEVEL, 2025-2034 (USD BILLIONS)

TABLE 131. MEA MARKET SIZE ESTIMATES & FORECAST BY REGIONAL, 2025-2034 (USD BILLIONS)

TABLE 132. GCC COUNTRIES ALUMINUM INGOTS MARKET SIZE ESTIMATES & FORECAST BY GRADE, 2025-2034 (USD BILLIONS)

TABLE 133. GCC COUNTRIES MARKET SIZE ESTIMATES & FORECAST BY END-USE INDUSTRY, 2025-2034 (USD BILLIONS)

TABLE 134. GCC COUNTRIES MARKET SIZE ESTIMATES & FORECAST BY APPLICATION, 2025-2034 (USD BILLIONS)

TABLE 135. GCC COUNTRIES MARKET SIZE ESTIMATES & FORECAST BY PURITY LEVEL, 2025-2034 (USD BILLIONS)

TABLE 136. GCC COUNTRIES MARKET SIZE ESTIMATES & FORECAST BY REGIONAL, 2025-2034 (USD BILLIONS)

TABLE 137. SOUTH AFRICA ALUMINUM INGOTS MARKET SIZE ESTIMATES & FORECAST BY GRADE, 2025-2034 (USD BILLIONS)

TABLE 138. SOUTH AFRICA MARKET SIZE ESTIMATES & FORECAST BY END-USE INDUSTRY, 2025-2034 (USD BILLIONS)

TABLE 139. SOUTH AFRICA MARKET SIZE ESTIMATES & FORECAST BY APPLICATION, 2025-2034 (USD BILLIONS)

TABLE 140. SOUTH AFRICA MARKET SIZE ESTIMATES & FORECAST BY PURITY LEVEL, 2025-2034 (USD BILLIONS)

TABLE 141. SOUTH AFRICA MARKET SIZE ESTIMATES & FORECAST BY REGIONAL, 2025-2034 (USD BILLIONS)

TABLE 142. REST OF MEA ALUMINUM INGOTS MARKET SIZE ESTIMATES & FORECAST BY GRADE, 2025-2034 (USD BILLIONS)

TABLE 143. REST OF MEA MARKET SIZE ESTIMATES & FORECAST BY END-USE INDUSTRY, 2025-2034 (USD BILLIONS)

TABLE 144. REST OF MEA MARKET SIZE ESTIMATES & FORECAST BY APPLICATION, 2025-2034 (USD BILLIONS)

TABLE 145. REST OF MEA MARKET SIZE ESTIMATES & FORECAST BY PURITY LEVEL, 2025-2034 (USD BILLIONS)

TABLE 146. REST OF MEA MARKET SIZE ESTIMATES & FORECAST BY REGIONAL, 2025-2034 (USD BILLIONS)

TABLE 147. PRODUCT LAUNCH/PRODUCT DEVELOPMENT/APPROVAL

TABLE 148. ACQUISITION/PARTNERSHIP

LIST OF FIGURES

FIGURE 1. ALUMINUM INGOTS MARKET SYNOPSIS

FIGURE 2. NORTH AMERICA ALUMINUM INGOTS MARKET ANALYSIS

FIGURE 3. US ALUMINUM INGOTS MARKET ANALYSIS BY GRADE

FIGURE 4. US MARKET ANALYSIS BY END-USE INDUSTRY

FIGURE 5. US MARKET ANALYSIS BY APPLICATION

FIGURE 6. US MARKET ANALYSIS BY PURITY LEVEL

FIGURE 7. US MARKET ANALYSIS BY REGIONAL

FIGURE 8. CANADA ALUMINUM INGOTS MARKET ANALYSIS BY GRADE

FIGURE 9. CANADA MARKET ANALYSIS BY END-USE INDUSTRY

FIGURE 10. CANADA MARKET ANALYSIS BY APPLICATION

FIGURE 11. CANADA MARKET ANALYSIS BY PURITY LEVEL

FIGURE 12. CANADA MARKET ANALYSIS BY REGIONAL

FIGURE 13. EUROPE ALUMINUM INGOTS MARKET ANALYSIS

FIGURE 14. GERMANY ALUMINUM INGOTS MARKET ANALYSIS BY GRADE

FIGURE 15. GERMANY MARKET ANALYSIS BY END-USE INDUSTRY

FIGURE 16. GERMANY MARKET ANALYSIS BY APPLICATION

FIGURE 17. GERMANY MARKET ANALYSIS BY PURITY LEVEL

FIGURE 18. GERMANY MARKET ANALYSIS BY REGIONAL

FIGURE 19. UK ALUMINUM INGOTS MARKET ANALYSIS BY GRADE

FIGURE 20. UK MARKET ANALYSIS BY END-USE INDUSTRY

FIGURE 21. UK MARKET ANALYSIS BY APPLICATION

FIGURE 22. UK MARKET ANALYSIS BY PURITY LEVEL

FIGURE 23. UK MARKET ANALYSIS BY REGIONAL

FIGURE 24. FRANCE ALUMINUM INGOTS MARKET ANALYSIS BY GRADE

FIGURE 25. FRANCE MARKET ANALYSIS BY END-USE INDUSTRY

FIGURE 26. FRANCE MARKET ANALYSIS BY APPLICATION

FIGURE 27. FRANCE MARKET ANALYSIS BY PURITY LEVEL

FIGURE 28. FRANCE MARKET ANALYSIS BY REGIONAL

FIGURE 29. RUSSIA ALUMINUM INGOTS MARKET ANALYSIS BY GRADE

FIGURE 30. RUSSIA MARKET ANALYSIS BY END-USE INDUSTRY

FIGURE 31. RUSSIA MARKET ANALYSIS BY APPLICATION

FIGURE 32. RUSSIA MARKET ANALYSIS BY PURITY LEVEL

FIGURE 33. RUSSIA MARKET ANALYSIS BY REGIONAL

FIGURE 34. ITALY ALUMINUM INGOTS MARKET ANALYSIS BY GRADE

FIGURE 35. ITALY MARKET ANALYSIS BY END-USE INDUSTRY

FIGURE 36. ITALY MARKET ANALYSIS BY APPLICATION

FIGURE 37. ITALY MARKET ANALYSIS BY PURITY LEVEL

FIGURE 38. ITALY MARKET ANALYSIS BY REGIONAL

FIGURE 39. SPAIN ALUMINUM INGOTS MARKET ANALYSIS BY GRADE

FIGURE 40. SPAIN MARKET ANALYSIS BY END-USE INDUSTRY

FIGURE 41. SPAIN MARKET ANALYSIS BY APPLICATION

FIGURE 42. SPAIN MARKET ANALYSIS BY PURITY LEVEL

FIGURE 43. SPAIN MARKET ANALYSIS BY REGIONAL

FIGURE 44. REST OF EUROPE ALUMINUM INGOTS MARKET ANALYSIS BY GRADE

FIGURE 45. REST OF EUROPE MARKET ANALYSIS BY END-USE INDUSTRY

FIGURE 46. REST OF EUROPE MARKET ANALYSIS BY APPLICATION

FIGURE 47. REST OF EUROPE MARKET ANALYSIS BY PURITY LEVEL

FIGURE 48. REST OF EUROPE MARKET ANALYSIS BY REGIONAL

FIGURE 49. APAC ALUMINUM INGOTS MARKET ANALYSIS

FIGURE 50. CHINA ALUMINUM INGOTS MARKET ANALYSIS BY GRADE

FIGURE 51. CHINA MARKET ANALYSIS BY END-USE INDUSTRY

FIGURE 52. CHINA MARKET ANALYSIS BY APPLICATION

FIGURE 53. CHINA MARKET ANALYSIS BY PURITY LEVEL

FIGURE 54. CHINA MARKET ANALYSIS BY REGIONAL

FIGURE 55. INDIA ALUMINUM INGOTS MARKET ANALYSIS BY GRADE

FIGURE 56. INDIA MARKET ANALYSIS BY END-USE INDUSTRY

FIGURE 57. INDIA MARKET ANALYSIS BY APPLICATION

FIGURE 58. INDIA MARKET ANALYSIS BY PURITY LEVEL

FIGURE 59. INDIA MARKET ANALYSIS BY REGIONAL

FIGURE 60. JAPAN ALUMINUM INGOTS MARKET ANALYSIS BY GRADE

FIGURE 61. JAPAN MARKET ANALYSIS BY END-USE INDUSTRY

FIGURE 62. JAPAN MARKET ANALYSIS BY APPLICATION

FIGURE 63. JAPAN MARKET ANALYSIS BY PURITY LEVEL

FIGURE 64. JAPAN MARKET ANALYSIS BY REGIONAL

FIGURE 65. SOUTH KOREA ALUMINUM INGOTS MARKET ANALYSIS BY GRADE

FIGURE 66. SOUTH KOREA MARKET ANALYSIS BY END-USE INDUSTRY

FIGURE 67. SOUTH KOREA MARKET ANALYSIS BY APPLICATION

FIGURE 68. SOUTH KOREA MARKET ANALYSIS BY PURITY LEVEL

FIGURE 69. SOUTH KOREA MARKET ANALYSIS BY REGIONAL

FIGURE 70. MALAYSIA ALUMINUM INGOTS MARKET ANALYSIS BY GRADE

FIGURE 71. MALAYSIA MARKET ANALYSIS BY END-USE INDUSTRY

FIGURE 72. MALAYSIA MARKET ANALYSIS BY APPLICATION

FIGURE 73. MALAYSIA MARKET ANALYSIS BY PURITY LEVEL

FIGURE 74. MALAYSIA MARKET ANALYSIS BY REGIONAL

FIGURE 75. THAILAND ALUMINUM INGOTS MARKET ANALYSIS BY GRADE

FIGURE 76. THAILAND MARKET ANALYSIS BY END-USE INDUSTRY

FIGURE 77. THAILAND MARKET ANALYSIS BY APPLICATION

FIGURE 78. THAILAND MARKET ANALYSIS BY PURITY LEVEL

FIGURE 79. THAILAND MARKET ANALYSIS BY REGIONAL

FIGURE 80. INDONESIA ALUMINUM INGOTS MARKET ANALYSIS BY GRADE

FIGURE 81. INDONESIA MARKET ANALYSIS BY END-USE INDUSTRY

FIGURE 82. INDONESIA MARKET ANALYSIS BY APPLICATION

FIGURE 83. INDONESIA MARKET ANALYSIS BY PURITY LEVEL

FIGURE 84. INDONESIA MARKET ANALYSIS BY REGIONAL

FIGURE 85. REST OF APAC ALUMINUM INGOTS MARKET ANALYSIS BY GRADE

FIGURE 86. REST OF APAC MARKET ANALYSIS BY END-USE INDUSTRY

FIGURE 87. REST OF APAC MARKET ANALYSIS BY APPLICATION

FIGURE 88. REST OF APAC MARKET ANALYSIS BY PURITY LEVEL

FIGURE 89. REST OF APAC MARKET ANALYSIS BY REGIONAL

FIGURE 90. SOUTH AMERICA ALUMINUM INGOTS MARKET ANALYSIS

FIGURE 91. BRAZIL ALUMINUM INGOTS MARKET ANALYSIS BY GRADE

FIGURE 92. BRAZIL MARKET ANALYSIS BY END-USE INDUSTRY

FIGURE 93. BRAZIL MARKET ANALYSIS BY APPLICATION

FIGURE 94. BRAZIL MARKET ANALYSIS BY PURITY LEVEL

FIGURE 95. BRAZIL MARKET ANALYSIS BY REGIONAL

FIGURE 96. MEXICO ALUMINUM INGOTS MARKET ANALYSIS BY GRADE

FIGURE 97. MEXICO MARKET ANALYSIS BY END-USE INDUSTRY

FIGURE 98. MEXICO MARKET ANALYSIS BY APPLICATION

FIGURE 99. MEXICO MARKET ANALYSIS BY PURITY LEVEL

FIGURE 100. MEXICO MARKET ANALYSIS BY REGIONAL

FIGURE 101. ARGENTINA ALUMINUM INGOTS MARKET ANALYSIS BY GRADE

FIGURE 102. ARGENTINA MARKET ANALYSIS BY END-USE INDUSTRY

FIGURE 103. ARGENTINA MARKET ANALYSIS BY APPLICATION

FIGURE 104. ARGENTINA MARKET ANALYSIS BY PURITY LEVEL

FIGURE 105. ARGENTINA MARKET ANALYSIS BY REGIONAL

FIGURE 106. REST OF SOUTH AMERICA ALUMINUM INGOTS MARKET ANALYSIS BY GRADE

FIGURE 107. REST OF SOUTH AMERICA MARKET ANALYSIS BY END-USE INDUSTRY

FIGURE 108. REST OF SOUTH AMERICA MARKET ANALYSIS BY APPLICATION

FIGURE 109. REST OF SOUTH AMERICA MARKET ANALYSIS BY PURITY LEVEL

FIGURE 110. REST OF SOUTH AMERICA MARKET ANALYSIS BY REGIONAL

FIGURE 111. MEA ALUMINUM INGOTS MARKET ANALYSIS

FIGURE 112. GCC COUNTRIES ALUMINUM INGOTS MARKET ANALYSIS BY GRADE

FIGURE 113. GCC COUNTRIES MARKET ANALYSIS BY END-USE INDUSTRY

FIGURE 114. GCC COUNTRIES MARKET ANALYSIS BY APPLICATION

FIGURE 115. GCC COUNTRIES MARKET ANALYSIS BY PURITY LEVEL

FIGURE 116. GCC COUNTRIES MARKET ANALYSIS BY REGIONAL

FIGURE 117. SOUTH AFRICA ALUMINUM INGOTS MARKET ANALYSIS BY GRADE

FIGURE 118. SOUTH AFRICA MARKET ANALYSIS BY END-USE INDUSTRY

FIGURE 119. SOUTH AFRICA MARKET ANALYSIS BY APPLICATION

FIGURE 120. SOUTH AFRICA MARKET ANALYSIS BY PURITY LEVEL

FIGURE 121. SOUTH AFRICA MARKET ANALYSIS BY REGIONAL

FIGURE 122. REST OF MEA ALUMINUM INGOTS MARKET ANALYSIS BY GRADE

FIGURE 123. REST OF MEA MARKET ANALYSIS BY END-USE INDUSTRY

FIGURE 124. REST OF MEA MARKET ANALYSIS BY APPLICATION

FIGURE 125. REST OF MEA MARKET ANALYSIS BY PURITY LEVEL

FIGURE 126. REST OF MEA MARKET ANALYSIS BY REGIONAL

FIGURE 127. KEY BUYING CRITERIA OF ALUMINUM INGOTS MARKET

FIGURE 128. RESEARCH PROCESS OF MRFR

FIGURE 129. DRO ANALYSIS OF ALUMINUM INGOTS MARKET

FIGURE 130. DRIVERS IMPACT ANALYSIS: ALUMINUM INGOTS MARKET

FIGURE 131. RESTRAINTS IMPACT ANALYSIS: ALUMINUM INGOTS MARKET

FIGURE 132. SUPPLY / VALUE CHAIN: ALUMINUM INGOTS MARKET

FIGURE 133. MARKET BY GRADE, 2024 (% SHARE)

FIGURE 134. MARKET BY GRADE, 2025-2034 (USD Billions)

FIGURE 135. MARKET BY END-USE INDUSTRY, 2024 (% SHARE)

FIGURE 136. MARKET BY END-USE INDUSTRY, 2025-2034 (USD Billions)

FIGURE 137. MARKET BY APPLICATION, 2024 (% SHARE)

FIGURE 138. MARKET BY APPLICATION, 2025-2034 (USD Billions)

FIGURE 139. MARKET BY PURITY LEVEL, 2024 (% SHARE)

FIGURE 140. MARKET BY PURITY LEVEL, 2025-2034 (USD Billions)

FIGURE 141. MARKET BY REGIONAL, 2024 (% SHARE)

FIGURE 142. MARKET BY REGIONAL, 2025-2034 (USD Billions)

FIGURE 143. BENCHMARKING OF MAJOR COMPETITORS

Leading companies partner with us for data-driven Insights.

clients

Kindly complete the form below to receive a free sample of this Report

We do not share your information with anyone. However, we may send you emails based on your report interest from time to time. You may contact us at any time to opt-out.

Tailored for You
  • Dedicated Research on any specifics segment or region.
  • Focused Research on specific players in the market.
  • Custom Report based only on your requirements.
  • Flexibility to add or subtract any chapter in the study.
  • Historic data from 2014 and forecasts outlook till 2040.
  • Flexibility of providing data/insights in formats (PDF, PPT, Excel).
  • Provide cross segmentation in applicable scenario/markets.
report-img