ID: MRFR/CnM/1499-CR | February 2021 | Region: Global | 299 Pages
1 Executive Summary
2 Market Introduction
2.1 Definition 24
2.2 Scope Of The Study 24
2.3 List Of Assumptions 25
2.4 Market Structure 26
2.5 Key Takeaways 26
3 Market Insights
4 Research Methodology
4.1 Research Process 32
4.2 Primary Research 32
4.3 Secondary Research 34
4.4 Market Size Estimation 34
4.5 Forecast Model 35
5 Market Dynamics
5.1 Introduction 37
5.2 Drivers 38
5.2.1 Increasing Demand For Aluminum In China 38
5.2.2 Increasing Use Of High-Strength Aluminum In The Aerospace And Automotive Industries 38
5.2.3 Growing Popularity Of Secondary Aluminum 38
5.3 Restraints 39
5.3.1 Adverse Effects Of Bauxite Mining 39
5.4 Opportunity 40
5.4.1 Use Of Aluminium Die Cast Products In The Automotive Industry 40
5.5 Supply Chain Analysis 41
5.5.1 Raw Materials And Suppliers 41
5.5.2 Aluminum Producers 41
5.5.3 Distributors 42
5.5.4 End-Use Industries 42
5.6 Porter’s Five Forces Model 42
5.6.1 Threat Of New Entrants 43
5.6.2 Threat Of Rivalry 43
5.6.3 Threat Of Substitutes 43
5.6.4 Bargaining Power Of Suppliers 43
5.6.5 Bargaining Power Of Buyers 43
5.7 Macroeconomic Indicators 44
5.8 Mega Trends 44
5.8.1 Key Development Trends 44
5.9 Global Bauxite Reserves And Production, By Region 45
6 Global Aluminum Market By Type
6.1 Introduction 47
6.2 Primary 48
6.3 Secondary 50
7 Global Aluminum Market, By Product
7.1 Introduction 52
7.2 Flat Rolled 56
7.2.1 Foil Stock 57
7.2.2 Can Body Stock 58
7.2.3 Common Alloy 59
7.2.4 Lithosheet 60
7.2.5 Building Sheet 61
7.2.6 Others 62
7.3 Castings 63
7.4 Extrusions 64
7.5 Forgings 65
7.6 Pigments & Powder 66
7.7 Rod & Bar 67
7.7.1 Aluminum Conductors 68
7.7.2 Wires & Cables 69
7.7.3 Others 70
7.8 Utensils 71
7.9 Others 72
8 Global Aluminum Market By Application
8.1 Introduction 74
8.2 Building & Construction 76
8.3 Transportation 77
8.4 Foil & Packaging 78
8.5 Electrical 79
8.6 Machinery & Equipment 80
8.7 Consumer Goods 81
8.8 Solar Industry 82
8.9 Utensils 83
8.10 Hardware & Accessories 84
8.11 Others 85
9 Global Aluminum Market By Region
9.1 Introduction 87
9.2 North America 89
9.2.1 The U.S. 93
9.2.2 Canada 97
9.3 Europe 101
9.3.1 Germany 106
9.3.2 France 110
9.3.3 UK 114
9.3.4 Spain 118
9.3.5 Italy 122
9.3.6 Russia 126
9.3.7 Benelux 130
9.3.8 Rest Of The Europe 134
9.4 Asia-Pacific 138
9.4.1 China 143
9.4.2 Japan 147
9.4.3 India 151
9.4.4 South Korea 155
9.4.5 Indonesia 159
9.4.6 Australia & New Zealand 163
9.4.7 Rest Of The Asia-Pacific 167
9.5 Middle East & Africa 171
9.5.1 GCC 176
9.5.2 Turkey 180
9.5.3 South Africa 184
9.5.4 Rest Of The Middle East & Africa 188
9.6 Latin America 192
9.6.1 Mexico 197
9.6.2 Brazil 201
9.6.3 Argentina 205
9.6.4 Rest Of The Latin America 209
10 Global Recycled Aluminum Market
10.1 Introduction 215
10.2 Overview On Wrought Alloys 219
10.3 Global Recycling Aluminum Industry Stakeholders 220
10.4 Recycled Aluminum Market: Key Opportunities Prioritized (KOP) 221
10.5 Global Aluminum Industry: Legislative Framework 223
11 Global High-End Aluminum Alloys Market
11.1 Global High-End Aluminum Alloys Market, By End-Use Industries, 2020-2027 226
11.2 Aerospace & Defence 227
11.3 Construction 228
11.4 Railways 229
11.5 Spacecrafts 230
11.6 Electrical 231
11.7 Others 232
12 Indian Aluminum Industry: Competitive Landscape
12.1 Introduction 234
12.2 Key Developments Of Major Indian Market Players 234
12.3 Installed Plants, By Company 235
12.4 India Aluminum Industry: Price Analysis 235
12.5 Key Developments And Strategies 236
12.5.1 Ongoing/Upcoming Projects And Major Investments In India 236
12.6 India Aluminum Market: Investment Outlook 236
13 Competitive Landscape
13.1 Introduction 238
13.2 Key Developments Of Major Global Aluminum Market Players 238
13.3 Installed Plants, By Company 240
13.4 Global Aluminum Market: Price Analysis 240
13.5 Global Aluminum Market: Investment Outlook 241
14 Company Profiles
14.1 Hindalco Industries Limited 244
14.1.1 Company Overview 244
14.1.2 Financial Overview 244
14.1.3 Products Offered 245
14.1.4 Key Developments 245
14.1.5 SWOT Analysis 245
14.1.6 Key Strategies 245
14.2 Vedanta Limited 246
14.2.1 Company Overview 246
14.2.2 Financial Overview 246
14.2.3 Products Offered 247
14.2.4 Key Developments 247
14.2.5 SWOT Analysis 248
14.2.6 Key Strategies 248
14.3 NALCO 249
14.3.1 Company Overview 249
14.3.2 Financial Overview 249
14.3.3 Products Offered 250
14.3.4 Key Developments 250
14.3.5 SWOT Analysis 250
14.3.6 Key Strategies 250
14.4 Kennametal India Limited 251
14.4.1 Company Overview 251
14.4.2 Financial Overview 251
14.4.3 Products Offered 252
14.4.4 Key Developments 252
14.4.5 SWOT Analysis 252
14.4.6 Key Strategies 252
14.5 Gujarat Foils Limited 253
14.5.1 Company Overview 253
14.5.2 Financial Overview 253
14.5.3 Products Offered 253
14.5.4 Key Developments 253
14.5.5 Key Strategies 254
14.5.6 SWOT Analysis 254
14.6 Alcoa Corporation 255
14.6.1 Company Overview 255
14.6.2 Financial Overview 255
14.6.3 Products Offered 256
14.6.4 Key Developments 256
14.6.5 SWOT Analysis 256
14.6.6 Key Strategies 256
14.7 Rio Tinto Alcan Inc. 257
14.7.1 Company Overview 257
14.7.2 Financial Overview 257
14.7.3 Products Offered 258
14.7.4 Key Developments 258
14.7.5 SWOT Analysis 258
14.7.6 Key Strategies 258
14.8 Rusal 259
14.8.1 Company Overview 259
14.8.2 Financial Overview 259
14.8.3 Products Offered 260
14.8.4 Key Developments 260
14.8.5 SWOT Analysis 260
14.8.6 Key Strategies 260
14.9 Norsk Hydro ASA 261
14.9.1 Company Overview 261
14.9.2 Financial Overview 261
14.9.3 Products Offered 262
14.9.4 Key Developments 262
14.9.5 SWOT Analysis 263
14.9.6 Key Strategies 263
14.10 Emirates Global Aluminum PJSC 264
14.10.1 Company Overview 264
14.10.2 Financial Overview 264
14.10.3 Products Offered 264
14.10.4 Key Developments 264
14.10.5 Key Strategies 264
14.11 Aluminium Bahrain (Alba) 265
14.11.1 Company Overview 265
14.11.2 Financial Overview 265
14.11.3 Products Offered 266
14.11.4 Key Developments 266
14.11.5 SWOT Analysis 266
14.11.6 Key Strategies 266
14.12 Century Aluminum Company 267
14.12.1 Company Overview 267
14.12.2 Financial Overview 267
14.12.3 Products Offered 268
14.12.4 Key Developments 268
14.12.5 SWOT Analysis 268
14.12.6 Key Strategies 268
14.13 Aluminum Corporation Of China 269
14.13.1 Company Overview 269
14.13.2 Financial Overview 269
14.13.3 Products Offered 270
14.13.4 Key Developments 270
14.13.5 SWOT Analysis 270
14.13.6 Key Strategies 270
14.14 China Hongqiao Group Limited 271
14.14.1 Company Overview 271
14.14.2 Financial Overview 271
14.14.3 Products Offered 272
14.14.4 Key Developments 272
14.14.5 SWOT Analysis 272
14.14.6 Key Strategies 272
14.15 BHP Billiton Aluminium Australia Pty Ltd 273
14.15.1 Company Overview 273
14.15.2 Financial Overview 273
14.15.3 Products Offered 273
14.15.4 Key Developments 273
14.15.5 SWOT Analysis 274
14.15.6 Key Strategy 274
15 Conclusion
16 Recommendations
17 List Of Tables
TABLE 1 LIST OF ASSUMPTIONS 25
TABLE 2 COMPARATIVE STRATEGIC ANALYSIS OF ALUMINUM CONSUMPTION, BY COUNTRY AND REGION 44
TABLE 3 GLOBAL BAUXITE RESERVES AND PRODUCTION, BY REGION (2015) 45
TABLE 4 GLOBAL ALUMINUM MARKET BY TYPE (USD MILLION) (2020-2027) 47
TABLE 5 GLOBAL ALUMINUM MARKET BY TYPE (KILOTON) (2020-2027) 48
TABLE 6 GLOBAL ALUMINUM MARKET FOR PRIMARY TYPE (USD MILLION) (2020-2027) 49
TABLE 7 GLOBAL ALUMINUM MARKET FOR PRIMARY TYPE (KILOTON) (2020-2027) 49
TABLE 8 GLOBAL ALUMINUM MARKET FOR SECONDARY TYPE (USD MILLION) (2020-2027) 50
TABLE 9 GLOBAL ALUMINUM MARKET FOR SECONDARY TYPE (KILOTON) (2020-2027) 50
TABLE 10 GLOBAL ALUMINUM MARKET BY PRODUCT (USD MILLION) (2020-2027) 53
TABLE 11 GLOBAL ALUMINUM MARKET BY PRODUCT (KILOTON) (2020-2027) 55
TABLE 12 GLOBAL ALUMINUM MARKET FOR FLAT ROLLED (USD MILLION) (2020-2027) 56
TABLE 13 GLOBAL ALUMINUM MARKET FOR FLAT ROLLED (KILOTON) (2020-2027) 56
TABLE 14 GLOBAL ALUMINUM MARKET FOR FOIL STOCK (USD MILLION) (2020-2027) 57
TABLE 15 GLOBAL ALUMINUM MARKET FOR FOIL STOCK (KILOTON) (2020-2027) 57
TABLE 16 GLOBAL ALUMINUM MARKET FOR CAN BODY STOCK (USD MILLION) (2020-2027) 58
TABLE 17 GLOBAL ALUMINUM MARKET FOR CAN BODY STOCK (KILOTON) (2020-2027) 58
TABLE 18 GLOBAL ALUMINUM MARKET FOR COMMON ALLOY (USD MILLION) (2020-2027) 59
TABLE 19 GLOBAL ALUMINUM MARKET FOR COMMON ALLOY (KILOTON) (2020-2027) 59
TABLE 20 GLOBAL ALUMINUM MARKET FOR LITHOSHEET (USD MILLION) (2020-2027) 60
TABLE 21 GLOBAL ALUMINUM MARKET FOR LITHOSHEET (KILOTON) (2020-2027) 60
TABLE 22 GLOBAL ALUMINUM MARKET FOR BUILDING SHEET (USD MILLION) (2020-2027) 61
TABLE 23 GLOBAL ALUMINUM MARKET FOR BUILDING SHEET (KILOTON) (2020-2027) 61
TABLE 24 GLOBAL ALUMINUM MARKET FOR OTHERS (USD MILLION) (2020-2027) 62
TABLE 25 GLOBAL ALUMINUM MARKET FOR OTHERS (KILOTON) (2020-2027) 62
TABLE 26 GLOBAL ALUMINUM MARKET FOR CASTINGS (USD MILLION) (2020-2027) 63
TABLE 27 GLOBAL ALUMINUM MARKET FOR CASTINGS (KILOTON) (2020-2027) 63
TABLE 28 GLOBAL ALUMINUM MARKET FOR EXTRUSIONS (USD MILLION) (2020-2027) 64
TABLE 29 GLOBAL ALUMINUM MARKET FOR EXTRUSIONS (KILOTON) (2020-2027) 64
TABLE 30 GLOBAL ALUMINUM MARKET FOR FORGINGS (USD MILLION) (2020-2027) 65
TABLE 31 GLOBAL ALUMINUM MARKET FOR FORGINGS (KILOTON) (2020-2027) 65
TABLE 32 GLOBAL ALUMINUM MARKET FOR PIGMENTS & POWDER (USD MILLION) (2020-2027) 66
TABLE 33 GLOBAL ALUMINUM MARKET FOR PIGMENTS & POWDER (KILOTON) (2020-2027) 66
TABLE 34 GLOBAL ALUMINUM MARKET FOR ROD & BAR (USD MILLION) (2020-2027) 67
TABLE 35 GLOBAL ALUMINUM MARKET FOR ROD & BAR (KILOTON) (2020-2027) 67
TABLE 36 GLOBAL ALUMINUM MARKET FOR ALUMINUM CONDUCTORS (USD MILLION) (2020-2027) 68
TABLE 37 GLOBAL ALUMINUM MARKET FOR ALUMINUM CONDUCTORS (KILOTON) (2020-2027) 68
TABLE 38 GLOBAL ALUMINUM MARKET FOR WIRES & CABLES (USD MILLION) (2020-2027) 69
TABLE 39 GLOBAL ALUMINUM MARKET FOR WIRES & CABLES (KILOTON) (2020-2027) 69
TABLE 40 GLOBAL ALUMINUM MARKET FOR OTHERS (USD MILLION) (2020-2027) 70
TABLE 41 GLOBAL ALUMINUM MARKET FOR OTHERS (KILOTON) (2020-2027) 70
TABLE 42 GLOBAL ALUMINUM MARKET FOR UTENSILS (USD MILLION) (2020-2027) 71
TABLE 43 GLOBAL ALUMINUM MARKET FOR UTENSILS (KILOTON) (2020-2027) 71
TABLE 44 GLOBAL ALUMINUM MARKET FOR OTHERS (USD MILLION) (2020-2027) 72
TABLE 45 GLOBAL ALUMINUM MARKET FOR OTHERS (KILOTON) (2020-2027) 72
TABLE 46 GLOBAL ALUMINUM MARKET BY APPLICATION (USD MILLION) (2020-2027) 74
TABLE 47 GLOBAL ALUMINUM MARKET BY APPLICATION (KILOTON) (2020-2027) 75
TABLE 48 GLOBAL ALUMINUM MARKET FOR BUILDING & CONSTRUCTION (USD MILLION) (2020-2027) 76
TABLE 49 GLOBAL ALUMINUM MARKET FOR BUILDING & CONSTRUCTION (KILOTON) (2020-2027) 76
TABLE 50 GLOBAL ALUMINUM MARKET FOR TRANSPORTATION (USD MILLION) (2020-2027) 77
TABLE 51 GLOBAL ALUMINUM MARKET FOR TRANSPORTATION (KILOTON) (2020-2027) 77
TABLE 52 GLOBAL ALUMINUM MARKET FOR FOIL & PACKAGING (USD MILLION) (2020-2027) 78
TABLE 53 GLOBAL ALUMINUM MARKET FOR FOIL & PACKAGING (KILOTON) (2020-2027) 78
TABLE 54 GLOBAL ALUMINUM MARKET FOR ELECTRICAL (USD MILLION) (2020-2027) 79
TABLE 55 GLOBAL ALUMINUM MARKET FOR ELECTRICAL (KILOTON) (2020-2027) 79
TABLE 56 GLOBAL ALUMINUM MARKET FOR MACHINERY & EQUIPMENT (USD MILLION) (2020-2027) 80
TABLE 57 GLOBAL ALUMINUM MARKET FOR MACHINERY & EQUIPMENT (KILOTON) (2020-2027) 80
TABLE 58 GLOBAL ALUMINUM MARKET FOR CONSUMER GOODS (USD MILLION) (2020-2027) 81
TABLE 59 GLOBAL ALUMINUM MARKET FOR CONSUMER GOODS (KILOTON) (2020-2027) 81
TABLE 60 GLOBAL ALUMINUM MARKET FOR CONSUMER GOODS (USD MILLION) (2020-2027) 82
TABLE 61 GLOBAL ALUMINUM MARKET FOR CONSUMER GOODS (KILOTON) (2020-2027) 82
TABLE 62 GLOBAL ALUMINUM MARKET FOR UTENSILS (USD MILLION) (2020-2027) 83
TABLE 63 GLOBAL ALUMINUM MARKET FOR UTENSILS (KILOTON) (2020-2027) 83
TABLE 64 GLOBAL ALUMINUM MARKET FOR HARDWARE & ACCESSORIES (USD MILLION) (2020-2027) 84
TABLE 65 GLOBAL ALUMINUM MARKET FOR HARDWARE & ACCESSORIES (KILOTON) (2020-2027) 84
TABLE 66 GLOBAL ALUMINUM MARKET FOR OTHERS (USD MILLION) (2020-2027) 85
TABLE 67 GLOBAL ALUMINUM MARKET FOR OTHERS (KILOTON) (2020-2027) 85
TABLE 68 GLOBAL ALUMINUM MARKET BY REGION (USD MILLION) (2020-2027) 87
TABLE 69 GLOBAL ALUMINUM MARKET BY REGION (KILOTON) (2020-2027) 88
TABLE 70 NORTH AMERICA ALUMINUM MARKET BY COUNTRY (USD MILLION) (2020-2027) 89
TABLE 71 NORTH AMERICA ALUMINUM MARKET BY COUNTRY (KILOTON) (2020-2027) 89
TABLE 72 NORTH AMERICA ALUMINUM MARKET BY TYPE (USD MILLION) (2020-2027) 89
TABLE 73 NORTH AMERICA ALUMINUM MARKET BY TYPE (KILOTON) (2020-2027) 90
TABLE 74 NORTH AMERICA ALUMINUM MARKET BY PRODUCT (USD MILLION) (2020-2027) 90
TABLE 75 NORTH MAERICA ALUMINUM MARKET BY PRODUCT (KILOTON) (2020-2027) 91
TABLE 76 NORTH MAERICA ALUMINUM MARKET BY APPLICATION (USD MILLION) (2020-2027) 92
TABLE 77 NORTH MAERICA ALUMINUM MARKET BY APPLICATION (KILOTON) (2020-2027) 93
TABLE 78 U.S. ALUMINUM MARKET BY TYPE (USD MILLION) (2020-2027) 93
TABLE 79 U.S. ALUMINUM MARKET BY TYPE (KILOTON) (2020-2027) 94
TABLE 80 U.S. ALUMINUM MARKET BY PRODUCT (USD MILLION) (2020-2027) 94
TABLE 81 U.S. ALUMINUM MARKET BY PRODUCT (KILOTON) (2020-2027) 95
TABLE 82 U.S. ALUMINUM MARKET BY APPLICATION (USD MILLION) (2020-2027) 96
TABLE 83 U.S. ALUMINUM MARKET BY APPLICATION (KILOTON) (2020-2027) 97
TABLE 84 CANADA ALUMINUM MARKET BY TYPE (USD MILLION) (2020-2027) 97
TABLE 85 CANADA ALUMINUM MARKET BY TYPE (KILOTON) (2020-2027) 98
TABLE 86 CANADA ALUMINUM MARKET BY PRODUCT (USD MILLION) (2020-2027) 98
TABLE 87 CANADA ALUMINUM MARKET BY PRODUCT (KILOTON) (2020-2027) 99
TABLE 88 CANADA ALUMINUM MARKET BY APPLICATION (USD MILLION) (2020-2027) 100
TABLE 89 CANADA ALUMINUM MARKET BY APPLICATION (KILOTON) (2020-2027) 101
TABLE 90 EUROPE ALUMINUM MARKET BY COUNTRY (USD MILLION) (2020-2027) 101
TABLE 91 EUROPE ALUMINUM MARKET BY COUNTRY (KILOTON) (2020-2027) 102
TABLE 92 EUROPE ALUMINUM MARKET BY TYPE (USD MILLION) (2020-2027) 102
TABLE 93 EUROPE ALUMINUM MARKET BY TYPE (KILOTON) (2020-2027) 103
TABLE 94 EUROPE ALUMINUM MARKET BY PRODUCT (USD MILLION) (2020-2027) 103
TABLE 95 EUROPE ALUMINUM MARKET BY PRODUCT (KILOTON) (2020-2027) 104
TABLE 96 EUROPE ALUMINUM MARKET BY APPLICATION (USD MILLION) (2020-2027) 105
TABLE 97 EUROPE ALUMINUM MARKET BY APPLICATION (KILOTON) (2020-2027) 106
TABLE 98 GERMANY ALUMINUM MARKET BY TYPE (USD MILLION) (2020-2027) 106
TABLE 99 GERMANY ALUMINUM MARKET BY TYPE (KILOTON) (2020-2027) 107
TABLE 100 GERMANY ALUMINUM MARKET BY PRODUCT (USD MILLION) (2020-2027) 107
TABLE 101 GERMANY ALUMINUM MARKET BY PRODUCT (KILOTON) (2020-2027) 108
TABLE 102 GERMANY ALUMINUM MARKET BY APPLICATION (USD MILLION) (2020-2027) 109
TABLE 103 GERMANY ALUMINUM MARKET BY APPLICATION (KILOTON) (2020-2027) 110
TABLE 104 FRANCE ALUMINUM MARKET BY TYPE (USD MILLION) (2020-2027) 110
TABLE 105 KFRANCE ALUMINUM MARKET BY TYPE (KILOTON) (2020-2027) 111
TABLE 106 FRANCE ALUMINUM MARKET BY PRODUCT (USD MILLION) (2020-2027) 111
TABLE 107 FRANCE ALUMINUM MARKET BY PRODUCT (KILOTON) (2020-2027) 112
TABLE 108 FRANCE ALUMINUM MARKET BY APPLICATION (USD MILLION) (2020-2027) 113
TABLE 109 FRANCE ALUMINUM MARKET BY APPLICATION (KILOTON) (2020-2027) 114
TABLE 110 UK ALUMINUM MARKET BY TYPE (USD MILLION) (2020-2027) 114
TABLE 111 UK ALUMINUM MARKET BY TYPE (KILOTON) (2020-2027) 115
TABLE 112 UK ALUMINUM MARKET BY PRODUCT (USD MILLION) (2020-2027) 115
TABLE 113 UK ALUMINUM MARKET BY PRODUCT (KILOTON) (2020-2027) 116
TABLE 114 UK ALUMINUM MARKET BY APPLICATION (USD MILLION) (2020-2027) 117
TABLE 115 UK ALUMINUM MARKET BY APPLICATION (KILOTON) (2020-2027) 118
TABLE 116 SPAIN ALUMINUM MARKET BY TYPE (USD MILLION) (2020-2027) 118
TABLE 117 SPAIN ALUMINUM MARKET BY TYPE (KILOTON) (2020-2027) 119
TABLE 118 SPAIN ALUMINUM MARKET BY PRODUCT (USD MILLION) (2020-2027) 119
TABLE 119 SPAIN ALUMINUM MARKET BY PRODUCT (KILOTON) (2020-2027) 120
TABLE 120 SPAIN ALUMINUM MARKET BY APPLICATION (USD MILLION) (2020-2027) 121
TABLE 121 SPAIN ALUMINUM MARKET BY APPLICATION (KILOTON) (2020-2027) 122
TABLE 122 ITALY ALUMINUM MARKET BY TYPE (USD MILLION) (2020-2027) 122
TABLE 123 ITALY ALUMINUM MARKET BY TYPE (KILOTON) (2020-2027) 123
TABLE 124 ITALY ALUMINUM MARKET BY PRODUCT (USD MILLION) (2020-2027) 123
TABLE 125 ITALY ALUMINUM MARKET BY PRODUCT (KILOTON) (2020-2027) 124
TABLE 126 ITALY ALUMINUM MARKET BY APPLICATION (USD MILLION) (2020-2027) 125
TABLE 127 ITALY ALUMINUM MARKET BY APPLICATION (KILOTON) (2020-2027) 126
TABLE 128 RUSSIA ALUMINUM MARKET BY TYPE (USD MILLION) (2020-2027) 126
TABLE 129 RUSSIA ALUMINUM MARKET BY TYPE (KILOTON) (2020-2027) 127
TABLE 130 RUSSIA ALUMINUM MARKET BY PRODUCT (USD MILLION) (2020-2027) 127
TABLE 131 RUSSIA ALUMINUM MARKET BY PRODUCT (KILOTON) (2020-2027) 128
TABLE 132 RUSSIA ALUMINUM MARKET BY APPLICATION (USD MILLION) (2020-2027) 129
TABLE 133 RUSSIA ALUMINUM MARKET BY APPLICATION (KILOTON) (2020-2027) 130
TABLE 134 BENELUX ALUMINUM MARKET BY TYPE (USD MILLION) (2020-2027) 130
TABLE 135 BENELUX ALUMINUM MARKET BY TYPE (KILOTON) (2020-2027) 131
TABLE 136 BENELUX ALUMINUM MARKET BY PRODUCT (USD MILLION) (2020-2027) 131
TABLE 137 BENELUX ALUMINUM MARKET BY PRODUCT (KILOTON) (2020-2027) 132
TABLE 138 BENELUX ALUMINUM MARKET BY APPLICATION (USD MILLION) (2020-2027) 133
TABLE 139 BENELUX ALUMINUM MARKET BY APPLICATION (KILOTON) (2020-2027) 134
TABLE 140 REST OF THE EUROPE ALUMINUM MARKET BY TYPE (USD MILLION) (2020-2027) 134
TABLE 141 REST OF THE EUROPE ALUMINUM MARKET BY TYPE (KILOTON) (2020-2027) 135
TABLE 142 REST OF THE EUROPE ALUMINUM MARKET BY PRODUCT (USD MILLION) (2020-2027) 135
TABLE 143 REST OF THE EUROPE ALUMINUM MARKET BY PRODUCT (KILOTON) (2020-2027) 136
TABLE 144 REST OF THE EUROPE ALUMINUM MARKET BY APPLICATION (USD MILLION) (2020-2027) 137
TABLE 145 REST OF THE EUROPE ALUMINUM MARKET BY APPLICATION (KILOTON) (2020-2027) 138
TABLE 146 ASIA-PACIFIC ALUMINUM MARKET BY COUNTRY (USD MILLION) (2020-2027) 138
TABLE 147 ASIA-PACIFIC ALUMINUM MARKET BY COUNTRY (KILOTON) (2020-2027) 139
TABLE 148 ASIA-PACIFIC ALUMINUM MARKET BY TYPE (USD MILLION) (2020-2027) 139
TABLE 149 ASIA-PACIFIC ALUMINUM MARKET BY TYPE (KILOTON) (2020-2027) 140
TABLE 150 ASIA-PACIFIC ALUMINUM MARKET BY PRODUCT (USD MILLION) (2020-2027) 140
TABLE 151 ASIA-PACIFIC ALUMINUM MARKET BY PRODUCT (KILOTON) (2020-2027) 141
TABLE 152 ASIA-PACIFIC ALUMINUM MARKET BY APPLICATION (USD MILLION) (2020-2027) 142
TABLE 153 ASIA-PACIFIC ALUMINUM MARKET BY APPLICATION (KILOTON) (2020-2027) 143
TABLE 154 CHINA ALUMINUM MARKET BY TYPE (USD MILLION) (2020-2027) 143
TABLE 155 CHINA ALUMINUM MARKET BY TYPE (KILOTON) (2020-2027) 144
TABLE 156 CHINA ALUMINUM MARKET BY PRODUCT (USD MILLION) (2020-2027) 144
TABLE 157 CHINA ALUMINUM MARKET BY PRODUCT (KILOTON) (2020-2027) 145
TABLE 158 CHINA ALUMINUM MARKET BY APPLICATION (USD MILLION) (2020-2027) 146
TABLE 159 CHINA ALUMINUM MARKET BY APPLICATION (KILOTON) (2020-2027) 147
TABLE 160 JAPAN ALUMINUM MARKET BY TYPE (USD MILLION) (2020-2027) 147
TABLE 161 JAPAN ALUMINUM MARKET BY TYPE (KILOTON) (2020-2027) 148
TABLE 162 JAPAN ALUMINUM MARKET BY PRODUCT (USD MILLION) (2020-2027) 148
TABLE 163 JAPAN ALUMINUM MARKET BY PRODUCT (KILOTON) (2020-2027) 149
TABLE 164 JAPAN ALUMINUM MARKET BY APPLICATION (USD MILLION) (2020-2027) 150
TABLE 165 JAPAN ALUMINUM MARKET BY APPLICATION (KILOTON) (2020-2027) 151
TABLE 166 INDIA ALUMINUM MARKET BY TYPE (USD MILLION) (2020-2027) 151
TABLE 167 INDIA ALUMINUM MARKET BY TYPE (KILOTON) (2020-2027) 152
TABLE 168 INDIA ALUMINUM MARKET BY PRODUCT (USD MILLION) (2020-2027) 152
TABLE 169 INDIA ALUMINUM MARKET BY PRODUCT (KILOTON) (2020-2027) 153
TABLE 170 INDIA ALUMINUM MARKET BY APPLICATION (USD MILLION) (2020-2027) 154
TABLE 171 INDIA ALUMINUM MARKET BY APPLICATION (KILOTON) (2020-2027) 155
TABLE 172 SOUTH KOREA ALUMINUM MARKET BY TYPE (USD MILLION) (2020-2027) 155
TABLE 173 SOUTH KOREA ALUMINUM MARKET BY TYPE (KILOTON) (2020-2027) 156
TABLE 174 SOUTH KOREA ALUMINUM MARKET BY PRODUCT (USD MILLION) (2020-2027) 156
TABLE 175 SOUTH KOREA ALUMINUM MARKET BY PRODUCT (KILOTON) (2020-2027) 157
TABLE 176 SOUTH KOREA ALUMINUM MARKET BY APPLICATION (USD MILLION) (2020-2027) 158
TABLE 177 SOUTH KOREA ALUMINUM MARKET BY APPLICATION (KILOTON) (2020-2027) 159
TABLE 178 INDONESIA ALUMINUM MARKET BY TYPE (USD MILLION) (2020-2027) 159
TABLE 179 INDONESIA ALUMINUM MARKET BY TYPE (KILOTON) (2020-2027) 160
TABLE 180 INDONESIA ALUMINUM MARKET BY PRODUCT (USD MILLION) (2020-2027) 160
TABLE 181 INDONESIA ALUMINUM MARKET BY PRODUCT (KILOTON) (2020-2027) 161
TABLE 182 INDONESIA ALUMINUM MARKET BY APPLICATION (USD MILLION) (2020-2027) 162
TABLE 183 INDONESIA ALUMINUM MARKET BY APPLICATION (KILOTON) (2020-2027) 163
TABLE 184 AUSTRALIA & NEW ZEALAND ALUMINUM MARKET BY TYPE (USD MILLION) (2020-2027) 163
TABLE 185 AUSTRALIA & NEW ZEALAND ALUMINUM MARKET BY TYPE (KILOTON) (2020-2027) 164
TABLE 186 AUSTRALIA & NEW ZEALAND ALUMINUM MARKET BY PRODUCT (USD MILLION) (2020-2027) 164
TABLE 187 AUSTRALIA & NEW ZEALAND ALUMINUM MARKET BY PRODUCT (KILOTON) (2020-2027) 165
TABLE 188 AUSTRALIA & NEW ZEALAND ALUMINUM MARKET BY APPLICATION (USD MILLION) (2020-2027) 166
TABLE 189 AUSTRALIA & NEW ZEALAND ALUMINUM MARKET BY APPLICATION (KILOTON) (2020-2027) 167
TABLE 190 REST OF THE ASIA-PACIFIC ALUMINUM MARKET BY TYPE (USD MILLION) (2020-2027) 167
TABLE 191 REST OF THE ASIA-PACIFIC ALUMINUM MARKET BY TYPE (KILOTON) (2020-2027) 168
TABLE 192 REST OF THE ASIA-PACIFIC ALUMINUM MARKET BY PRODUCT (USD MILLION) (2020-2027) 168
TABLE 193 REST OF THE ASIA-PACIFIC ALUMINUM MARKET BY PRODUCT (KILOTON) (2020-2027) 169
TABLE 194 REST OF THE ASIA-PACIFIC ALUMINUM MARKET BY APPLICATION (USD MILLION) (2020-2027) 170
TABLE 195 REST OF THE ASIA-PACIFIC ALUMINUM MARKET BY APPLICATION (KILOTON) (2020-2027) 171
TABLE 196 MIDDLE EAST & AFRICA ALUMINUM MARKET BY COUNTRY (USD MILLION) (2020-2027) 171
TABLE 197 MIDDLE EAST & AFRICA ALUMINUM MARKET BY COUNTRY (KILOTON) (2020-2027) 172
TABLE 198 MIDDLE EAST & AFRICA ALUMINUM MARKET BY TYPE (USD MILLION) (2020-2027) 172
TABLE 199 MIDDLE EAST & AFRICA ALUMINUM MARKET BY TYPE (KILOTON) (2020-2027) 172
TABLE 200 MIDDLE EAST & AFRICA ALUMINUM MARKET BY PRODUCT (USD MILLION) (2020-2027) 173
TABLE 201 MIDDLE EAST & AFRICA ALUMINUM MARKET BY PRODUCT (KILOTON) (2020-2027) 174
TABLE 202 MIDDLE EAST & AFRICA ALUMINUM MARKET BY APPLICATION (USD MILLION) (2020-2027) 175
TABLE 203 MIDDLE EAST & AFRICA ALUMINUM MARKET BY APPLICATION (KILOTON) (2020-2027) 176
TABLE 204 GCC ALUMINUM MARKET BY TYPE (USD MILLION) (2020-2027) 176
TABLE 205 GCC ALUMINUM MARKET BY TYPE (KILOTON) (2020-2027) 177
TABLE 206 GCC ALUMINUM MARKET BY PRODUCT (USD MILLION) (2020-2027) 177
TABLE 207 GCC ALUMINUM MARKET BY PRODUCT (KILOTON) (2020-2027) 178
TABLE 208 GCC ALUMINUM MARKET BY APPLICATION (USD MILLION) (2020-2027) 179
TABLE 209 GCC ALUMINUM MARKET BY APPLICATION (KILOTON) (2020-2027) 180
TABLE 210 TURKEY ALUMINUM MARKET BY TYPE (USD MILLION) (2020-2027) 180
TABLE 211 TURKEY ALUMINUM MARKET BY TYPE (KILOTON) (2020-2027) 181
TABLE 212 TURKEY ALUMINUM MARKET BY PRODUCT (USD MILLION) (2020-2027) 181
TABLE 213 TURKEY ALUMINUM MARKET BY PRODUCT (KILOTON) (2020-2027) 182
TABLE 214 TURKEY ALUMINUM MARKET BY APPLICATION (USD MILLION) (2020-2027) 183
TABLE 215 TURKEY ALUMINUM MARKET BY APPLICATION (KILOTON) (2020-2027) 184
TABLE 216 SOUTH AFRICA ALUMINUM MARKET BY TYPE (USD MILLION) (2020-2027) 184
TABLE 217 SOUTH AFRICA ALUMINUM MARKET BY TYPE (KILOTON) (2020-2027) 185
TABLE 218 SOUTH AFRICA ALUMINUM MARKET BY PRODUCT (USD MILLION) (2020-2027) 185
TABLE 219 SOUTH AFRICA ALUMINUM MARKET BY PRODUCT (KILOTON) (2020-2027) 186
TABLE 220 SOUTH AFRICA ALUMINUM MARKET BY APPLICATION (USD MILLION) (2020-2027) 187
TABLE 221 SOUTH AFRICA ALUMINUM MARKET BY APPLICATION (KILOTON) (2020-2027) 188
TABLE 222 REST OF THE MIDDLE EAST & AFRICA ALUMINUM MARKET BY TYPE (USD MILLION) (2020-2027) 188
TABLE 223 REST OF THE MIDDLE EAST & AFRICA ALUMINUM MARKET BY TYPE (KILOTON) (2020-2027) 189
TABLE 224 REST OF THE MIDDLE EAST & AFRICA ALUMINUM MARKET BY PRODUCT (USD MILLION) (2020-2027) 189
TABLE 225 REST OF THE MIDDLE EAST & AFRICA ALUMINUM MARKET BY PRODUCT (KILOTON) (2020-2027) 190
TABLE 226 REST OF THE MIDDLE EAST & AFRICA ALUMINUM MARKET BY APPLICATION (USD MILLION) (2020-2027) 191
TABLE 227 REST OF THE MIDDLE EAST & AFRICA ALUMINUM MARKET BY APPLICATION (KILOTON) (2020-2027 192
TABLE 228 LATIN AMERICA ALUMINUM MARKET BY COUNTRY (USD MILLION) (2020-2027) 192
TABLE 229 LATIN AMERICA ALUMINUM MARKET BY COUNTRY (KILOTON) (2020-2027) 193
TABLE 230 LATIN AMERICA ALUMINUM MARKET BY TYPE (USD MILLION) (2020-2027) 193
TABLE 231 LATIN AMERICA ALUMINUM MARKET BY TYPE (KILOTON) (2020-2027) 193
TABLE 232 LATIN AMERICA ALUMINUM MARKET BY PRODUCT (USD MILLION) (2020-2027) 194
TABLE 233 LATIN AMERICA ALUMINUM MARKET BY PRODUCT (KILOTON) (2020-2027) 195
TABLE 234 LATIN AMERICA ALUMINUM MARKET BY APPLICATION (USD MILLION) (2020-2027) 196
TABLE 235 LATIN AMERICA ALUMINUM MARKET BY APPLICATION (KILOTON) (2020-2027) 197
TABLE 236 MEXICO ALUMINUM MARKET BY TYPE (USD MILLION) (2020-2027) 197
TABLE 237 MEXICO ALUMINUM MARKET BY TYPE (KILOTON) (2020-2027) 198
TABLE 238 MEXICO ALUMINUM MARKET BY PRODUCT (USD MILLION) (2020-2027) 198
TABLE 239 MEXICO ALUMINUM MARKET BY PRODUCT (KILOTON) (2020-2027) 199
TABLE 240 MEXICO ALUMINUM MARKET BY APPLICATION (USD MILLION) (2020-2027) 200
TABLE 241 MEXICO ALUMINUM MARKET BY APPLICATION (KILOTON) (2020-2027) 201
TABLE 242 BRAZIL ALUMINUM MARKET BY TYPE (USD MILLION) (2020-2027) 201
TABLE 243 BRAZIL ALUMINUM MARKET BY TYPE (KILOTON) (2020-2027) 202
TABLE 244 BRAZIL ALUMINUM MARKET BY PRODUCT (USD MILLION) (2020-2027) 202
TABLE 245 BRAZIL ALUMINUM MARKET BY PRODUCT (KILOTON) (2020-2027) 203
TABLE 246 BRAZIL ALUMINUM MARKET BY APPLICATION (USD MILLION) (2020-2027) 204
TABLE 247 BRAZIL ALUMINUM MARKET BY APPLICATION (KILOTON) (2020-2027) 205
TABLE 248 ARGENTINA ALUMINUM MARKET BY TYPE (USD MILLION) (2020-2027) 205
TABLE 249 ARGENTINA ALUMINUM MARKET BY TYPE (KILOTON) (2020-2027) 206
TABLE 250 ARGENTINA ALUMINUM MARKET BY PRODUCT (USD MILLION) (2020-2027) 206
TABLE 251 ARGENTINA ALUMINUM MARKET BY PRODUCT (KILOTON) (2020-2027) 207
TABLE 252 ARGENTINA ALUMINUM MARKET BY APPLICATION (USD MILLION) (2020-2027) 208
TABLE 253 ARGENTINA ALUMINUM MARKET BY APPLICATION (KILOTON) (2020-2027) 209
TABLE 254 REST OF THE LATIN AMERICA ALUMINUM MARKET BY TYPE (USD MILLION) (2020-2027) 209
TABLE 255 REST OF THE LATIN AMERICA ALUMINUM MARKET BY TYPE (KILOTON) (2020-2027) 210
TABLE 256 REST OF THE LATIN AMERICA ALUMINUM MARKET BY PRODUCT (USD MILLION) (2020-2027) 210
TABLE 257 REST OF THE LATIN AMERICA ALUMINUM MARKET BY PRODUCT (KILOTON) (2020-2027) 211
TABLE 258 REST OF THE LATIN AMERICA ALUMINUM MARKET BY APPLICATION (USD MILLION) (2020-2027) 212
TABLE 259 REST OF THE LATIN AMERICA ALUMINUM MARKET BY APPLICATION (KILOTON) (2020-2027) 213
TABLE 260 GLOBAL ALUMINUM MARKET FOR RECYCLED TYPE, 2020-2027 (USD MILLION) 215
TABLE 261 GLOBAL ALUMINUM MARKET FOR RECYCLED TYPE, 2020-2027 (KILOTON) 215
TABLE 262 GLOBAL RECYCLED ALUMINUM MARKET FOR PRODUCT, 2020-2027 (USD MILLION) 216
TABLE 263 GLOBAL RECYCLED ALUMINUM MARKET FOR PRODUCT, 2020-2027 (KILOTON) 217
TABLE 264 GLOBAL RECYCLED ALUMINUM MARKET FOR APPLICATION, 2020-2027 (USD MILLION) 218
TABLE 265 GLOBAL RECYCLED ALUMINUM MARKET FOR APPLICATION, 2020-2027 (KILOTON) 218
TABLE 266 MAJOR STAKEHOLDERS IN RECYCLING ALUMINUM INDUSTRY 220
TABLE 267 RECYCLED ALUMINUM: LEADING APPLICATION SHARE (2020) 221
TABLE 268 GLOBAL LEGISLATIVE FRAMEWORK FOR ALUMINUM INDUSTRY 223
TABLE 269 GLOBAL HIGH-END ALUMINUM ALLOYS MARKET BY COUNTRY (USD MILLION) (2020-2027) 226
TABLE 270 GLOBAL HIGH-END ALUMINUM ALLOYS MARKET BY COUNTRY (KILOTON) (2020-2027) 226
TABLE 271 GLOBAL HIGH-END ALUMINUM ALLOYS MARKET FOR AEROSPACE & DEFENCE (USD MILLION) (2020-2027) 227
TABLE 272 GLOBAL HIGH-END ALUMINUM ALLOYS MARKET FOR AEROSPACE & DEFENCE (KILOTON) (2020-2027) 227
TABLE 273 GLOBAL HIGH-END ALUMINUM ALLOYS MARKET FOR CONSTRUCTION (USD MILLION) (2020-2027) 228
TABLE 274 GLOBAL HIGH-END ALUMINUM ALLOYS MARKET FOR CONSTRUCTION (KILOTON) (2020-2027) 228
TABLE 275 GLOBAL HIGH-END ALUMINUM ALLOYS MARKET FOR RAILWAYS (USD MILLION) (2020-2027) 229
TABLE 276 GLOBAL HIGH-END ALUMINUM ALLOYS MARKET RAILWAYS (KILOTON) (2020-2027) 229
TABLE 277 GLOBAL HIGH-END ALUMINUM ALLOYS MARKET FOR SPACECRAFTS (USD MILLION) (2020-2027) 230
TABLE 278 GLOBAL HIGH-END ALUMINUM ALLOYS MARKET FOR SPACECRAFTS (KILOTON) (2020-2027) 230
TABLE 279 GLOBAL HIGH-END ALUMINUM ALLOYS MARKET FOR ELECTRICAL (USD MILLION) (2020-2027) 231
TABLE 280 GLOBAL HIGH-END ALUMINUM ALLOYS MARKET FOR ELECTRICAL (KILOTON) (2020-2027) 231
TABLE 281 GLOBAL HIGH-END ALUMINUM ALLOYS MARKET FOR OTHERS (USD MILLION) (2020-2027) 232
TABLE 282 GLOBAL HIGH-END ALUMINUM ALLOYS MARKET FOR OTHERS (KILOTON) (2020-2027) 232
TABLE 283 KEY DEVELOPMENTS 234
TABLE 284 INDIA ALUMINIUM PRODUCTION CAPACITY, BY MANUFACTURERS (2020) 235
TABLE 285 KEY DEVELOPMENTS 238
18 List Of Figures
FIGURE 1 GLOBAL ALUMINUM MARKET: MARKET STRUCTURE 26
FIGURE 2 KEY TAKEAWAYS OF THE ALUMINUM MARKET 26
FIGURE 3 NORTH AMERICA MARKET SIZE & MARKET SHARE BY COUNTRY (2020 VS 2027) 28
FIGURE 4 EUROPE MARKET SIZE & MARKET SHARE BY COUNTRY (2020 VS 2027) 28
FIGURE 5 ASIA-PACIFIC & MARKET SHARE BY COUNTRY (2020 VS 2027) 29
FIGURE 6 SOUTH AMERICA MARKET SIZE & MARKET SHARE BY COUNTRY (2020 VS 2027) 29
FIGURE 7 MIDDLE EAST & AFRICA MARKET SIZE & MARKET SHARE BY COUNTRY (2020 VS 2027) 30
FIGURE 8 ALUMINUM MARKET, BY REGION, 2020 30
FIGURE 9 RESEARCH PROCESS OF MRFR 32
FIGURE 10 TOP DOWN & BOTTOM UP APPROACHES 35
FIGURE 11 MARKET DYNAMICS OVERVIEW 37
FIGURE 12 DRIVERS IMPACT ANALYSIS 39
FIGURE 13 RESTRAINTS IMPACT ANALYSIS 40
FIGURE 14 SUPPLY CHAIN ANALYSIS 41
FIGURE 15 PORTER'S FIVE FORCES ANALYSIS OF THE GLOBAL ALUMINUM MARKET 42
FIGURE 16 GLOBAL ALUMINUM MARKET BY TYPE (USD MILLION) (2020-2027) 47
FIGURE 17 GLOBAL ALUMINUM MARKET BY TYPE (KILOTON) (2020-2027) 48
FIGURE 18 GLOBAL ALUMINUM MARKET BY PRODUCT (USD MILLION) (2020-2027) 52
FIGURE 19 GLOBAL ALUMINUM MARKET BY PRODUCT (KILOTON) (2020-2027) 54
FIGURE 20 GLOBAL ALUMINUM MARKET BY APPLICATION (USD MILLION) (2020-2027) 74
FIGURE 21 GLOBAL ALUMINUM MARKET BY APPLICATION (KILOTON) (2020-2027) 75
FIGURE 22 GLOBAL ALUMINUM MARKET BY REGION (USD MILLION) (2020-2027) 87
FIGURE 23 GLOBAL ALUMINUM MARKET BY REGION (KILOTON) (2020-2027) 88
FIGURE 24 GLOBAL SPENDING ON THE CONSTRUCTION INDUSTRY, (2020-2027) 222
FIGURE 25 WORLD PRIMARY ALUMINUM MARKET BALANCE VS LONDON METAL EXCHANGE CASH PRICES
(MILLION TON VS $ M/TON; ANNUAL VS MONTHLY DATA) 241
FIGURE 26 PRIMARY ALUMINUM CASH COST OF PRODUCTION 242
FIGURE 27 CHINESE PRIMARY ALUMINIUM SMELTER PRODUCTION CASH COST* AND CAPACITY 242
$242.65 billion
5.76%%
Asia Pacific
2021 - 2030
Aluminum Market Overview
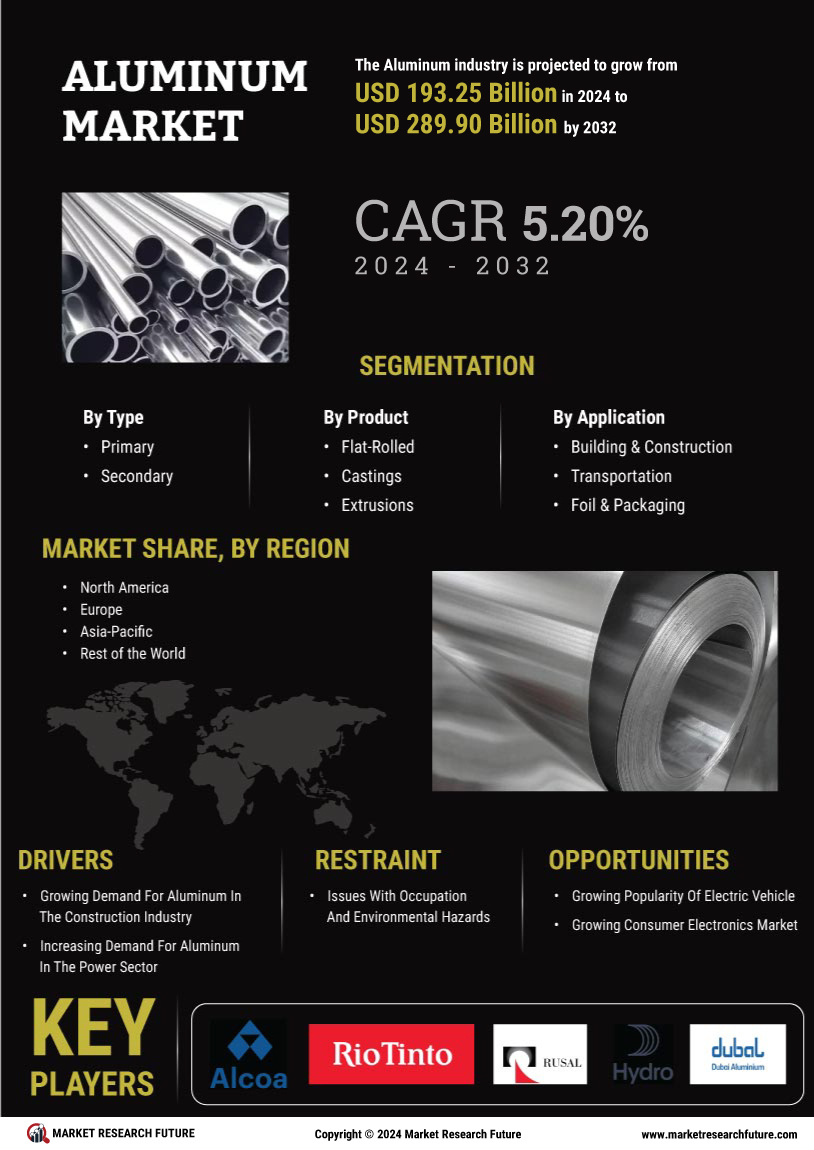
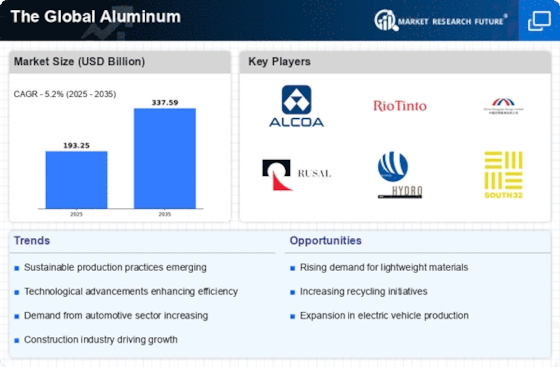
The aluminum market demand forecast is anticipated to show a 6.5% CAGR growth throughout the forecast period and touch a revenue estimate of USD 235.8 Billion by 2025.
Companies in many industries use aluminum in a wide range of manufacturing processes. Some of these industries include automotive, electrical and electronics, building and construction, and aerospace. Aluminum is a strong and durable metal with a high tensile point. It’s also flexible and lightweight. Unlike as is the case with other metals aluminum won’t rust or corrode easily.
COVID-19 is to the 21st century what the Bubonic Plague was to the 5th century and the Black Death was to the 14th century - a real game and destiny changer. COVID-19 is as dangerous as the bacteria that caused the Bubonic Plague and Black Death.
Governments around the world realized that COVID-19 was dangerous early on. The stats and evidence spoke the truth. Some people who got this virus had to be hospitalized because of breathing problems. A small minority of these people even died.
Governments around the world decided to contain the spread of the virus by imposing quarantines and lockdowns. Many companies and industries were adversely affected though since they were forced to either shut operations down temporarily or dramatically scale production back.
Fortunately, the global aluminum industry has not had to deal with this. The industry has been expanding rapidly, largely because aluminum is used to make breathing apparatuses in ventilators. There has been a dramatic rise in the number of ventilators that are being used because of COVID-19.
The global aluminum industry is very competitive. It’s also highly fragmented. The large concentration of companies of all sizes is attributing to this. Companies are finding that they can stay competitive if they invest heavily in research and development. This will allow them to develop and market newer and better aluminum products. Incidentally, they can justify charging more for these products if they market them well.
Companies are also finding that merging with and acquiring other successful companies is highly beneficial because it allows the resulting companies to tap into resources that they never had before. The same applies to knowledge. The resulting companies find that they have no trouble entering new markets. They are also able to do a much better job of solidifying their positions in existing markets.
The same that applies for mergers and acquisitions also applies when companies enter into strategic partnerships with other successful companies. Companies can justify charging more for new products that are better and were developed through more intensive investments in research and development after they merge with/acquire, and/or partner with other companies.
Alcoa Corporation is a major American player in the global aluminum industry. It has managed to cement its position by investing heavily in research and development. This allowed it to create the sustainable competitive advantage that it needed to become one of the top industry leaders.
What’s been driving growth in the global aluminum industry has been the rapid increase in demand for this abundant base metal in China. Most industries in China belong to the government. Many of these industries are developing and growing rapidly. Hence, the need for more aluminum. Some of the sectors that use aluminum intensively in China include construction, packaging, transportation, and electrical. These four sectors combined consume about 60% of the total aluminum that the Chinese industry uses every year.
The government is working hard to make aluminum more accessible to Chinese industrialists. Its outcome will play a huge role in driving growth in the global aluminum industry.
Aluminum is strong, doesn’t melt or warp easily when subjected to hot temperatures, and is flexible. It’s also lightweight, doesn’t rust or corrode easily, and is an excellent conductor of heat and electricity.
Aluminum is relatively inexpensive and that’s why the global automotive industry is increasingly choosing to use it. Aluminum processors around the world realize this. That’s why they’re investing heavily in research and development to try to create newer generations of aluminum products that are superior in all of the above-mentioned qualities and have a much lower price point.
There are a few factors that are holding back growth in the global aluminum industry. One of these is the fact that mining and processing bauxite into aluminum is not environmentally friendly at all. Many processors of aluminum are addressing this fact by making and selling secondary aluminum. The trouble is that this could hold back growth in the aluminum market in both the short and long-term.
One of the biggest challenges that the global aluminum industry faces is decarbonization. Most companies in the aluminum industry are under immense pressure to make their processes greener. They can do this only if they use low-carbon steel which happens to be of inferior quality.
The CAGR for the global aluminum industry is 6.5%, The aluminum market value is projected to be USD 235.8 billion by 2025.
Alcoa Corporation is a major player in the global aluminum industry. It solidified this position and became one of the industry leaders by investing heavily in research and development. This allowed it to develop a new generation of aluminum products that were superior and had a lower price point. Alcoa was also able to create a sustainable competitive advantage by doing this.
The global aluminum industry can be grouped into the following sub-segments by type:
It’s the primary sub-segment that has most of the aluminum market share for this sector at 61.8% according to 2018 numbers. That said, the secondary aluminum sub-segment is expected to have a higher CAGR.
The global aluminum industry can be grouped into the following sub-segments based on product:
The extrusion sub-segment had the highest market share in 2018 while the flat-rolled sub-segment is projected to have the highest CAGR.
The building and construction industry had 30% of the overall aluminum market share in 2018. This industry is expected to have the highest CAGR for the time period that this report covers. The projected CAGR is 6.7%.
It’s a large growth in the building and construction industry in the European Union (in general), China, India, The Philippines, and Indonesia that’s driving demand and growth for the global aluminum industry.
Many developing nations are also investing heavily in terms of developing their infrastructure. Some of these countries include South Africa, India, China, the Philippines, and Indonesia. These nations are also developing at a rapid pace. More people around the world are driving motor vehicles so the growth in the global automotive industry is also expected to drive growth in the global aluminum industry.
The global aluminum industry can be divided into the following regions:
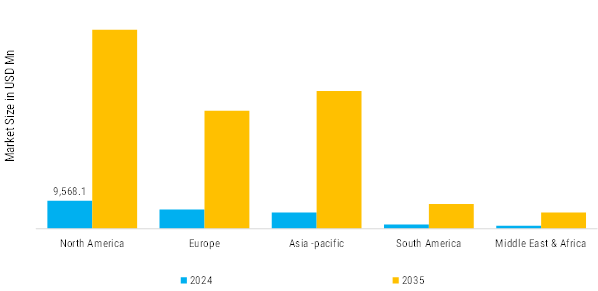
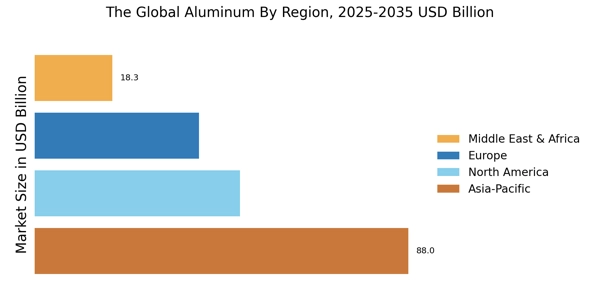
The Asia-Pacific region had the largest regional market share in 2018. It’s expected to have this edge for the entire time period that this report covers. China alone consumed 57% of the aluminum that the entire Asia-Pacific region used in 2018. The nation is expected to record an impressive CAGR of 7% in terms of aluminum consumption.
There are many factors that are accounting for this. They are rapid and vast industrialization, rapid and vast urbanization, increased investment and activity in the construction of buildings and infrastructure, and expansion in the automotive industry.
India itself is seeing respectable growth in terms of year-on-year aluminum consumption. What is accounting for this is an increase in automobile production and construction.
The demand for cars is going up dramatically in the European Union. In fact, it collectively has the second-highest aluminum market share. Many European nations are recovering economically. Their citizens are wanting to buy more automobiles as this happens.
The Middle East and North Africa are expected to register a CAGR of 6.5% until 2025. What’s driving this growth is rapid industrialization and increased investment in construction projects. Many Middle Eastern nations still have vast oil and gas reserves. This is expected to increase demand for aluminum dramatically.
Mexico and Brazil are investing heavily in their aerospace and automotive industries. It’s this activity that’s expected to drive demand and hence a relatively high CAGR for the entire region until 2025.Recent Developments
November 2021: Saturnose unveiled plans to commercialize a solid-state, rechargeable aluminum battery after releasing the results of independent testing of its Enhanced Altered Aluminum Ion (Ea2I) battery chemistry. When it launches next year, it is expected to be the world's first commercial-grade aluminum-ion solid-state battery, paving the way for a lengthy, sluggish transition away from the riskier lithium-ion battery chemistry.
November 2021: Rio Tinto invested USD 87 million in its AP60 smelter in the Saguenay-Lac-Saint-Jean area of Québec to expand its low-carbon aluminum production in Canada with 16 new smelting cells. The investment will boost smelter production by about 45 percent, or 26,500 metric tons of primary aluminum per year, to 86,500 metric tons. According to Rio Tinto, the global aluminum market will increase at a compound annual growth rate of 3.3 percent over the next decade, driven by robust demand from the energy transition and decarbonization.
Dec 2020 The current advances on the exterior inactivity of COVID, the Centre for Biomedical Technologies at Queensland University of Technology (CBT-QUT) has positively wet-etched a nanostructure with a breadth of 21-25 nm onto an aluminum 6063 alloy plane. This verified the idleness of COVID-19 in six hours on tough antiviral nanostructured surfaces. Cicada's Antimicrobial Nanotechnology Solution for COVID-Free Surfaces has given outstanding promise in sustaining public places safe from COVID-19 and is an excellent foundation for research should another pandemic happen in the future.
Report overview
Report Attribute/Metric | Details |
---|---|
Market Size |
|
CAGR | 6.5% (2022-2030) |
Base Year | 2021 |
Forecast Period | 2022 to 2030 |
Historical Data | 2019 & 2020 |
Forecast Units | Value (USD Billion) |
Report Coverage | Revenue Forecast, Competitive Landscape, Growth Factors, and Trends |
Segments Covered | By Type, Application and Region |
Geographies Covered | North America, Europe, Asia-Pacific, and Rest of the World (RoW) |
Key Vendors | Alcoa Corporation (U.S.), Rio Tinto (Australia),RUSAL (Russia),Norsk Hydro A.S.A. (Norway),Dubai Aluminum Company Limited (U.A.E),Aluminum Bahrain B.S.C. (Bahrain),Century Aluminum Company (U.S.),Vedanta Ltd. (India),China Aluminum Corporation (China),China Hongqiao (China),H.P. (Australia),East Hope Group (China),Emirates Global Aluminum (U.A.E.) |
Key Market Opportunities | Use Of Aluminum Die Cast Products In The Automotive Industry |
Key Market Drivers | Increasing Demand For Aluminum In China |
Frequently Asked Questions (FAQ) :
The aluminum market is predicted to grow at a 6.5% CAGR between 2017-2025.
The global aluminum market is predicted to touch USD 235.8 billion by 2025.
Asia-Pacific
Emirates Global Aluminum (UAE), East Hope Group (China), BHP (Australia), China Hongqiao (China), China Aluminum Corporation (China), Vedanta Ltd. (India), Century Aluminum Company (US), Aluminum Bahrain B.S.C. (Bahrain), Dubai Aluminum Company Limited (U.A.E), Norsk Hydro ASA (Norway), RUSAL (Russia), Rio Tinto (Australia), and Alcoa Corporation (US).
The availability of high-quality substitutes with a lower price point and the fact that commodities prices are always changing dramatically.