ID: MRFR/F-B & N/3308-HCR | February 2021 | Region: Global | 110 pages
Market Synopsis of Algae Products Market:
Market Definition:
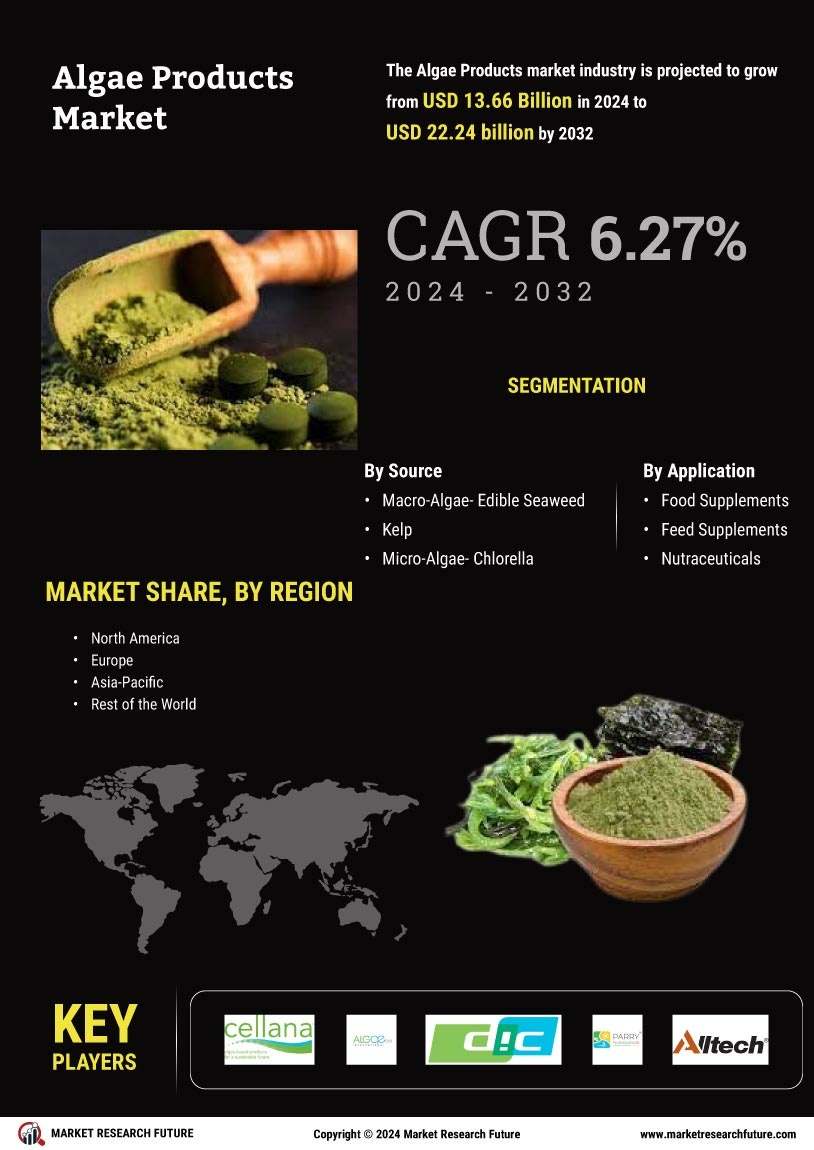
Algae is a group of organisms having potential of photosynthesis process. It converts carbon dioxide in the presence of sunlight into proteins and fats which can be utilized as food and fuel. Algae products are food or feed formulations prepared by macro or micro-algae. Commonly used algae in algae products comprise seaweed, kelp, chlorella, and spirulina. Due to high nutrient excellence, algae products have a potential application in the food and feed supplements, nutraceuticals, pharmaceuticals, and pollution control.
Market Scenario:
Algae products are rich in protein and contain essential amino acids, which help in boosting human metabolic process like enzyme production. Also, high content of Omega-3 and Omega-6 fatty acids in algae products makes it a good source of energy in food and feed. Thus, the demand for algae products is high from the food and feed industry.
Moreover, occurrence of key phyto-ingredients like beta-carotene, carotenoids, omega 3 fatty acids, and astaxanthin in algae products with supplementing health benefits is experiencing a high demand from food supplement manufacturers, pharmaceutical, and nutraceuticals industry. Furthermore, high demand for algae products in paints and colorants industry is adding up the growth of algae products market.
Intended Audience
Key Findings
Segments
Algae products are segmented on the basis of the source, which includes macro-algae, micro-algae, and others. The macro-algae segment is dominating the market. The macro-algae are cheap and involve less cost in growing. Furthermore, extraction of phyto-ingredients from macro-algae is relatively simple than micro-algae. However, micro-algae products are used in the nutraceuticals industry for the production of various products such as supplements and energy drinks, which is expected to grow rapidly during the forecasted period.On the basis of product application, the algae products market is segmented in food supplements, feed supplements, nutraceuticals, pharmaceuticals, pollution control, paints and colorants and others. The nutraceuticals are dominating the market because of rising health awareness. However, the demand for food supplements is expected to experience a high growth owing to health benefits associated with the consumption of algae products.
On the basis of the distribution channel, the market is segmented into store-based and non-store based distribution channel. However, the store-based distribution channel is dominating the market based on one-stop shopping experience.
Regional Analysis
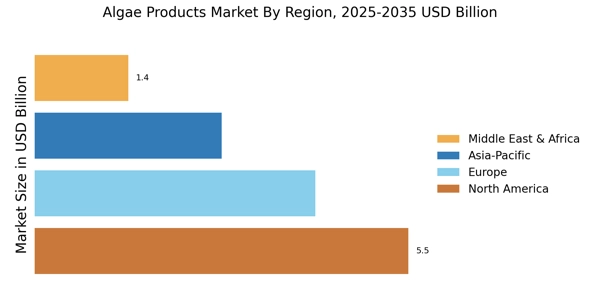
The global algae products market is segmented into North America, Europe, Asia Pacific, and rest of the world (RoW). Europe is dominating the in the algae products market followed by North America. Europe has been accounted for a higher consumption of algae products supplements and food products owing to increasing consumer awareness. Furthermore, high demand for algae in pharmaceutical and nutraceutical industry is considerd to be a key driving factor in this region.
Moreover, increasing consumer awareness and high demand for food and feed supplements from countries like India and China, a huge growth is anticipated in the algae products market in Asia Pacific region. Additionally, high focus on R&D in algae products for pollution control is observed, which is expected to encourage the growth of the global algae products market
Key Players
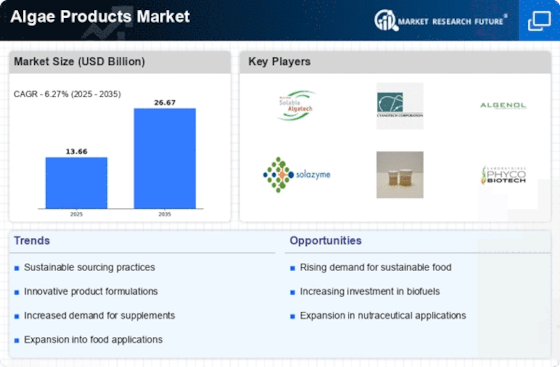
Some of the key players profiled in the global algae products market: Cellana Inc. (U.S.), Alltech, Inc. (U.S.), Algaetech International Sdn Bhd (Malaysia), Cyanotech Corporation (U.S.), DIC Lifetec Co. Ltd. (Japan), BlueBioTech GmbH (Germany), Parry Nutraceuticals Limited (India)
The global algae products market is segmented under the following regions
North America
Europe
Asia Pacific
Rest of the world
The report for Global Algae Products Market of Market Research Future comprises of extensive primary research along with the detailed analysis of qualitative as well as quantitative aspects by various industry experts, key opinion leaders to gain the deeper insight of the market and industry performance. The report gives the clear picture of current market scenario which includes historical and projected market size in terms of value and volume, technological advancement, macro economical and governing factors in the market. The report provides details information and strategies of the top key players in the industry. The report also gives a broad study of the different markets segments and regions.
Frequently Asked Questions (FAQ) :
Massive demand from the nutraceutical industry is the major driver of the global algae products market.
By ‘source’, macro-algae can dominate the global algae products market.
By ‘source’, the micro-algae segment can display a stellar growth rate from 2020 to 2027.
Europe can dominate the global algae products market till 2023 due to high consumption rate of nutraceuticals and food supplements.
DIC Lifetec Co. Ltd., Cellana Inc., Cyanotech Corporation, Algaetech International Sdn Bhd, Parry Nutraceuticals Limited, Alltech, Inc., and BlueBioTech GmbH are major players of the global algae products market.
Table of Content
Chapter 1. Methodology and Scope
1.1. Research Methodology
1.1.1 Initial Data Exploration
1.1.2 Statistical Modelling and Forecast
1.1.3 Industry Insights and Validation
1.2. Data Sources
Chapter 2. Executive Summary
2.1. Algae Products Industry Market Synopsis, 2020-2027
2.1.1 Business Trends
2.1.2 Product Source Trends
2.1.3 Product Application Trends
Chapter 3 Algae Products Market Insights
3.1 Industry Segmentation
3.2 Industry Size and Forecast
3.3 Industry Ecosystem Analysis
3.4 Industry Impact forces
3.4.1 Growth Drivers
3.4.1.1 Surge in the demand for algae products from nutraceuticals industry
3.4.1.2 Rising health awareness in the population
3.4.2 Industry Pitfalls & Challenges
3.4.2.1 Availability of cheap alternatives in the market
3.4.2.2 Increasing water pollution may deteriorate algae growth
3.5 Growth Potential Analysis
3.6 Company Market Share Analysis, 2020
3.7 Porter’s Analysis
3.8 PESTEL Analysis
Chapter 4 Algae Products by Source Insights
4.1 Global Algae Products Market Volume Share by Source, 2020-2027
4.1.1 Macro-algae
4.1.1.1 Edible Seaweeds
4.1.1.1.1 Market Estimates & Forecast, 2020-2027
4.1.1.2 Kelp
4.1.1.2.1 Market Estimates & Forecast, 2020-2027
4.1.2 Micro-algae
4.1.2.1 Chlorella
4.1.2.1.1 Market Estimates & Forecast, 2020-2027
4.1.2.2 Spirulina
4.1.2.2.1 Market Estimates & Forecast, 2020-2027
4.1.3 Others
4.1.3.1 Market Estimates & Forecast, 2020-2027
Chapter 5 Algae Products by Application Insights
5.1 Global Algae Products Market Volume Share by Application, 2020 & 2027
5.1.1 Food Supplements
5.1.1.1 Market Estimates & Forecast, 2020-2027
5.1.1.2 Market Estimates & Forecast by Region, 2020-2027
5.1.2 Feed Supplements
5.1.2.1 Market Estimates & Forecast, 2020-2027
5.1.2.2 Market Estimates & Forecast by Region, 2020-2027
5.1.3 Nutraceuticals
5.1.3.1 Market Estimates & Forecast, 2020-2027
5.1.3.2 Market Estimates & Forecast by Region, 2020-2027
5.1.4 Pharmaceuticals
5.1.4.1 Market Estimates & Forecast, 2020-2027
5.1.4.2 Market Estimates & Forecast by Region, 2020-2027
5.1.5 Pollution Control
5.1.5.1 Market Estimates & Forecast, 2020-2027
5.1.5.2 Market Estimates & Forecast by Region, 2020-2027
5.1.6 Paints and Colorants
5.1.6.1 Market Estimates & Forecast, 2020-2027
5.1.6.2 Market Estimates & Forecast by Region, 2020-2027
5.1.7 Others
5.1.7.1 Market Estimates & Forecast, 2020-2027
5.1.7.2 Market Estimates & Forecast by Region, 2020-2027
Chapter 6 Algae Products Distribution by Channel Insights
6.1 Global Algae Products Market Volume Share by Distribution Channel, 2020 & 2027
6.1.1 Store Based
6.1.1.1 Market Estimates & Forecast, 2020– 2027
6.1.1.2 Market Estimates & Forecast by Region, 2020- 2027
6.1.2 Non-Store Based
6.1.2.1 Market Estimates & Forecast, 2020 – 2027
6.1.2.2 Market Estimates & Forecast by Region, 2020 – 2027
Chapter 7 Algae Products Regional Insights
7.1 Algae Products Market Volume Share by Region, 2020 & 2027.
7.2 North America
7.2. A Market Estimates & Forecast, 2020-2027
7.2. B Market Estimates & Forecast, by Source, 2020-2027
7.2. C Market Estimates & Forecast, by Application, 2020-2027
7.2. D Market Estimates & Forecast, by Distribution Channel, 2020-2027
7.2.1 U.S.
7.2.1.1 Market Estimates & Forecast, 2020-2027
7.2.1.2 Market Estimates & Forecast, by Source, 2020-2027
7.2.1.3 Market Estimates & Forecast, by Application, 2020-2027
7.2.1.4 Market Estimates & Forecast, by Distribution Channel, 2020-2027
7.2.2 Canada
7.2.2.1 Market Estimates & Forecast, 2020-2027
7.2.2.2 Market Estimates & Forecast, by Source, 2020-2027
7.2.2.3 Market Estimates & Forecast, by Application, 2020-2027
7.2.2.4 Market Estimates & Forecast, by Distribution Channel, 2020-2027
7.2.3 Mexico
7.2.3.1 Market Estimates & Forecast, 2020-2027
7.2.3.2 Market Estimates & Forecast, by Source, 2020-2027
7.2.3.3 Market Estimates & Forecast, by Application, 2020-2027
7.2.3.4 Market Estimates & Forecast, by Distribution Channel, 2020-2027
7.3 Europe
7.3.1.1 Market Estimates & Forecast, 2020-2027
7.3.1.2 Market Estimates & Forecast, by Source, 2020-2027
7.3.1.3 Market Estimates & Forecast, by Application, 2020-2027
7.3.1.4 Market Estimates & Forecast, by Distribution Channel, 2020-2027
7.3.1 Germany
7.3.1.1 Market Estimates & Forecast, 2020-2027
7.3.1.2 Market Estimates & Forecast, by Source, 2020-2027
7.3.1.3 Market Estimates & Forecast, by Application, 2020-2027
7.3.1.4 Market Estimates & Forecast, by Distribution Channel, 2020-2027
7.3.2 UK
7.3.2.1 Market Estimates & Forecast, 2020-2027
7.3.2.2 Market Estimates & Forecast, by Source, 2020-2027
7.3.2.3 Market Estimates & Forecast, by Application, 2020-2027
7.3.2.4 Market Estimates & Forecast, by Distribution Channel, 2020-2027
7.3.3 France
7.3.3.1 Market Estimates & Forecast, 2020-2027
7.3.3.2 Market Estimates & Forecast, by Source, 2020-2027
7.3.3.3 Market Estimates & Forecast, by Application, 2020-2027
7.3.3.4 Market Estimates & Forecast, by Distribution Channel, 2020-2027
7.3.4 Italy
7.3.4.1 Market Estimates & Forecast, 2020-2027
7.3.4.2 Market Estimates & Forecast, by Source, 2020-2027
7.3.4.3 Market Estimates & Forecast, by Application, 2020-2027
7.3.4.4 Market Estimates & Forecast, by Distribution Channel, 2020-2027
7.4 Asia Pacific
7.4. A Market Estimates & Forecast, 2020-2027
7.4. B Market Estimates & Forecast, by Source, 2020-2027
7.4. C Market Estimates & Forecast, by Application, 2020-2027
7.4. D Market Estimates & Forecast, by Distribution Channel, 2020-2027
7.4.1 China
7.4.1.1 Market Estimates & Forecast, 2020-2027
7.4.1.2 Market Estimates & Forecast, by Source, 2020-2027
7.4.1.3 Market Estimates & Forecast, by Application, 2020-2027
7.4.1.4 Market Estimates & Forecast, by Distribution Channel, 2020-2027
7.4.2 India
7.4.2.1 Market Estimates & Forecast, 2020-2027
7.4.2.2 Market Estimates & Forecast, by Source, 2020-2027
7.4.2.3 Market Estimates & Forecast, by Application, 2020-2027
7.4.2.4 Market Estimates & Forecast, by Distribution Channel, 2020-2027
7.4.3 Japan
7.4.3.1 Market Estimates & Forecast, 2020-2027
7.4.3.2 Market Estimates & Forecast, by Source, 2020-2027
7.4.3.3 Market Estimates & Forecast, by Application, 2020-2027
7.4.3.4 Market Estimates & Forecast, by Distribution Channel, 2020-2027
7.5 RoW
7.5. A Market Estimates & Forecast, 2020-2027
7.5. B Market Estimates & Forecast, by Source, 2020-2027
7.5. C Market Estimates & Forecast, by Application, 2020-2027
7.5. D Market Estimates & Forecast, by Distribution Channel, 2020-2027
Chapter 8 Competitor Profile
8.1 Cellana Inc. (U.S.)
8.1.1 Business Overview
8.1.2 Financial Data
8.1.3 Product Landscape
8.1.4 Key Developments
8.1.5 Business Strategy
8.1.6 SWOT Analysis
8.2 Alltech, Inc. (U.S.)
8.2.1 Business Overview
8.2.2 Financial Data
8.2.3 Product Landscape
8.2.4 Key Developments
8.2.5 Business Strategy
8.2.6 SWOT Analysis
8.3 Algaetech International Sdn Bhd (Malaysia)
8.3.1 Business Overview
8.3.2 Financial Data
8.3.3 Product Landscape
8.3.4 Key Developments
8.3.5 Business Strategy
8.3.6 SWOT Analysis
8.4 Cyanotech Corporation (U.S.)
8.4.1 Business Overview
8.4.2 Financial Data
8.4.3 Product Landscape
8.4.4 Key Developments
8.4.5 Business Strategy
8.4.6 SWOT Analysis
8.5 DIC Lifetec Co. Ltd. (Japan)
8.5.1 Business Overview
8.5.2 Financial Data
8.5.3 Product Landscape
8.5.4 Key Developments
8.5.5 Business Strategy
8.5.6 SWOT Analysis
8.6 BlueBioTech GmbH (Germany)
8.6.1 Business Overview
8.6.2 Financial Data
8.6.3 Product Landscape
8.6.4 Key Developments
8.6.5 Business Strategy
8.6.6 SWOT Analysis
8.7 Parry Nutraceuticals Limited (India)
8.7.1 Business Overview
8.7.2 Financial Data
8.7.3 Product Landscape
8.7.4 Key Developments
8.7.5 Business Strategy
8.7.6 SWOT Analysis
Data Tables
TABLE 1 PESTLE ANALYSIS – U.S.
TABLE 2 PESTLE ANALYSIS- CANADA
TABLE 3 PESTLE ANALYSIS- CHINA
TABLE 4 PESTLE ANALYSIS- FRANCE
TABLE 5 PESTLE ANALYSIS- U.K.
TABLE 6 KEY SUPPLIERS OF ALGAE PRODUCTS
TABLE 7 GLOBAL MARKET FOR ALGAE PRODUCTS, BY SOURCE, (2020-2027), USD MILLION
TABLE 8 GLOBAL MARKET FOR ALGAE PRODUCTS, BY APPLICATION, (2020-2027), USD MILLION
TABLE 9 GLOBAL MARKET FOR ALGAE PRODUCTS, BY DISTRIBUTION CHANNEL, (2020-2027), USD MILLION
TABLE 10 GLOBAL ALGAE PRODUCTS SALES AND GROWTH RATE (2020-2027) USD MILLION
TABLE 11 GLOBAL MARKET FOR ALGAE PRODUCTS TOP 5 COUNTRIES
TABLE 12 GLOBAL MARKET FOR ALGAE PRODUCTS TOP COMPANIES-USD MILLION
TABLE 13 NORTH AMERICAN MARKET FOR ALGAE PRODUCTS, BY SOURCE, (2020-2027) USD MILLION
TABLE 14 NORTH AMERICAN MARKET FOR ALGAE PRODUCTS, BY APPLICATION, (2020-2027), USD MILLION
TABLE 15 NORTH AMERICAN MARKET FOR ALGAE PRODUCTS, BY DISTRIBUTION CHANNEL, (2020-2027), USD MILLION
TABLE 16 EUROPEAN MARKET FOR ALGAE PRODUCTS, BY SOURCE, (2020-2027) USD MILLION
TABLE 17 EUROPEAN MARKET FOR ALGAE PRODUCTS, BY APPLICATION, (2020-2027), USD MILLION
TABLE 18 EUROPEAN MARKET FOR ALGAE PRODUCTS, BY DISTRIBUTION CHANNEL, (2020-2027), USD MILLION
TABLE 19 APAC MARKET FOR ALGAE PRODUCTS, BY SOURCE, (2020-2027) USD MILLION
TABLE 20 APAC MARKET FOR ALGAE PRODUCTS, BY APPLICATION, (2020-2027), USD MILLION
TABLE 21 APAC MARKET FOR ALGAE PRODUCTS, BY DISTRIBUTION CHANNEL, (2020-2027), USD MILLION
TABLE 22 REST OF THE WORLD MARKET FOR ALGAE PRODUCTS, BY SOURCE, (2020-2027) USD MILLION
TABLE 23 REST OF THE WORLD MARKET FOR ALGAE PRODUCTS, BY APPLICATION, (2020-2027), USD MILLION
TABLE 24 REST OF THE WORLD MARKET FOR ALGAE PRODUCTS, BY DISTRIBUTION CHANNEL, (2020-2027), USD MILLION
TABLE 25 COMPETITIVE LANDSCAPING BASED ON FINACIALS DURING THE YEAR 2020
Charts & Figures
LIST OF FIGURES
FIGURE 1 RESEARCH METHODOLOGY
FIGURE 2 PRIMARY DATA ANALYSIS APPROACH
FIGURE 3 SECONDARY DATA ANALYSIS APPROACH
FIGURE 4 TRENDS IN ALGAE PRODUCTS IMPORTS 2020
FIGURE 5 GROWTH RATE IN ALGAE PRODUCTS IMPORTS 2020
FIGURE 6 ALGAE PRODUCTS IMPORTS MARKET SHARE BY TOP 5 IMPORTERS (2020)
FIGURE 7 TRENDS IN ALGAE PRODUCTS EXPORTS 2020
FIGURE 8 GROWTH RATE ALGAE PRODUCTS EXPORTS 2020
FIGURE 9 ALGAE PRODUCTS EXPORTS MARKET SHARE BY TOP 5 EXPORTERS (2020)
FIGURE 10 VALUE CHAIN ANALYSIS
FIGURE 11 COST ANALYSIS: ALGAE PRODUCTS
FIGURE 12 PORTER’S FIVE FORCES ANALYSIS
FIGURE 13 GLOBAL MARKET FOR ALGAE PRODUCTS TRENDS BY SOURCE
FIGURE 14 GLOBAL MARKET FOR ALGAE PRODUCTS TRENDS BY APPLICATION
FIGURE 15 GLOBAL MARKET FOR ALGAE PRODUCTS TRENDS BY DISTRIBUTION CHANNEL
FIGURE 1 FINANCIALS