Sports Analytics Market Summary
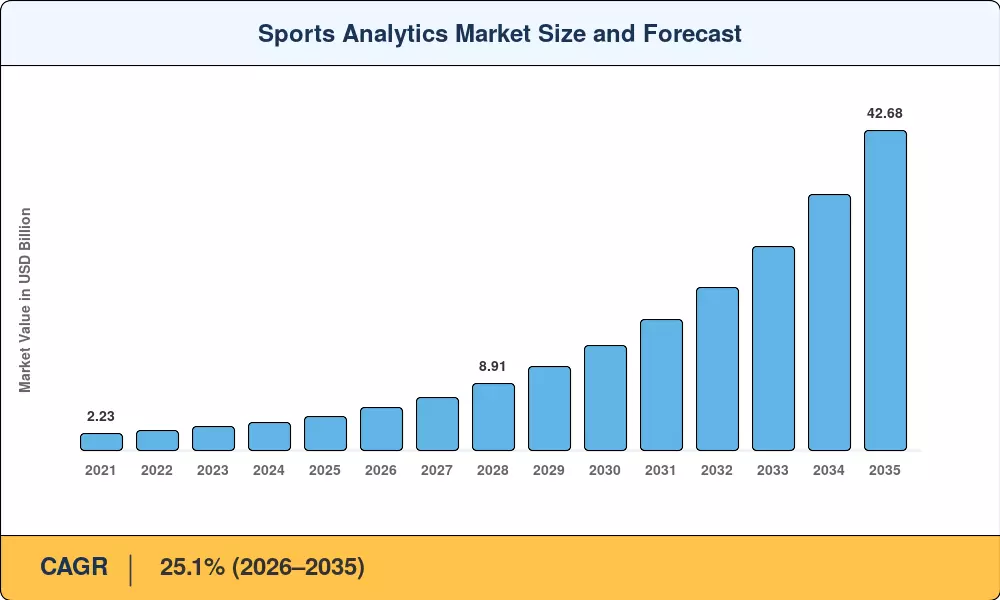
The Sports Analytics Market reached USD 4.55 Billion in 2025 and is projected to climb to USD 42.68 Billion by 2035, expanding at a 25.1% CAGR across the 2026–2035 forecast window. Two catalysts underpin this trajectory: the global wave of legalized sports wagering — now operational in 38 U.S. states and expanding across Europe — and a USD 1.2 billion surge in venture funding directed at player tracking analytics startups between 2023 and 2025 [2]. Leagues are no longer treating athlete performance metrics as back-office intelligence; they are packaging them as real-time media assets sold alongside broadcast rights.
There is a technical turning point in the way clubs utilize data. The standard for game strategy analysis — legacy on-premise servers — is giving way to cloud-native technologies that can merge sensor feeds, video telemetry and fan-engagement statistics into a single pipeline. Cloud deployments now make up about 66.8% of all installs, up from less than 50% in 2021, as sports data visualization technologies move to scalable SaaS infrastructures [3]. A couple of examples of hardware incumbents purchasing their way into software-driven stacks are Sony’s back-to-back acquisitions of KinaTrax (2024) and STATSports (2025).
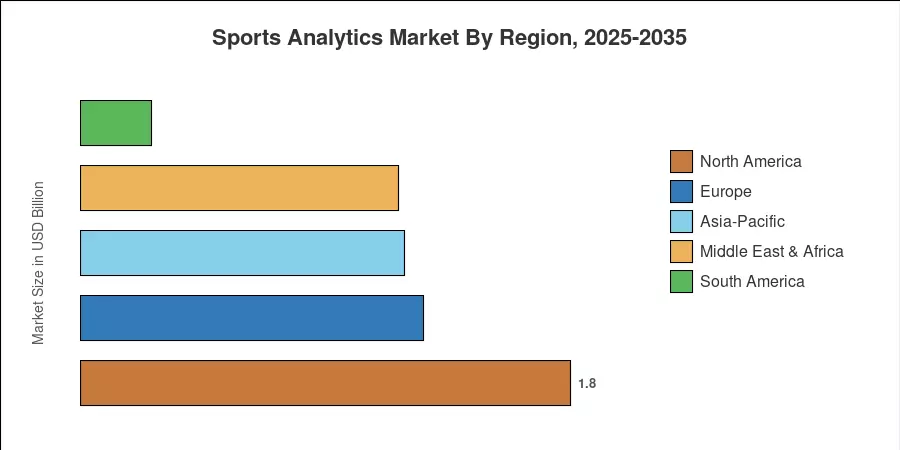
North America is projected to account for around 39.5% of the worldwide revenue share, driven by IoT sensor regulations in the NFL, NBA, and MLB and the maturity of regulated sports-betting streams. Asia-Pacific is the fastest-growing market with a CAGR of 26.2%, powered by cricket franchise analytics across IPL and Big Bash ecosystems. Europe is the second largest at USD 1.26 Billion driven by football’s data-rich Premier League and Bundesliga contracts. The Sports Analytics Market is entering a decade in which the technology of sports performance will be as essential to competitive advantage as scouting networks were in the twentieth century.
Key Report Takeaways
• By Component
- Software platforms held a 59.8% revenue share of the Sports Analytics Market in 2025, reflecting demand for integrated sports data visualization dashboards.
- Services are projected to expand at a 30.5% CAGR through 2035, driven by integration consulting and model-tuning engagements.
• End User
- Sports betting operators represent the fastest-growing end-user category at a 26.1% CAGR, fueled by real-time data-feed requirements.
- Sports teams and clubs accounted for significant revenue in 2025
• By Geography
- North America accounted for 39.5% of the Sports Analytics Market revenue in 2025.
- Asia-Pacific is anticipated to register the quickest regional CAGR of 26.2% through 2035.
- Europe generated USD 1.26 Billion in 2025 revenue, with Premier League-linked game strategy analysis as the primary demand lever.
Sports Analytics Market Size and Forecast (2021–2035)
Market sizing is based on a triangulation of vendor revenue declarations, league technology-spend surveys and top-down macro factors (e.g., global sports media-rights values and regulated betting handle volumes). Historical figures (2021-2024) are based on audited filings; forecasted values (2026-2035) use a compound annual growth rate adjusted to pipeline visibility and policy calendars.