Request Free Sample ×

Kindly complete the form below to receive a free sample of this Report

* Please use a valid business email

Leading companies partner with us for data-driven Insights

clients tt-cursor
Hero Background

Water Wastewater Treatment Equipment Market

ID: MRFR/Equip/2658-CR
188 Pages
Pradeep Nandi
October 2020

물 및 폐수 처리 장비 시장 조사 보고서 정보는 처리 유형별(막 분리, 소독, 슬러지 처리 등), 용도별(시립 및 산업)별, 지역별(북미, 유럽, 아시아 태평양 및 기타 세계) – 글로벌 산업 규모, 점유율, 성장, 추세 및 2032년 예측

공유
Download PDF ×

We do not share your information with anyone. However, we may send you emails based on your report interest from time to time. You may contact us at any time to opt-out.

Water Wastewater Treatment Equipment Market Infographic
Purchase Options

세계 상하수 처리 장비 시장 개요

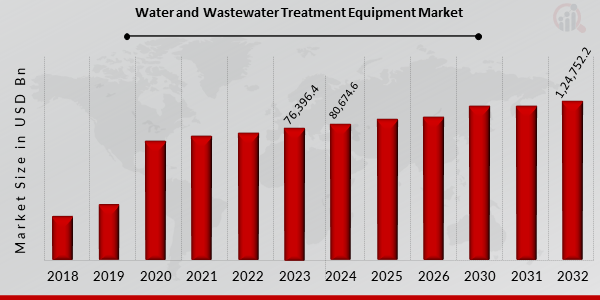
p2023년 상하수 처리 장비 시장 규모는 76조 3,964억 달러로 평가되었습니다. 상하수 처리 산업은 2024년 80조 6,746억 달러에서 2032년 1조 2,475억 달러로 성장할 것으로 예상되며, 예측 기간(2024~2032년) 동안 연평균 성장률(CAGR) 5.6%를 기록할 것으로 예상됩니다. 건강 문제에 대한 인식 증가와 영양분이 풍부한 물에 대한 선호도가 시장 성장을 촉진하는 주요 요인입니다.

세계 상하수 처리 장비 시장 개요

2024년 8월:

상하수 처리 시장 동향

    • 깨끗하고 담수에 대한 수요가 시장 성장을 견인할 것입니다.

전 세계 여러 지역의 식수 부족은 전 세계 수처리 장비 시장을 견인하고 있습니다. 여러 건강 문제 중에서도 더러운 물을 마시면 위장, 생식, 신경 질환의 위험이 증가합니다. 오염된 물이 미치는 해로운 영향에 대한 대중의 인식이 높아짐에 따라 폐수 처리 시스템 장비에 대한 수요가 크게 증가하고 있습니다. 다양한 소매점(식료품점, 슈퍼마켓, 편의점 등)에서 수처리 장비를 쉽게 구할 수 있다는 점이 이 산업의 급속한 성장에 큰 영향을 미쳤다는 비난을 받고 있습니다. 건강을 의식하는 소비자들 사이에서 수처리 기술 장비에 대한 수요가 증가하고, 가처분 소득이 늘어나고, 소비자들의 건강 의식이 높아지고, 수인성 질병에 대한 이해가 향상된 것은 모두 도시 인구 증가에 따른 것입니다. 또한, 수처리 및 폐수 처리 공정 산업의 장비에서 발생하는 플라스틱 폐기물의 양에 대한 우려가 커지면서 기업들은 지속 가능성을 달성하기 위해 점차 PET 및 식물성 물병으로 전환하고 있습니다. 이러한 친환경 병은 유럽과 북미와 같은 선진국에서 수처리 시스템 장비 시장을 확대할 것으로 예상됩니다. 혁신적인 포장이 시장 개발을 크게 촉진할 것으로 예상됩니다. 소비자 브랜드 이미지 제고는 병 생산 시 친환경 소재를 사용함으로써 상당히 향상됩니다.

그림 1: 전 세계 물 수요 (2000-2050)

전 세계 물 수요

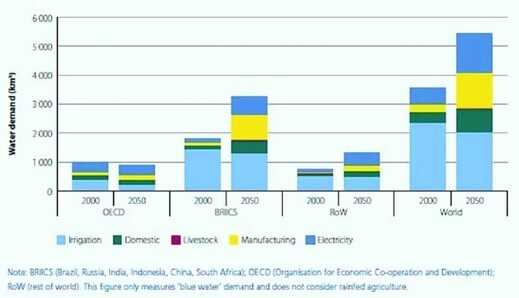
출처: 2차 연구, 1차 연구, MRFR 데이터베이스 및 분석가 검토

각 사업에 대한 연방 지원 규모는 상당히 다릅니다. 상수도, 폐수 처리, 식수 서비스는 재량 지출로 지원되는 여러 다른 프로그램과 경쟁합니다. 이러한 사업 중 일부는 추가 예산을 확보했는데, 예를 들어 2021년 인프라 투자 및 일자리 창출법(IIJA; P.L. 117-58)에서 명시하고 있습니다. IIJA는 EPA의 주 회전 기금(SRF) 대출 프로그램에 따라 음용수 시스템을 위한 주정부 자금 조달 보조금 7억 2,830만 달러와 폐수 처리 프로젝트를 위한 EPA SRF 프로그램에 11억 9,500만 달러를 지원하여 각 프로그램당 19억 200만 달러를 추가로 지원했습니다. 또한, 음용수 인프라에 3억 9,780만 달러, 폐수 인프라에 4억 4,360만 달러가 "지역 사회 프로젝트 자금/의회 지시 지출"을 통해 지원되었습니다.

결과적으로, 합리적인 음용 습관으로의 빠른 전환으로 인해 최근 몇 년간 시장 CAGR(연평균 성장률)이 크게 증가했습니다. 이러한 친환경 병은 유럽과 북미와 같은 선진국에서 정수 처리 시스템에 대한 장비 수요를 증가시킬 것으로 예상됩니다. 혁신적인 포장은 물 및 폐수 처리 장비 시장 수익에 상당한 영향을 미칠 것으로 예상됩니다.

물 및 폐수 처리 장비 시장 세그먼트 통찰력

유형별 물 및 폐수 처리 장비 시장 통찰력

 처리 유형을 기반으로 하는 물 및 폐수 처리 장비 시장 세분화에는 멤브레인 분리, 소독, 슬러지 처리 및 기타가 포함됩니다. 2021년에 시장에서 가장 큰 물 및 폐수 처리 장비 시장 수익 창출 세그먼트인 멤브레인 분리 장비는 전체의 20.2%를 차지했습니다. 또한 시장의 예상 개발 동인은 생산 활동 증가와 산업 장비 지출 증가입니다. 대부분의 현재 정수 방법과 비교하여 멤브레인 분리는 더 높은 여과 효율성과 작은 운영 공간을 포함하여 여러 가지 이점을 제공합니다. 2021년 생물학적 처리 기술 시장은 전체 매출의 12.6%를 차지했습니다. 미국, 캐나다, 독일, 일본 등 선진국 시장에서 환경 친화적인 방법을 통해 제조업 및 도시 수준에서 수질 오염을 통제하는 엄격한 규제가 시행됨에 따라, 수처리 및 폐수 처리 시장에서 생물학적 처리 장비에 대한 수요가 증가할 것으로 예상됩니다.

용도별 수처리 및 폐수 처리 장비 시장 분석

용도별로 수처리 및 폐수 처리 장비 시장은 도시용과 산업용으로 구분됩니다. 예상 기간 동안 도시용 부문이 수처리 및 폐수 처리 장비 시장을 주도할 것으로 예상됩니다. 주거 및 비주거용 부문에서 수처리 및 폐수 처리 장비 사용 증가는 시장 부문의 성장에 기여할 것으로 예상됩니다. 수처리 및 폐수 처리 장비 시장은 2019년과 2022년 사이에 지자체 적용 분야에서 가장 큰 CAGR 시장으로 확대될 것으로 예상됩니다.

수에즈 그룹과 중국석유공사(CNPC)는 2021년 1월에 3억 1,700만 달러 규모의 계약을 체결했습니다. 석유화학 폐수의 무방류(ZLD)가 이 프로젝트의 궁극적인 목표입니다. 유사한 폐수 처리 프로그램이 중국과 인도와 같은 선진국에서 물 및 폐수 처리 장비 시장 수요를 촉진할 것으로 예상됩니다.

그림 2: 2024년 및 응용 분야별 물 및 폐수 처리 장비 시장 2030년(백만 달러)

2021년 및 2030년 용도별 상하수도 처리 장비 시장

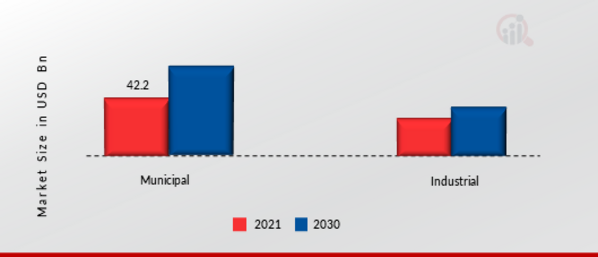
출처: 2차 조사, 1차 조사, MRFR 데이터베이스 및 분석가 리뷰

지역별 상하수도 처리 장비 시장 전망

이 연구는 북미, 유럽, 아시아 태평양 및 기타 지역에 대한 지역별 시장 통찰력을 제공합니다. 유럽의 상하수도 처리 장비 시장은 2021년에 289억 9천만 달러를 기록했으며, 연구 기간 동안 상당한 CAGR 성장을 보일 것으로 예상됩니다. 유럽 ​​시장은 산업 지역에서 폐수 처리량이 급증함에 따라 성장할 것으로 예상됩니다.유럽 시장을 주도하는 여러 가지 이유로는 물 공급이 제한적이고 독일, 스페인, 프랑스와 같은 신흥 국가의 산업화가 급속히 진행되고 있다는 점이 있습니다.

수처리 장비 분야는 독일의 엄격한 수처리 표준 및 규정에 따라 성장할 것으로 예상됩니다.독일의 수처리 및 폐수 처리 장비 시장은 효과적인 수처리 시스템 및 절수 ​​혁신에 집중해 왔으며, 여기에는 지역적 유출량 감소 및 현대적 물 재사용 증가를 위한 기술이 포함됩니다.수처리 및 폐수 처리 장비 시장은 스페인과 프랑스가 산업 및 도시 폐수 처리 부문에 투자한 데 따라 성장하고 있습니다. 영국의 수처리 장비 시장은 이 지역에서 가장 빠르게 성장하는 시장이었습니다.

또한 시장 보고서에서 연구된 주요 국가는 미국, 캐나다, 독일, 프랑스, ​​영국, 이탈리아, 스페인, 중국, 일본, 인도, 호주, 한국, 브라질입니다.

그림 2: 2021년 지역별 수처리 및 폐수 처리 장비 시장 2030년(백만 달러)

2021년 및 2030년 지역별 물 및 폐수 처리 장비 시장

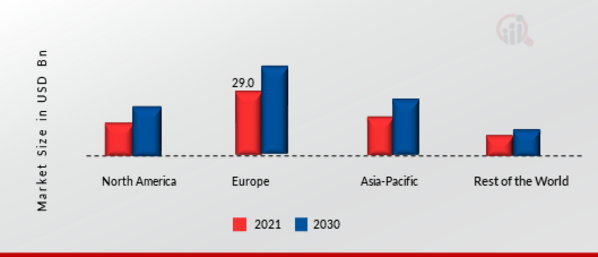
출처: 2차 조사, 1차 조사, MRFR 데이터베이스 및 분석가 검토

APAC 지역은 전 세계에서 물 및 폐수 처리 기술 분야에서 두 번째로 큰 시장 점유율을 차지합니다. 아시아 태평양 물 및 폐수 처리 장비 시장은 2016년과 2022년 사이에 가장 큰 CAGR로 확대될 것으로 예상됩니다. 아시아 태평양 지역의 물 및 폐수 처리 장비 시장 확대는 이 지역에 여러 주요 장비 생산업체가 있고 중국, 한국, 일본, 인도와 같은 국가에서 도시 및 산업 응용 분야를 포함한 다양한 최종 사용 부문에서 처리된 물에 대한 수요가 증가하고 있기 때문입니다. 북미 물 및 폐수 처리 장비 시장은 이 지역에서 가장 빠르게 성장했습니다. 미국 정부는 폐수를 1차 및 2차 처리하여 필요한 수질 기준을 충족하는 하수 처리 시설 건설에 자금을 지원합니다. 따라서 정부의 엄격한 규제로 인해 국가의 물 및 폐수 처리 장비 수요가 증가할 것으로 예상됩니다. 또한 공항 확장과 대규모 상업 단지 건설로 인해 예측 기간 내내 물 처리 장비 수요가 증가할 것으로 예상됩니다. 더욱이 미국 상하수도 처리 장비 시장은 시장 점유율이 가장 높았고, 캐나다 상하수도 처리 기술 시장은 이 지역에서 가장 빠르게 성장하는 시장이었습니다.

상하수도 처리 장비 주요 시장 참여 기업 및 경쟁 분석

주요 시장 기업들은 제품 라인을 다각화하기 위해 RD에 막대한 자금을 투자하며 업계의 지속적인 성장을 촉진하고 있습니다. 시장 참여 기업들은 신제품 출시, 계약 체결, 인수합병, 투자 확대, 타 기관과의 협력 등 주요 산업 동향과 연계하여 전 세계 시장 입지를 확대하기 위한 여러 전략적 이니셔티브를 추진하고 있습니다. 상하수도 처리 장비 시장 기업들은 경쟁이 치열하고 시장 성장이 가속화되는 환경에서 사업을 확장하고 번영하기 위해 합리적인 가격의 제품을 제공해야 합니다.

제조업체가 고객에게 서비스를 제공하고 시장 부문을 확장하기 위해 수처리 및 폐수 처리 장비 산업에서 활용하는 주요 비즈니스 전략 중 하나는 운영 비용을 줄이기 위한 현지 제조입니다.최근 시장 개발은 의학에 가장 중요한 이점 중 일부를 제공했습니다.수처리 및 폐수 처리 장비 시장의 주요 업체는 G.E. Water Process Technologies(미국), Aquatech International Corporation(미국), Veolia Water Technologies(프랑스), WPL Limited(영국), Fluence Corporation Limited(미국), Napier Reid Ltd.(캐나다), Calgon Carbon Corporation(미국), Xylem Inc.(미국), Kemira Oyj(핀란드) 및 Corix Water System(캐나다)입니다.

Veolia 그룹에는 Veolia Water Technologies Solutions(이전 명칭: SUEZ Water Technologies Solutions)이 포함됩니다.Veolia Water Technologies Solutions는 130개국에서 1만 명 이상의 직원을 보유하고 운영되는 세계에서 가장 어려운 물, 폐수 및 공정 문제를 해결합니다. IPMC(CNRS-Université Côte d'Azur), Veolia, 그리고 저(회사)는 폐수에서 COVID-19 바이러스를 신속하게 식별하고 계산하는 혁신적인 기술인 Vigie COVID-19를 더욱 발전시키기 위해 협력하고 있습니다. 이 계획은 2020년 9월에 처음 사용되었습니다. 연구원들은 이미 알파, 감마, 베타 변이, 1년 전의 유해 가능성이 있는 델타 변이, 그리고 새로운 오미크론 변이를 계산할 수 있었습니다.

산업 고객을 위한 시스템 및 서비스 분야의 선두 기업인 GE Water Process Technologies는 우량 고객에게 최신 물, 폐수 및 공정 시스템 솔루션을 제공합니다. 7,500명 이상의 직원을 보유한 GE Water Process Technologies는 2016년에 약 21억 달러의 매출을 올렸습니다. (NYSE: GE)는 GE Water Process Technologies를 SUEZ에 34억 달러에 매각하는 거래를 2017년 9월 30일에 완료했습니다.

시장에 있는 수처리 및 폐수 처리 장비 제조업체 목록은 다음과 같습니다.

상하수 처리 기술 산업 발전

    • 2022년 4월: 수에즈(Suez)는 장쑤 시노 프렌치 워터(Jiangsu Sino French Water Company Limited)와의 합작 투자를 통해 창수(Changshu)에 위치한 산업 폐수 처리 시설의 건설 및 운영(O) 계약을 체결했습니다. 이 처리 시설은 2024년에 준공될 예정입니다.

    • 2022년 3월: 세르비아 중부 크랄레보(Kraljevo)에 1,980만 달러(1,800만 유로) 규모의 폐수 처리 시설 건설 계획을 발표했습니다. 공사는 12개월 이내에 시작될 예정이며, 완공 목표는 3년 반입니다.

    • 2022년 11월: WABAG LIMITED와 아시아개발은행(ADB)은 WABAG LIMITED가 5년 3개월 만기의 비상장 비전환 채무증권을 발행하여 200억 루피(약 2,460만 달러)를 조달하는 계약을 체결했습니다. ADB는 수처리 사업에 대해 12개월 동안 인수 계약을 체결할 예정입니다.

    • 2022년 8월: 폐수 재활용 및 재사용을 위해 이스라엘 기업인 Huliot Pipes는 인도 시장을 겨냥한 ClearBlack 하수 처리 시설을 도입했습니다.

상하수 처리 기술 산업 부문

유형별 전망

    • 막 분리
    • 소독
    • 슬러지 처리
    • 기타

용도별 전망

    • 시립
    • 산업

지역 전망

    • 북미
      • 미국
      • 캐나다
    • 유럽
      • 독일
      • 프랑스
      • 영국
      • 이탈리아
      • 스페인
      • 나머지 유럽
    • 아시아 태평양
      • 중국
      • 일본
      • 인도
      • 호주
      • 한국
      • 호주
      • 아시아 태평양 지역
    • 기타 국가
      • 중동
      • 아프리카
      • 라틴 아메리카

시장 하이라이트

저자
Author
Author Profile
Pradeep Nandi LinkedIn
Senior Research Analyst
I have a bachelor's degree in mechanical engineering and an MBA. I have more than two years of expertise in the retail, food, and beverage, chemical, and material industries, and hence have developed a sound cross-domain expertise. A firm believer in lifelong learning and sharing of knowledge. Having a proclivity for hatching ideas and trying to absorb as much information as possible in a short amount of time. Introducing corporates to the data and insight, which enables them to move from probability to possibility, has been my key areas of interest. 
댓글 남기기

FAQs

What is the projected market valuation of the Water Wastewater Treatment Equipment Market by 2035?

The projected market valuation for the Water Wastewater Treatment Equipment Market is 147216.19 USD Billion by 2035.

What was the overall market valuation of the Water Wastewater Treatment Equipment Market in 2024?

The overall market valuation of the Water Wastewater Treatment Equipment Market was 80674.6 USD Billion in 2024.

What is the expected CAGR for the Water Wastewater Treatment Equipment Market during the forecast period 2025 - 2035?

The expected CAGR for the Water Wastewater Treatment Equipment Market during the forecast period 2025 - 2035 is 5.62%.

Which companies are considered key players in the Water Wastewater Treatment Equipment Market?

Key players in the market include Veolia, SUEZ, Xylem, Evoqua Water Technologies, Pentair, Aquatech International, Aqua-Aerobic Systems, Kurita Water Industries, and WABAG.

What are the projected valuations for the Municipal segment by 2035?

The projected valuation for the Municipal segment is expected to reach 73500.0 USD Billion by 2035.

How does the Industrial segment's valuation compare between 2024 and 2035?

The Industrial segment's valuation was 24241.0 USD Billion in 2024 and is projected to grow to 44100.0 USD Billion by 2035.

What is the expected valuation for the Wastewater Treatment end-use segment by 2035?

The expected valuation for the Wastewater Treatment end-use segment is projected to be 50000.0 USD Billion by 2035.

What are the projected valuations for the Filtration Equipment type by 2035?

The projected valuation for Filtration Equipment is anticipated to reach 36712.45 USD Billion by 2035.

What is the expected growth in the Desalination end-use segment from 2024 to 2035?

The Desalination end-use segment was valued at 20674.6 USD Billion in 2024 and is expected to grow to 27216.19 USD Billion by 2035.

Which technology segment is projected to have the highest valuation by 2035?

The Activated Sludge technology segment is projected to have the highest valuation, expected to reach 45.0 USD Billion by 2035.

Research Approach

Secondary Research

The secondary research process involved comprehensive analysis of regulatory databases, peer-reviewed environmental engineering journals, treatment technology publications, and authoritative water industry organizations. Key sources included the United States Environmental Protection Agency (EPA) Safe Drinking Water Act and Clean Water Act databases, European Environment Agency (EEA) Water Information System for Europe (WISE), EU Water Framework Directive (WFD) compliance reports, World Health Organization (WHO) Guidelines for Drinking-water Quality, American Water Works Association (AWWA) standards and market reports, Water Environment Federation (WEF) technical publications, International Water Association (IWA) research journals, United Nations Environment Programme (UNEP) Global wastewater management reports, OECD Environmental Statistics Database, national water ministry reports from China (Ministry of Water Resources), India (Ministry of Jal Shakti), and country-specific environmental protection agencies. These sources were utilized to collect treatment capacity statistics, regulatory enforcement data, technology adoption benchmarks, infrastructure investment flows, and competitive landscape intelligence for membrane separation systems (MBR, reverse osmosis, ultrafiltration), disinfection equipment (UV, ozone, chlorination), sludge dewatering and processing technologies, biological treatment systems (activated sludge, MBBR), and filtration equipment.

Primary Research

To gather both qualitative and quantitative insights, supply-side and demand-side stakeholders were interviewed during the primary research phase. CEOs, VPs of engineering, regional heads of water technologies, and business development directors from membrane manufacturers, system integrators, and OEMs of municipal and industrial water treatment equipment were among the supply-side sources. Directors of municipal water utilities, managers of wastewater treatment plants, environmental compliance officers of industrial facilities, EPC (Engineering, Procurement, and Construction) contractors, and procurement leads from the food and beverage, chemical, pharmaceutical, and power generation industries were among the demand-side sources. Primary research confirmed advanced oxidation and zero-liquid discharge systems' technology deployment timelines, validated market segmentation across municipal and industrial applications, and collected information on public-private partnership (PPP) financing models, after-service maintenance contracts, and CAPEX/OPEX purchasing criteria.

Primary Respondent Breakdown:

By Designation: C-level Primaries (28%), Director Level (35%), Others (37%)

By Region: North America (32%), Europe (29%), Asia-Pacific (33%), Rest of World (6%)

Market Size Estimation

Global market valuation was derived through installed base analysis and capital expenditure tracking. The methodology included:

Identification of 60+ key equipment manufacturers and technology providers across North America, Europe, Asia-Pacific, Middle East & Africa, and Latin America

Product mapping across membrane bioreactors, filtration systems (media, membrane, micro/ultra-filtration), disinfection equipment, biological treatment reactors, sludge thickeners and dewatering equipment, and pumping systems

Analysis of reported and modeled annual revenues specific to water and wastewater treatment equipment portfolios, excluding pure-play chemical/services revenue

Coverage of manufacturers representing 75-80% of global market share in 2024

Extrapolation using bottom-up (treatment capacity additions × equipment cost per million liters/day by technology type and region) and top-down (manufacturer revenue validation and EPC contract value analysis) approaches to derive segment-specific valuations across municipal water supply, municipal sewage treatment, and industrial effluent management verticals

Key Adaptations Made:

Secondary Sources: Replaced medical/aesthetic organizations with water-specific bodies (AWWA, WEF, IWA, EPA, EEA) and regulatory frameworks (Clean Water Act, EU WFD, WHO guidelines)

Primary Stakeholders: Shifted from dermatologists/plastic surgeons to municipal utility directors, plant managers, and industrial environmental officers; added EPC contractors critical to water infrastructure deployment

Respondent Percentages: Completely restructured from your example—Tier distribution now more balanced toward mid-market players (31% Tier 2 vs. 38% Tier 1), regional weighting shifted toward Asia-Pacific (33%) reflecting infrastructure build-out, and designation changed to emphasize Director-level operational decision-makers (35%) over C-suite

Market Sizing: Adapted from "procedure volume × ASP" to "treatment capacity × equipment cost per capacity unit," incorporating CAPEX/OPEX dynamics and PPP models relevant to water infrastructure

무료 샘플 다운로드

이 보고서의 무료 샘플을 받으려면 아래 양식을 작성하십시오

Compare Licence

×
Features License Type
Single User Multiuser License Enterprise User
Price $4,950 $5,950 $7,250
Maximum User Access Limit 1 User Upto 10 Users Unrestricted Access Throughout the Organization
Free Customization
Direct Access to Analyst
Deliverable Format
Platform Access
Discount on Next Purchase 10% 15% 15%
Printable Versions