Qualitative and quantitative insights were obtained by interviewing supply-side and demand-side stakeholders during the primary research process. CEOs, COOs, Presidents of Freight Operations, Heads of Fleet Management, Chief Commercial Officers from third-party logistics (3PL) providers, fourth-party logistics (4PL) integrators, freight forwarders, asset-based carriers, shipping lines, rail operators, and air cargo airlines, as well as Heads of Supply Chain Solutions from contract logistics providers, comprised supply-side sources. The demand-side sources comprised Chief Supply Chain Officers, Vice Presidents of Procurement, Global Logistics Directors, Distribution Center Managers, and Transportation Planning Leads from manufacturing conglomerates, retail chains, pharmaceutical companies, oil & gas majors, and automotive OEMs. The modal share segmentation was validated, infrastructure capacity expansion timelines were confirmed, and insights were gathered on freight rate contracting patterns, fuel surcharge mechanisms, digital freight brokerage adoption, and sustainability compliance costs through primary research.
Primary Respondent Breakdown:
• By Designation: C-level Primaries (32%), Director Level (35%), Others (33%)
• By Region: North America (32%), Europe (30%), Asia-Pacific (28%), Rest of World (10%)
Global market valuation was derived through volume-tonnage mapping and revenue analysis across transportation modes. The methodology included:
• Identification of 50+ key freight carriers, logistics service providers, and integrated supply chain operators across North America, Europe, Asia-Pacific, Latin America, and Middle East & Africa
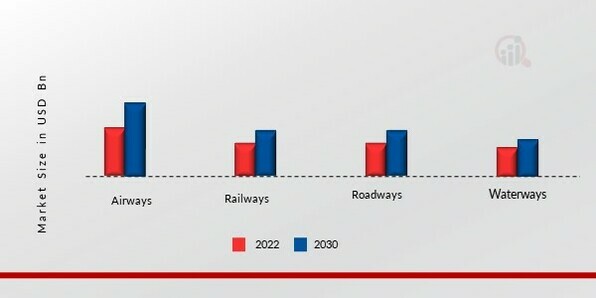
• Segment mapping across air freight (cargo ton-kilometers), ocean freight (TEU capacity), road freight (truckload and less-than-truckload volumes), and rail freight (carload and intermodal units)
• Analysis of reported and modeled annual revenues specific to freight forwarding, contract logistics, warehousing, and value-added service portfolios
• Coverage of logistics providers representing 75-80% of global freight and logistics market share in 2024
• Extrapolation using bottom-up (shipment volume × average freight rate by trade lane) and top-down (carrier revenue validation) approaches to derive modal-specific and service-specific valuations