Marché des fournisseurs de logiciels indépendants
-
1 Résumé Exécutif 17
- 1.1 ANALYSE DE L'ATTRACTIVITÉ DU MARCHÉ 18
-
2 Aperçu du Marché Mondial des Fournisseurs de Logiciels Indépendants (ISVs) 19
- 2.1 DÉFINITION 19
- 2.2 PORTÉE DE L'ÉTUDE 19
- 2.3 OBJECTIF DE LA RECHERCHE 19
- 2.4 Structure du Marché 19
- 3 Méthodologie de Recherche 20
-
4 Dynamique du Marché 27
- 4.1 Introduction 27
-
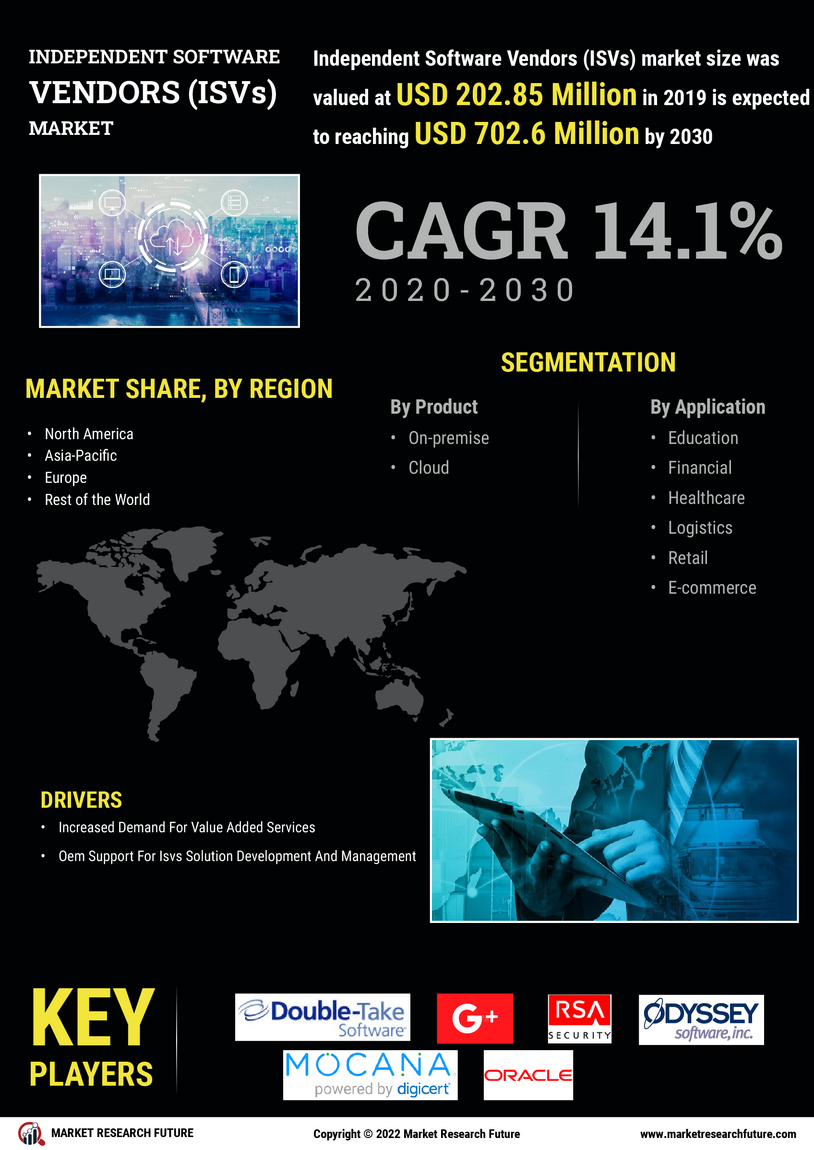
4.2 Facteurs de Croissance 28
- 4.2.1 DEMANDE ACCRUE POUR DES SERVICES À VALEUR AJOUTÉE 28
- 4.2.2 Soutien des OEM pour le développement et la gestion des solutions ISVs 28
-
4.3 Contraintes 29
- 4.3.1 PAYSAGE TECHNOLOGIQUE EN RAPIDEMENT CHANGEMENT 29
- 4.3.2 Intégration des produits de fournisseurs tiers 29
- 4.3.3 Sécurité et Scalabilité 30
- 4.3.4 Analyse de l'Impact des Contraintes 30
-
4.4 OPPORTUNITÉ 31
- 4.4.1 Demande croissante pour des solutions basées sur le cloud 31
- 4.4.2 Transformation technologique croissante 31
-
4.5 Tendances 32
- 4.5.1 INTRODUCTION 32
- 4.5.2 Cybersécurité et 5G 32
- 4.5.3 Tendances du Développement de Logiciels Low-code 32
- 4.5.4 Alignement avec les tendances de l'IA – Intelligence Décisionnelle 32
- 4.5.5 Hyperautomatisation 33
- 4.5.6 Informatique en Cloud Publique prête pour les services financiers 33
- 4.5.7 Blockchain 33
- 4.5.8 La tendance de la Livraison Continue dans le Développement de Logiciels 33
- 4.5.9 Adoption de l'Informatique en Cloud 34
- 4.5.10 Augmentation de l'Automatisation et de la Virtualisation pour les processus d'affaires 34
- 4.6 Impact de la COVID-19 sur le marché des ISVs 34
-
5 Analyse des Facteurs du Marché 36
-
5.1 Analyse de la Chaîne de Valeur 36
- 5.1.1 Recherche et Développement 37
- 5.1.2 Développeurs de Logiciels 37
- 5.1.3 Tests 37
- 5.1.4 Utilisateur Final 37
-
5.2 Modèle des Cinq Forces de Porter 38
- 5.2.1 Menace des Nouveaux Entrants 39
- 5.2.2 Pouvoir de Négociation des Fournisseurs 39
- 5.2.3 Pouvoir de Négociation des Acheteurs 39
- 5.2.4 Menace des Substituts 39
- 5.2.5 Intensité de la Rivalité 39
-
5.1 Analyse de la Chaîne de Valeur 36
-
6 MARCHÉ MONDIAL DES FOURNISSEURS DE LOGICIELS INDÉPENDANTS (ISVs), PAR TYPE 40
-
6.1 APERÇU 40
- 6.1.1 Marché MONDIAL DES FOURNISSEURS DE LOGICIELS INDÉPENDANTS (ISVs), PAR TYPE, 2019–2032 (MILLIONS USD) 41
- 6.2 Cloud 41
- 6.3 SUR SITE 41
-
6.1 APERÇU 40
-
7 MARCHÉ MONDIAL DES FOURNISSEURS DE LOGICIELS INDÉPENDANTS (ISVs), PAR APPLICATION 42
-
7.1 APERÇU 42
- 7.1.1 Marché MONDIAL DES FOURNISSEURS DE LOGICIELS INDÉPENDANTS (ISVs), PAR APPLICATION, 2019–2032 (MILLIONS USD) 43
-
7.2 E-COMMERCE 44
-
7.2.1 Étude de Cas : 44
- 7.2.1.1 Aperçu 44
- 7.2.1.2 Défi 44
- 7.2.1.3 Solution 44
- 7.2.1.4 Avantages 44
-
7.2.1 Étude de Cas : 44
-
7.3 LOGISTIQUE 45
-
7.3.1 Étude de Cas : 45
- 7.3.1.1 Aperçu 45
- 7.3.1.2 Défi 45
- 7.3.1.3 Solution 45
- 7.3.1.4 Avantages 45
-
7.3.1 Étude de Cas : 45
-
7.4 DETAIL 46
-
7.4.1 Étude de Cas : 46
- 7.4.1.1 Aperçu 46
- 7.4.1.2 Défi 46
- 7.4.1.3 Solution 46
- 7.4.1.4 Avantages 46
-
7.4.1 Étude de Cas : 46
-
7.5 SANTÉ 47
-
7.5.1 Étude de Cas : 47
- 7.5.1.1 Aperçu 47
- 7.5.1.2 Défi 47
- 7.5.1.3 Solution 47
- 7.5.1.4 Avantages 47
-
7.5.1 Étude de Cas : 47
-
7.6 Financier 48
-
7.6.1 Étude de Cas : 48
- 7.6.1.1 Aperçu 48
- 7.6.1.2 Défi 48
- 7.6.1.3 Solution 48
- 7.6.1.4 Avantages 48
-
7.6.1 Étude de Cas : 48
-
7.7 Éducatif 49
-
7.7.1 Étude de Cas : 49
- 7.7.1.1 Aperçu 49
- 7.7.1.2 Défi 49
- 7.7.1.3 Solution 49
- 7.7.1.4 Avantages 49
-
7.7.1 Étude de Cas : 49
- 7.8 Autres 49
-
7.1 APERÇU 42
-
8 MARCHÉ MONDIAL DES FOURNISSEURS DE LOGICIELS INDÉPENDANTS (ISVs), PAR RÉGION 50
-
8.1 APERÇU 50
- 8.1.1 Marché MONDIAL DES FOURNISSEURS DE LOGICIELS INDÉPENDANTS (ISVs), par Région, 2022 VS 2032 (MILLIONS USD) 50
- 8.1.2 Marché MONDIAL DES FOURNISSEURS DE LOGICIELS INDÉPENDANTS (ISVs), PAR RÉGION, 2019–2032 (MILLIONS USD) 51
-
8.2 Amérique du Nord 51
- 8.2.1 Amérique du Nord : Comparaison des Revenus des Fournisseurs de Logiciels Indépendants (ISVs) par Type (2019–2032) 52
- 8.2.2 Amérique du Nord : Taille du Marché des Fournisseurs de Logiciels Indépendants (ISVs) par Application (2019–2032) 53
- 8.2.3 Amérique du Nord : Taille du Marché des Fournisseurs de Logiciels Indépendants (ISVs) par Application (2019–2032) 53
-
8.3 Europe 54
- 8.3.1 Europe : Comparaison des Revenus des Fournisseurs de Logiciels Indépendants (ISVs) par Type (2019–2032) 54
- 8.3.2 Europe : Taille du Marché des Fournisseurs de Logiciels Indépendants (ISVs) par Application (2019–2032) 55
-
8.4 Chine 56
- 8.4.1 Fournisseurs de Logiciels Indépendants en Chine, par Type (2019–2032) 56
- 8.4.2 Comparaison des Revenus des Fournisseurs de Logiciels Indépendants en Chine (ISVs) par Type (2019–2032) 56
- 8.4.3 Taille du Marché des Fournisseurs de Logiciels Indépendants en Chine (ISVs) par Application (2019–2032) 57
- 8.4.4 Comparaison des Revenus des Fournisseurs de Logiciels Indépendants en Chine (ISVs) par APPLICATION (2019–2032) 57
-
8.5 Japon 58
- 8.5.1 Fournisseurs de Logiciels Indépendants au Japon, par Type (2019–2032) 58
- 8.5.2 Comparaison des Revenus des Fournisseurs de Logiciels Indépendants au Japon (ISVs) par Type (2019–2032) 58
- 8.5.3 Taille du Marché des Fournisseurs de Logiciels Indépendants au Japon (ISVs) par Application (2019–2032) 59
- 8.5.4 Taille du Marché des Fournisseurs de Logiciels Indépendants au Japon (ISVs) par Application (2019–2032) 59
-
8.6 Inde 60
- 8.6.1 Fournisseurs de Logiciels Indépendants en Inde, par Type (2019–2032) 60
- 8.6.2 Comparaison des Revenus des Fournisseurs de Logiciels Indépendants en Inde (ISVs) par Type (2019–2032) 60
- 8.6.3 Taille du Marché des Fournisseurs de Logiciels Indépendants en Inde (ISVs) par Application (2019–2032) 61
- 8.6.4 Taille du Marché des Fournisseurs de Logiciels Indépendants en Inde (ISVs) par Application (2019–2032) 61
-
8.7 ASIE DU SUD-EST 62
- 8.7.1 Fournisseurs de Logiciels Indépendants en Asie du Sud-Est, par Type (2019–2032) 62
- 8.7.2 Comparaison des Revenus des Fournisseurs de Logiciels Indépendants en Asie du Sud-Est (ISVs) par Type (2019–2032) 62
- 8.7.3 Taille du Marché des Fournisseurs de Logiciels Indépendants en Asie du Sud-Est (ISVs) par Application (2019–2032) 63
- 8.7.4 Taille du Marché des Fournisseurs de Logiciels Indépendants en Asie du Sud-Est (ISVs) par Application (2019–2032) 63
-
8.8 Moyen-Orient et Afrique 64
- 8.8.1 Fournisseurs de Logiciels Indépendants au Moyen-Orient et en Afrique, par Type (2019–2032) 64
- 8.8.2 Comparaison des Revenus des Fournisseurs de Logiciels Indépendants au Moyen-Orient et en Afrique (ISVs) par Type (2019–2032) 64
- 8.8.3 Taille du Marché des Fournisseurs de Logiciels Indépendants au Moyen-Orient et en Afrique (ISVs) par Application (2019–2032) 65
- 8.8.4 Taille du Marché des Fournisseurs de Logiciels Indépendants au Moyen-Orient et en Afrique (ISVs) par Application (2019–2032) 65
-
8.9 Amérique Centrale et du Sud 66
- 8.9.1 Fournisseurs de Logiciels Indépendants en Amérique Centrale et du Sud, par Type (2019–2032) 66
- 8.9.2 Comparaison des Revenus des Fournisseurs de Logiciels Indépendants en Amérique Centrale et du Sud (ISVs) par Type (2019–2032) 66
- 8.9.3 Taille du Marché des Fournisseurs de Logiciels Indépendants en Amérique Centrale et du Sud (ISVs) par Application (2019–2032) 67
- 8.9.4 Comparaison des Revenus des Fournisseurs de Logiciels Indépendants en Amérique Centrale et du Sud (ISVs) par Type (2019–2032) 67
-
8.1 APERÇU 50
-
9 PAYSAGE COMPÉTITIF 68
- 9.1 Évaluation Concurrentielle 69
- 9.2 Analyse de Part de Marché des Fournisseurs 70
-
9.3 Développements Récents 70
- 9.3.1 Développement/Expansion/Annonce de Produits 70
- 9.3.2 Partenariats/Accords/Contrats/Collaborations/Levée de Fonds 72
- 9.3.3 Fusion/Achat 73
-
10 Profils d'Entreprises 75
-
10.1 Micro Focus 75
- 10.1.1 APERÇU DE L'ENTREPRISE 75
- 10.1.2 APERÇU FINANCIER 76
- 10.1.3 Produits/Solutions/Services PROPOSÉS 76
- 10.1.4 DÉVELOPPEMENTS CLÉS 77
- 10.1.5 ANALYSE SWOT 77
- 10.1.6 STRATÉGIES CLÉS 77
-
10.2 Servicenow INC. 78
- 10.2.1 APERÇU DE L'ENTREPRISE 78
- 10.2.2 APERÇU FINANCIER 79
- 10.2.3 Produits/Solutions/Services PROPOSÉS 79
- 10.2.4 DÉVELOPPEMENTS CLÉS 80
- 10.2.5 ANALYSE SWOT 80
- 10.2.6 STRATÉGIES CLÉS 80
-
10.3 Compuware (bmc sOFWTARE) 81
- 10.3.1 APERÇU DE L'ENTREPRISE 81
- 10.3.2 APERÇU FINANCIER 81
- 10.3.3 Produits/Solutions/Services PROPOSÉS 81
- 10.3.4 DÉVELOPPEMENTS CLÉS 82
- 10.3.5 ANALYSE SWOT 82
- 10.3.6 STRATÉGIES CLÉS 82
-
10.4 SYMANTEC CORPORATION(Broadcom) 83
- 10.4.1 APERÇU DE L'ENTREPRISE 83
- 10.4.2 APERÇU FINANCIER 84
- 10.4.3 Produits/Solutions/Services PROPOSÉS 84
- 10.4.4 DÉVELOPPEMENTS CLÉS 85
- 10.4.5 ANALYSE SWOT 85
- 10.4.6 STRATÉGIES CLÉS 85
-
10.5 MOCANA (dIGIcERT) 86
- 10.5.1 APERÇU DE L'ENTREPRISE 86
- 10.5.2 APERÇU FINANCIER 86
- 10.5.3 Produits/Solutions/Services PROPOSÉS 86
- 10.5.4 DÉVELOPPEMENTS CLÉS 87
- 10.5.5 ANALYSE SWOT 87
-
10.6 HEWLETT PACKARD ENTERPRISE DEVELOPMENT LP 88
- 10.6.1 APERÇU DE L'ENTREPRISE 88
- 10.6.2 APERÇU FINANCIER 89
- 10.6.3 Produits/Solutions/Services PROPOSÉS 89
- 10.6.4 DÉVELOPPEMENTS CLÉS 90
- 10.6.5 ANALYSE SWOT 90
- 10.6.6 STRATÉGIES CLÉS 91
-
10.7 IBM CORPORATION 92
- 10.7.1 APERÇU DE L'ENTREPRISE 92
- 10.7.2 APERÇU FINANCIER 93
- 10.7.3 Produits/Solutions/Services PROPOSÉS 93
- 10.7.4 DÉVELOPPEMENTS CLÉS 94
- 10.7.5 ANALYSE SWOT 95
- 10.7.6 STRATÉGIES CLÉS 95
-
10.8 ORACLE CORPORATION 96
- 10.8.1 APERÇU DE L'ENTREPRISE 96
- 10.8.2 APERÇU FINANCIER 97
- 10.8.3 Produits/Solutions/Services PROPOSÉS 97
- 10.8.4 DÉVELOPPEMENTS CLÉS 98
- 10.8.5 ANALYSE SWOT 99
- 10.8.6 STRATÉGIES CLÉS 99
-
10.9 CISCO SYSTEMS, INC. 100
- 10.9.1 APERÇU DE L'ENTREPRISE 100
- 10.9.2 APERÇU FINANCIER 101
- 10.9.3 Produits/Solutions/Services PROPOSÉS 101
- 10.9.4 DÉVELOPPEMENTS CLÉS 102
- 10.9.5 ANALYSE SWOT 102
- 10.9.6 STRATÉGIES CLÉS 102
-
10.10 salesforce, INC. 103
- 10.10.1 APERÇU DE L'ENTREPRISE 103
- 10.10.2 APERÇU FINANCIER 104
- 10.10.3 Produits/Solutions/Services PROPOSÉS 104
- 10.10.4 DÉVELOPPEMENTS CLÉS 105
- 10.10.5 ANALYSE SWOT 105
- 10.10.6 STRATÉGIES CLÉS 106
-
10.11 SAP SE 107
- 10.11.1 APERÇU DE L'ENTREPRISE 107
- 10.11.2 APERÇU FINANCIER 108
- 10.11.3 Produits/Solutions/Services PROPOSÉS 108
- 10.11.4 DÉVELOPPEMENTS CLÉS 110
- 10.11.5 ANALYSE SWOT 111
- 10.11.6 STRATÉGIES CLÉS 111
-
10.12 CARBONITE, INC. (OpentEXT) 112
- 10.12.1 APERÇU DE L'ENTREPRISE 112
- 10.12.2 APERÇU FINANCIER 113
- 10.12.3 Produits/Solutions/Services PROPOSÉS 114
- 10.12.4 DÉVELOPPEMENTS CLÉS 114
- 10.12.5 ANALYSE SWOT 115
- 10.12.6 STRATÉGIES CLÉS 115
-
10.13 Apple Inc 116
- 10.13.1 Aperçu de l'Entreprise 116
- 10.13.2 Aperçu Financier 117
- 10.13.3 DÉVELOPPEMENTS CLÉS 118
- 10.13.4 ANALYSE SWOT 118
- 10.13.5 STRATÉGIES CLÉS 118
-
10.14 Google LLC 119
- 10.14.1 Aperçu de l'Entreprise 119
- 10.14.2 Aperçu Financier 120
- 10.14.3 PRODUITS PROPOSÉS 120
- 10.14.4 DÉVELOPPEMENTS CLÉS 121
- 10.14.5 ANALYSE SWOT 121
- 10.14.6 STRATÉGIES CLÉS 121
-
10.15 Microsoft Corporation 122
- 10.15.1 Aperçu de l'Entreprise 122
- 10.15.2 Aperçu Financier 123
- 10.15.3 PRODUITS PROPOSÉS 123
- 10.15.4 DÉVELOPPEMENTS CLÉS 124
- 10.15.5 ANALYSE SWOT 125
- 10.15.6 STRATÉGIES CLÉS 125
-
10.16 DELL INC. 126
- 10.16.1 APERÇU DE L'ENTREPRISE 126
- 10.16.2 APERÇU FINANCIER 127
- 10.16.3 Produits/Solutions/Services PROPOSÉS 127
- 10.16.4 DÉVELOPPEMENTS CLÉS 128
- 10.16.5 ANALYSE SWOT 129
- 10.16.6 STRATÉGIES CLÉS 129
- LISTE DES TABLEAUX
- TABLEAU 1 SYNTHÈSE DU MARCHÉ 17
- TABLEAU 2 MARCHÉ MONDIAL DES FOURNISSEURS DE LOGICIELS INDÉPENDANTS (ISVs), PAR TYPE, 2019–2032 (MILLIONS USD) 41
- TABLEAU 3 MARCHÉ MONDIAL DES FOURNISSEURS DE LOGICIELS INDÉPENDANTS (ISVs), PAR APPLICATION, 2019–2032 (MILLIONS USD) 43
- TABLEAU 4 MARCHÉ MONDIAL DES FOURNISSEURS DE LOGICIELS INDÉPENDANTS (ISVs), PAR RÉGION, 2019–2032 (MILLIONS USD) 51
- TABLEAU 5 AMÉRIQUE DU NORD : TAILLE DU MARCHÉ DES FOURNISSEURS DE LOGICIELS INDÉPENDANTS (ISVs), PAR TYPE (MILLIONS USD) 52
- TABLEAU 6 AMÉRIQUE DU NORD : MARCHÉ DES FOURNISSEURS DE LOGICIELS INDÉPENDANTS (ISVs), PAR APPLICATION, 2019–2032, (MILLIONS USD) 53
- TABLEAU 7 EUROPE : TAILLE DU MARCHÉ DES FOURNISSEURS DE LOGICIELS INDÉPENDANTS (ISVs), PAR TYPE (MILLIONS USD) 54
- TABLEAU 8 EUROPE : MARCHÉ DES FOURNISSEURS DE LOGICIELS INDÉPENDANTS (ISVs), PAR APPLICATION, 2019–2032, (MILLIONS USD) 55
- TABLEAU 9 CHINE : TAILLE DU MARCHÉ DES FOURNISSEURS DE LOGICIELS INDÉPENDANTS (ISVs), PAR TYPE (MILLIONS USD) 56
- TABLEAU 10 CHINE : MARCHÉ DES FOURNISSEURS DE LOGICIELS INDÉPENDANTS (ISVs), PAR APPLICATION, 2019–2032, (MILLIONS USD) 57
- TABLEAU 11 JAPON : TAILLE DU MARCHÉ DES FOURNISSEURS DE LOGICIELS INDÉPENDANTS (ISVs), PAR TYPE (MILLIONS USD) 58
- TABLEAU 12 JAPON : MARCHÉ DES FOURNISSEURS DE LOGICIELS INDÉPENDANTS (ISVs), PAR APPLICATION, 2019–2032, (MILLIONS USD) 59
- TABLEAU 13 INDE : TAILLE DU MARCHÉ DES FOURNISSEURS DE LOGICIELS INDÉPENDANTS (ISVs), PAR TYPE (MILLIONS USD) 60
- TABLEAU 14 INDE : MARCHÉ DES FOURNISSEURS DE LOGICIELS INDÉPENDANTS (ISVs), PAR APPLICATION, 2019–2032, (MILLIONS USD) 61
- TABLEAU 15 ASIE DU SUD-EST : TAILLE DU MARCHÉ DES FOURNISSEURS DE LOGICIELS INDÉPENDANTS (ISVs), PAR TYPE (MILLIONS USD) 62
- TABLEAU 16 ASIE DU SUD-EST : MARCHÉ DES FOURNISSEURS DE LOGICIELS INDÉPENDANTS (ISVs), PAR APPLICATION, 2019–2032, (MILLIONS USD) 63
- TABLEAU 17 MOYEN-ORIENT ET AFRIQUE : TAILLE DU MARCHÉ DES FOURNISSEURS DE LOGICIELS INDÉPENDANTS (ISVs), PAR TYPE (MILLIONS USD) 64
- TABLEAU 18 MOYEN-ORIENT ET AFRIQUE : MARCHÉ DES FOURNISSEURS DE LOGICIELS INDÉPENDANTS (ISVs), PAR APPLICATION, 2019–2032, (MILLIONS USD) 65
- TABLEAU 19 AMÉRIQUE CENTRALE ET DU SUD : TAILLE DU MARCHÉ DES FOURNISSEURS DE LOGICIELS INDÉPENDANTS (ISVs), PAR TYPE (MILLIONS USD) 66
- TABLEAU 20 AMÉRIQUE CENTRALE ET DU SUD : MARCHÉ DES FOURNISSEURS DE LOGICIELS INDÉPENDANTS (ISVs), PAR APPLICATION, 2019–2032, (MILLIONS USD) 67
- TABLEAU 21 DÉVELOPPEMENT/EXPANSION/ANNONCE DE PRODUITS 70
- TABLEAU 22 PARTENARIATS/ACCORDS/CONTRATS/COLLABORATIONS 72
- TABLEAU 23 FUSION/ACQUISITION 73
- TABLEAU 24 MICRO FOCUS : PRODUITS/SOLUTIONS/SERVICES PROPOSÉS 76
- TABLEAU 25 MICRO FOCUS : DÉVELOPPEMENTS CLÉS 77
- TABLEAU 26 SERVICENOW INC. : PRODUITS/SOLUTIONS/SERVICES PROPOSÉS 79
- TABLEAU 27 SERVICENOW INC. : DÉVELOPPEMENTS CLÉS 80
- TABLEAU 28 COMPUWARE (BMC SOFWTARE) : PRODUITS/SOLUTIONS/SERVICES PROPOSÉS 81
- TABLEAU 29 COMPUWARE (BMC SOFWTARE) : DÉVELOPPEMENTS CLÉS 82
- TABLEAU 30 SYMANTEC CORPORATION (BROADCOM) : PRODUITS/SOLUTIONS/SERVICES PROPOSÉS 84
- TABLEAU 31 MOCANA : PRODUITS/SOLUTIONS/SERVICES PROPOSÉS 86
-
10.1 Micro Focus 75
Customer Stories

“This is really good guys. Excellent work on a tight deadline. I will continue to use you going forward and recommend you to others. Nice job”

“Thanks. It’s been a pleasure working with you, please use me as reference with any other Intel employees.”

“Thanks for sending the report it gives us a good global view of the Betaïne market.”

“Thank you, this will be very helpful for OQS.”

“We found the report very insightful! we found your research firm very helpful. I'm sending this email to secure our future business.”

“I am very pleased with how market segments have been defined in a relevant way for my purposes (such as "Portable Freezers & refrigerators" and "last-mile"). In general the report is well structured. Thanks very much for your efforts.”

“I have been reading the first document or the study, ,the Global HVAC and FP market report 2021 till 2026. Must say, good info! I have not gone in depth at all parts, but got a good indication of the data inside!”

“We got the report in time, we really thank you for your support in this process. I also thank to all of your team as they did a great job.”