
Marché des cookies
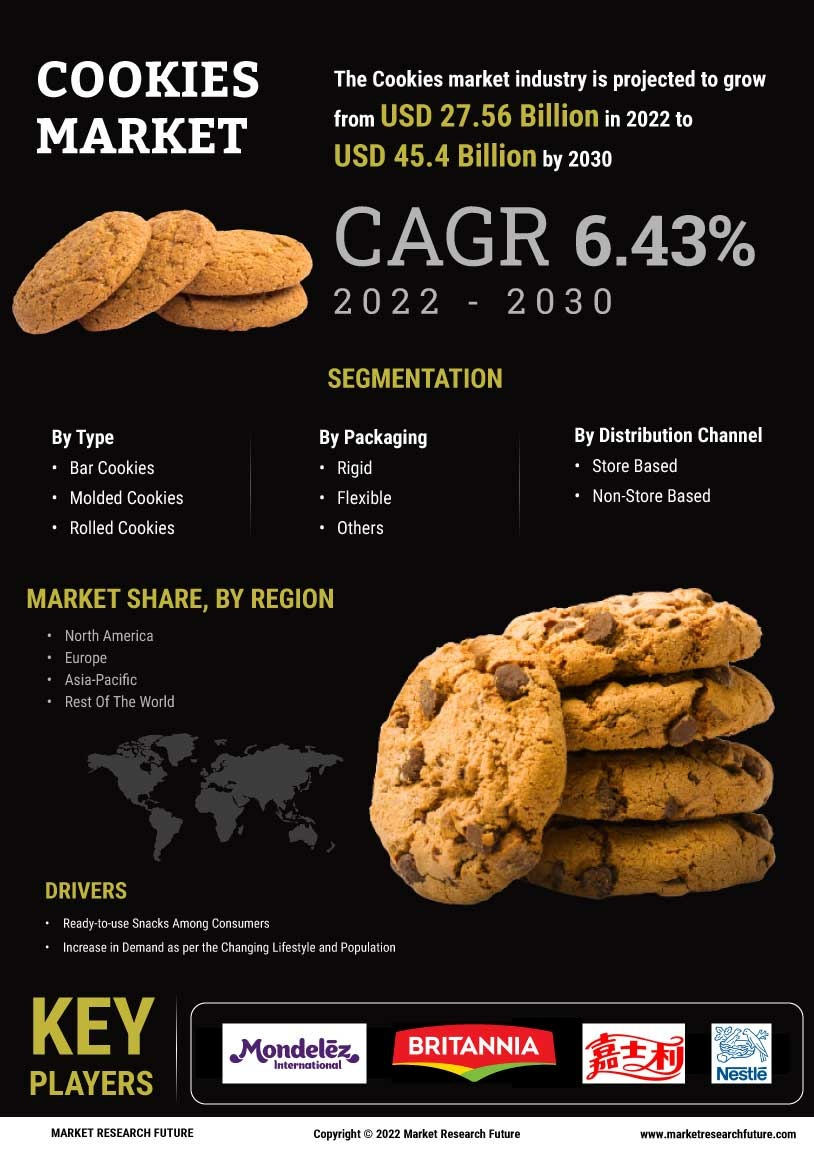
Rapport d'étude de marché sur les biscuits Informations par type (biscuits en barre, biscuits moulés, biscuits roulés, autres), emballage (rigide, flexible, autres), canal de distribution (basé sur les magasins, non basé sur les magasins), et par région (Amérique du Nord, Europe, Asie-Pacifique, et reste du monde) – Prévisions de marché jusqu'en 2035

-
1 SECTION I : RÉSUMÉ EXÉCUTIF ET POINTS CLÉS
-
1.1 RÉSUMÉ EXÉCUTIF
- 1.1.1 Vue d'ensemble du marché
- 1.1.2 Conclusions clés
- 1.1.3 Segmentation du marché
- 1.1.4 Paysage concurrentiel
- 1.1.5 Défis et opportunités
- 1.1.6 Perspectives futures 2 SECTION II : DÉLIMITATION, MÉTHODOLOGIE ET STRUCTURE DU MARCHÉ
-
2.1 INTRODUCTION AU MARCHÉ
- 2.1.1 Définition
-
2.1.2 Portée de l'étude
- 2.1.2.1 Objectif de recherche
- 2.1.2.2 Hypothèse
- 2.1.2.3 Limitations
-
2.2 MÉTHODOLOGIE DE RECHERCHE
- 2.2.1 Vue d'ensemble
- 2.2.2 Exploration de données
- 2.2.3 Recherche secondaire
-
2.2.4 Recherche primaire
- 2.2.4.1 Interviews primaires et processus de collecte d'informations
- 2.2.4.2 Répartition des répondants principaux
- 2.2.5 Modèle de prévision
-
2.2.6 Estimation de la taille du marché
- 2.2.6.1 Approche ascendante
- 2.2.6.2 Approche descendante
- 2.2.7 Triangulation des données
- 2.2.8 Validation 3 SECTION III : ANALYSE QUALITATIVE
-
3.1 DYNAMIQUE DU MARCHÉ
- 3.1.1 Vue d'ensemble
- 3.1.2 Facteurs moteurs
- 3.1.3 Contraintes
- 3.1.4 Opportunités
-
3.2 ANALYSE DES FACTEURS DU MARCHÉ
- 3.2.1 Analyse de la chaîne de valeur
-
3.2.2 Analyse des cinq forces de Porter
- 3.2.2.1 Pouvoir de négociation des fournisseurs
- 3.2.2.2 Pouvoir de négociation des acheteurs
- 3.2.2.3 Menace des nouveaux entrants
- 3.2.2.4 Menace des substituts
- 3.2.2.5 Intensité de la rivalité
-
3.2.3 Analyse de l'impact du COVID-19
- 3.2.3.1 Analyse de l'impact sur le marché
- 3.2.3.2 Impact régional
- 3.2.3.3 Analyse des opportunités et des menaces 4 SECTION IV : ANALYSE QUANTITATIVE
-
4.1 Alimentation, Boissons & Nutrition, PAR Type (milliards USD)
- 4.1.1 Biscuits en barre
- 4.1.2 Biscuits moulés
- 4.1.3 Biscuits roulés
- 4.1.4 Autres
-
4.2 Alimentation, Boissons & Nutrition, PAR Emballage (milliards USD)
- 4.2.1 Rigide
- 4.2.2 Flexible
- 4.2.3 Autres
-
4.3 Alimentation, Boissons & Nutrition, PAR Canal de distribution (milliards USD)
- 4.3.1 Basé sur les magasins
- 4.3.2 Non basé sur les magasins
-
4.4 Alimentation, Boissons & Nutrition, PAR Région (milliards USD)
-
4.4.1 Amérique du Nord
- 4.4.1.1 États-Unis
- 4.4.1.2 Canada
-
4.4.2 Europe
- 4.4.2.1 Allemagne
- 4.4.2.2 Royaume-Uni
- 4.4.2.3 France
- 4.4.2.4 Russie
- 4.4.2.5 Italie
- 4.4.2.6 Espagne
- 4.4.2.7 Reste de l'Europe
-
4.4.3 APAC
- 4.4.3.1 Chine
- 4.4.3.2 Inde
- 4.4.3.3 Japon
- 4.4.3.4 Corée du Sud
- 4.4.3.5 Malaisie
- 4.4.3.6 Thaïlande
- 4.4.3.7 Indonésie
- 4.4.3.8 Reste de l'APAC
-
4.4.4 Amérique du Sud
- 4.4.4.1 Brésil
- 4.4.4.2 Mexique
- 4.4.4.3 Argentine
- 4.4.4.4 Reste de l'Amérique du Sud
-
4.4.5 MEA
- 4.4.5.1 Pays du CCG
- 4.4.5.2 Afrique du Sud
- 4.4.5.3 Reste de la MEA
-
4.4.1 Amérique du Nord
-
1.1 RÉSUMÉ EXÉCUTIF
-
5 SECTION V : ANALYSE CONCURRENTIELLE
-
5.1 Paysage concurrentiel
- 5.1.1 Vue d'ensemble
- 5.1.2 Analyse concurrentielle
- 5.1.3 Analyse de la part de marché
- 5.1.4 Stratégie de croissance majeure dans l'Alimentation, Boissons & Nutrition
- 5.1.5 Évaluation comparative
- 5.1.6 Acteurs principaux en termes de nombre de développements dans l'Alimentation, Boissons & Nutrition
-
5.1.7 Développements clés et stratégies de croissance
- 5.1.7.1 Lancement de nouveaux produits/Déploiement de services
- 5.1.7.2 Fusions & Acquisitions
- 5.1.7.3 Coentreprises
-
5.1.8 Matrice financière des principaux acteurs
- 5.1.8.1 Ventes et revenu d'exploitation
- 5.1.8.2 Dépenses de R&D des principaux acteurs. 2023
-
5.2 Profils d'entreprise
-
5.2.1 Mondelez International (US)
- 5.2.1.1 Vue d'ensemble financière
- 5.2.1.2 Produits offerts
- 5.2.1.3 Développements clés
- 5.2.1.4 Analyse SWOT
- 5.2.1.5 Stratégies clés
-
5.2.2 Nestlé (CH)
- 5.2.2.1 Vue d'ensemble financière
- 5.2.2.2 Produits offerts
- 5.2.2.3 Développements clés
- 5.2.2.4 Analyse SWOT
- 5.2.2.5 Stratégies clés
-
5.2.3 General Mills (US)
- 5.2.3.1 Vue d'ensemble financière
- 5.2.3.2 Produits offerts
- 5.2.3.3 Développements clés
- 5.2.3.4 Analyse SWOT
- 5.2.3.5 Stratégies clés
-
5.2.4 Kraft Heinz (US)
- 5.2.4.1 Vue d'ensemble financière
- 5.2.4.2 Produits offerts
- 5.2.4.3 Développements clés
- 5.2.4.4 Analyse SWOT
- 5.2.4.5 Stratégies clés
-
5.2.5 PepsiCo (US)
- 5.2.5.1 Vue d'ensemble financière
- 5.2.5.2 Produits offerts
- 5.2.5.3 Développements clés
- 5.2.5.4 Analyse SWOT
- 5.2.5.5 Stratégies clés
-
5.2.6 Campbell Soup Company (US)
- 5.2.6.1 Vue d'ensemble financière
- 5.2.6.2 Produits offerts
- 5.2.6.3 Développements clés
- 5.2.6.4 Analyse SWOT
- 5.2.6.5 Stratégies clés
-
5.2.7 Biscoff (BE)
- 5.2.7.1 Vue d'ensemble financière
- 5.2.7.2 Produits offerts
- 5.2.7.3 Développements clés
- 5.2.7.4 Analyse SWOT
- 5.2.7.5 Stratégies clés
-
5.2.8 McKee Foods (US)
- 5.2.8.1 Vue d'ensemble financière
- 5.2.8.2 Produits offerts
- 5.2.8.3 Développements clés
- 5.2.8.4 Analyse SWOT
- 5.2.8.5 Stratégies clés
-
5.2.9 Lance (US)
- 5.2.9.1 Vue d'ensemble financière
- 5.2.9.2 Produits offerts
- 5.2.9.3 Développements clés
- 5.2.9.4 Analyse SWOT
- 5.2.9.5 Stratégies clés
-
5.2.1 Mondelez International (US)
-
5.3 Annexe
- 5.3.1 Références
- 5.3.2 Rapports connexes 6 LISTE DES FIGURES
- 6.1 SYNOPSIS DU MARCHÉ
- 6.2 ANALYSE DU MARCHÉ EN AMÉRIQUE DU NORD
- 6.3 ANALYSE DU MARCHÉ AMÉRICAIN PAR TYPE
- 6.4 ANALYSE DU MARCHÉ AMÉRICAIN PAR EMBALLAGE
- 6.5 ANALYSE DU MARCHÉ AMÉRICAIN PAR CANAL DE DISTRIBUTION
- 6.6 ANALYSE DU MARCHÉ CANADIEN PAR TYPE
- 6.7 ANALYSE DU MARCHÉ CANADIEN PAR EMBALLAGE
- 6.8 ANALYSE DU MARCHÉ CANADIEN PAR CANAL DE DISTRIBUTION
- 6.9 ANALYSE DU MARCHÉ EUROPÉEN
- 6.10 ANALYSE DU MARCHÉ ALLEMAND PAR TYPE
- 6.11 ANALYSE DU MARCHÉ ALLEMAND PAR EMBALLAGE
- 6.12 ANALYSE DU MARCHÉ ALLEMAND PAR CANAL DE DISTRIBUTION
- 6.13 ANALYSE DU MARCHÉ ROYAUMOIS PAR TYPE
- 6.14 ANALYSE DU MARCHÉ ROYAUMOIS PAR EMBALLAGE
- 6.15 ANALYSE DU MARCHÉ ROYAUMOIS PAR CANAL DE DISTRIBUTION
- 6.16 ANALYSE DU MARCHÉ FRANÇAIS PAR TYPE
- 6.17 ANALYSE DU MARCHÉ FRANÇAIS PAR EMBALLAGE
- 6.18 ANALYSE DU MARCHÉ FRANÇAIS PAR CANAL DE DISTRIBUTION
- 6.19 ANALYSE DU MARCHÉ RUSSE PAR TYPE
- 6.20 ANALYSE DU MARCHÉ RUSSE PAR EMBALLAGE
- 6.21 ANALYSE DU MARCHÉ RUSSE PAR CANAL DE DISTRIBUTION
- 6.22 ANALYSE DU MARCHÉ ITALIEN PAR TYPE
- 6.23 ANALYSE DU MARCHÉ ITALIEN PAR EMBALLAGE
- 6.24 ANALYSE DU MARCHÉ ITALIEN PAR CANAL DE DISTRIBUTION
- 6.25 ANALYSE DU MARCHÉ ESPAGNOL PAR TYPE
- 6.26 ANALYSE DU MARCHÉ ESPAGNOL PAR EMBALLAGE
- 6.27 ANALYSE DU MARCHÉ ESPAGNOL PAR CANAL DE DISTRIBUTION
- 6.28 ANALYSE DU MARCHÉ RESTANT DE L'EUROPE PAR TYPE
- 6.29 ANALYSE DU MARCHÉ RESTANT DE L'EUROPE PAR EMBALLAGE
- 6.30 ANALYSE DU MARCHÉ RESTANT DE L'EUROPE PAR CANAL DE DISTRIBUTION
- 6.31 ANALYSE DU MARCHÉ APAC
- 6.32 ANALYSE DU MARCHÉ CHINOIS PAR TYPE
- 6.33 ANALYSE DU MARCHÉ CHINOIS PAR EMBALLAGE
- 6.34 ANALYSE DU MARCHÉ CHINOIS PAR CANAL DE DISTRIBUTION
- 6.35 ANALYSE DU MARCHÉ INDIEN PAR TYPE
- 6.36 ANALYSE DU MARCHÉ INDIEN PAR EMBALLAGE
- 6.37 ANALYSE DU MARCHÉ INDIEN PAR CANAL DE DISTRIBUTION
- 6.38 ANALYSE DU MARCHÉ JAPONAIS PAR TYPE
- 6.39 ANALYSE DU MARCHÉ JAPONAIS PAR EMBALLAGE
- 6.40 ANALYSE DU MARCHÉ JAPONAIS PAR CANAL DE DISTRIBUTION
- 6.41 ANALYSE DU MARCHÉ CORÉEN DU SUD PAR TYPE
- 6.42 ANALYSE DU MARCHÉ CORÉEN DU SUD PAR EMBALLAGE
- 6.43 ANALYSE DU MARCHÉ CORÉEN DU SUD PAR CANAL DE DISTRIBUTION
- 6.44 ANALYSE DU MARCHÉ MALAYSIEN PAR TYPE
- 6.45 ANALYSE DU MARCHÉ MALAYSIEN PAR EMBALLAGE
- 6.46 ANALYSE DU MARCHÉ MALAYSIEN PAR CANAL DE DISTRIBUTION
- 6.47 ANALYSE DU MARCHÉ THAÏLAIS PAR TYPE
- 6.48 ANALYSE DU MARCHÉ THAÏLAIS PAR EMBALLAGE
- 6.49 ANALYSE DU MARCHÉ THAÏLAIS PAR CANAL DE DISTRIBUTION
- 6.50 ANALYSE DU MARCHÉ INDONÉSIEN PAR TYPE
- 6.51 ANALYSE DU MARCHÉ INDONÉSIEN PAR EMBALLAGE
- 6.52 ANALYSE DU MARCHÉ INDONÉSIEN PAR CANAL DE DISTRIBUTION
- 6.53 ANALYSE DU MARCHÉ RESTANT DE L'APAC PAR TYPE
- 6.54 ANALYSE DU MARCHÉ RESTANT DE L'APAC PAR EMBALLAGE
- 6.55 ANALYSE DU MARCHÉ RESTANT DE L'APAC PAR CANAL DE DISTRIBUTION
- 6.56 ANALYSE DU MARCHÉ EN AMÉRIQUE DU SUD
- 6.57 ANALYSE DU MARCHÉ BRÉSILIEN PAR TYPE
- 6.58 ANALYSE DU MARCHÉ BRÉSILIEN PAR EMBALLAGE
- 6.59 ANALYSE DU MARCHÉ BRÉSILIEN PAR CANAL DE DISTRIBUTION
- 6.60 ANALYSE DU MARCHÉ MEXICAIN PAR TYPE
- 6.61 ANALYSE DU MARCHÉ MEXICAIN PAR EMBALLAGE
- 6.62 ANALYSE DU MARCHÉ MEXICAIN PAR CANAL DE DISTRIBUTION
- 6.63 ANALYSE DU MARCHÉ ARGENTIN PAR TYPE
- 6.64 ANALYSE DU MARCHÉ ARGENTIN PAR EMBALLAGE
- 6.65 ANALYSE DU MARCHÉ ARGENTIN PAR CANAL DE DISTRIBUTION
- 6.66 ANALYSE DU MARCHÉ RESTANT DE L'AMÉRIQUE DU SUD PAR TYPE
- 6.67 ANALYSE DU MARCHÉ RESTANT DE L'AMÉRIQUE DU SUD PAR EMBALLAGE
- 6.68 ANALYSE DU MARCHÉ RESTANT DE L'AMÉRIQUE DU SUD PAR CANAL DE DISTRIBUTION
- 6.69 ANALYSE DU MARCHÉ MEA
- 6.70 ANALYSE DU MARCHÉ DES PAYS DU CCG PAR TYPE
- 6.71 ANALYSE DU MARCHÉ DES PAYS DU CCG PAR EMBALLAGE
- 6.72 ANALYSE DU MARCHÉ DES PAYS DU CCG PAR CANAL DE DISTRIBUTION
- 6.73 ANALYSE DU MARCHÉ EN AFRIQUE DU SUD PAR TYPE
- 6.74 ANALYSE DU MARCHÉ EN AFRIQUE DU SUD PAR EMBALLAGE
- 6.75 ANALYSE DU MARCHÉ EN AFRIQUE DU SUD PAR CANAL DE DISTRIBUTION
- 6.76 ANALYSE DU MARCHÉ RESTANT DE LA MEA PAR TYPE
- 6.77 ANALYSE DU MARCHÉ RESTANT DE LA MEA PAR EMBALLAGE
- 6.78 ANALYSE DU MARCHÉ RESTANT DE LA MEA PAR CANAL DE DISTRIBUTION
- 6.79 CRITÈRES D'ACHAT CLÉS DES ALIMENTS, BOISSONS & NUTRITION
- 6.80 PROCESSUS DE RECHERCHE DE MRFR
- 6.81 ANALYSE DRO DE L'ALIMENTATION, DES BOISSONS & DE LA NUTRITION
- 6.82 ANALYSE D'IMPACT DES FACTEURS : ALIMENTATION, BOISSONS & NUTRITION
- 6.83 ANALYSE D'IMPACT DES CONTRAINTES : ALIMENTATION, BOISSONS & NUTRITION
- 6.84 CHAÎNE D'APPROVISIONNEMENT / DE VALEUR : ALIMENTATION, BOISSONS & NUTRITION
- 6.85 ALIMENTATION, BOISSONS & NUTRITION, PAR TYPE, 2024 (% PART)
- 6.86 ALIMENTATION, BOISSONS & NUTRITION, PAR TYPE, 2024 À 2035 (milliards USD)
- 6.87 ALIMENTATION, BOISSONS & NUTRITION, PAR EMBALLAGE, 2024 (% PART)
- 6.88 ALIMENTATION, BOISSONS & NUTRITION, PAR EMBALLAGE, 2024 À 2035 (milliards USD)
- 6.89 ALIMENTATION, BOISSONS & NUTRITION, PAR CANAL DE DISTRIBUTION, 2024 (% PART)
- 6.90 ALIMENTATION, BOISSONS & NUTRITION, PAR CANAL DE DISTRIBUTION, 2024 À 2035 (milliards USD)
- 6.91 ÉVALUATION COMPARATIVE DES PRINCIPAUX CONCURRENTS 7 LISTE DES TABLEAUX
- 7.1 LISTE DES HYPOTHÈSES
-
7.2 ESTIMATIONS DE TAILLE DU MARCHÉ EN AMÉRIQUE DU NORD ; PRÉVISIONS
- 7.2.1 PAR TYPE, 2025-2035 (milliards USD)
- 7.2.2 PAR EMBALLAGE, 2025-2035 (milliards USD)
- 7.2.3 PAR CANAL DE DISTRIBUTION, 2025-2035 (milliards USD)
-
7.3 ESTIMATIONS DE TAILLE DU MARCHÉ AMÉRICAIN ; PRÉVISIONS
- 7.3.1 PAR TYPE, 2025-2035 (milliards USD)
- 7.3.2 PAR EMBALLAGE, 2025-2035 (milliards USD)
- 7.3.3 PAR CANAL DE DISTRIBUTION, 2025-2035 (milliards USD)
-
7.4 ESTIMATIONS DE TAILLE DU MARCHÉ CANADIEN ; PRÉVISIONS
- 7.4.1 PAR TYPE, 2025-2035 (milliards USD)
- 7.4.2 PAR EMBALLAGE, 2025-2035 (milliards USD)
- 7.4.3 PAR CANAL DE DISTRIBUTION, 2025-2035 (milliards USD)
-
7.5 ESTIMATIONS DE TAILLE DU MARCHÉ EUROPÉEN ; PRÉVISIONS
- 7.5.1 PAR TYPE, 2025-2035 (milliards USD)
- 7.5.2 PAR EMBALLAGE, 2025-2035 (milliards USD)
- 7.5.3 PAR CANAL DE DISTRIBUTION, 2025-2035 (milliards USD)
-
7.6 ESTIMATIONS DE TAILLE DU MARCHÉ ALLEMAND ; PRÉVISIONS
- 7.6.1 PAR TYPE, 2025-2035 (milliards USD)
- 7.6.2 PAR EMBALLAGE, 2025-2035 (milliards USD)
- 7.6.3 PAR CANAL DE DISTRIBUTION, 2025-2035 (milliards USD)
-
7.7 ESTIMATIONS DE TAILLE DU MARCHÉ ROYAUMOIS ; PRÉVISIONS
- 7.7.1 PAR TYPE, 2025-2035 (milliards USD)
- 7.7.2 PAR EMBALLAGE, 2025-2035 (milliards USD)
- 7.7.3 PAR CANAL DE DISTRIBUTION, 2025-2035 (milliards USD)
-
7.8 ESTIMATIONS DE TAILLE DU MARCHÉ FRANÇAIS ; PRÉVISIONS
- 7.8.1 PAR TYPE, 2025-2035 (milliards USD)
- 7.8.2 PAR EMBALLAGE, 2025-2035 (milliards USD)
- 7.8.3 PAR CANAL DE DISTRIBUTION, 2025-2035 (milliards USD)
-
7.9 ESTIMATIONS DE TAILLE DU MARCHÉ RUSSE ; PRÉVISIONS
- 7.9.1 PAR TYPE, 2025-2035 (milliards USD)
- 7.9.2 PAR EMBALLAGE, 2025-2035 (milliards USD)
- 7.9.3 PAR CANAL DE DISTRIBUTION, 2025-2035 (milliards USD)
-
7.10 ESTIMATIONS DE TAILLE DU MARCHÉ ITALIEN ; PRÉVISIONS
- 7.10.1 PAR TYPE, 2025-2035 (milliards USD)
- 7.10.2 PAR EMBALLAGE, 2025-2035 (milliards USD)
- 7.10.3 PAR CANAL DE DISTRIBUTION, 2025-2035 (milliards USD)
-
7.11 ESTIMATIONS DE TAILLE DU MARCHÉ ESPAGNOL ; PRÉVISIONS
- 7.11.1 PAR TYPE, 2025-2035 (milliards USD)
- 7.11.2 PAR EMBALLAGE, 2025-2035 (milliards USD)
- 7.11.3 PAR CANAL DE DISTRIBUTION, 2025-2035 (milliards USD)
-
7.12 ESTIMATIONS DE TAILLE DU MARCHÉ RESTANT DE L'EUROPE ; PRÉVISIONS
- 7.12.1 PAR TYPE, 2025-2035 (milliards USD)
- 7.12.2 PAR EMBALLAGE, 2025-2035 (milliards USD)
- 7.12.3 PAR CANAL DE DISTRIBUTION, 2025-2035 (milliards USD)
-
7.13 ESTIMATIONS DE TAILLE DU MARCHÉ APAC ; PRÉVISIONS
- 7.13.1 PAR TYPE, 2025-2035 (milliards USD)
- 7.13.2 PAR EMBALLAGE, 2025-2035 (milliards USD)
- 7.13.3 PAR CANAL DE DISTRIBUTION, 2025-2035 (milliards USD)
-
7.14 ESTIMATIONS DE TAILLE DU MARCHÉ CHINOIS ; PRÉVISIONS
- 7.14.1 PAR TYPE, 2025-2035 (milliards USD)
- 7.14.2 PAR EMBALLAGE, 2025-2035 (milliards USD)
- 7.14.3 PAR CANAL DE DISTRIBUTION, 2025-2035 (milliards USD)
-
7.15 ESTIMATIONS DE TAILLE DU MARCHÉ INDIEN ; PRÉVISIONS
- 7.15.1 PAR TYPE, 2025-2035 (milliards USD)
- 7.15.2 PAR EMBALLAGE, 2025-2035 (milliards USD)
- 7.15.3 PAR CANAL DE DISTRIBUTION, 2025-2035 (milliards USD)
-
7.16 ESTIMATIONS DE TAILLE DU MARCHÉ JAPONAIS ; PRÉVISIONS
- 7.16.1 PAR TYPE, 2025-2035 (milliards USD)
- 7.16.2 PAR EMBALLAGE, 2025-2035 (milliards USD)
- 7.16.3 PAR CANAL DE DISTRIBUTION, 2025-2035 (milliards USD)
-
7.17 ESTIMATIONS DE TAILLE DU MARCHÉ CORÉEN DU SUD ; PRÉVISIONS
- 7.17.1 PAR TYPE, 2025-2035 (milliards USD)
- 7.17.2 PAR EMBALLAGE, 2025-2035 (milliards USD)
- 7.17.3 PAR CANAL DE DISTRIBUTION, 2025-2035 (milliards USD)
-
7.18 ESTIMATIONS DE TAILLE DU MARCHÉ MALAYSIEN ; PRÉVISIONS
- 7.18.1 PAR TYPE, 2025-2035 (milliards USD)
- 7.18.2 PAR EMBALLAGE, 2025-2035 (milliards USD)
- 7.18.3 PAR CANAL DE DISTRIBUTION, 2025-2035 (milliards USD)
-
7.19 ESTIMATIONS DE TAILLE DU MARCHÉ THAÏLAIS ; PRÉVISIONS
- 7.19.1 PAR TYPE, 2025-2035 (milliards USD)
- 7.19.2 PAR EMBALLAGE, 2025-2035 (milliards USD)
- 7.19.3 PAR CANAL DE DISTRIBUTION, 2025-2035 (milliards USD)
-
7.20 ESTIMATIONS DE TAILLE DU MARCHÉ INDONÉSIEN ; PRÉVISIONS
- 7.20.1 PAR TYPE, 2025-2035 (milliards USD)
- 7.20.2 PAR EMBALLAGE, 2025-2035 (milliards USD)
- 7.20.3 PAR CANAL DE DISTRIBUTION, 2025-2035 (milliards USD)
-
7.21 ESTIMATIONS DE TAILLE DU MARCHÉ RESTANT DE L'APAC ; PRÉVISIONS
- 7.21.1 PAR TYPE, 2025-2035 (milliards USD)
- 7.21.2 PAR EMBALLAGE, 2025-2035 (milliards USD)
- 7.21.3 PAR CANAL DE DISTRIBUTION, 2025-2035 (milliards USD)
-
7.22 ESTIMATIONS DE TAILLE DU MARCHÉ EN AMÉRIQUE DU SUD ; PRÉVISIONS
- 7.22.1 PAR TYPE, 2025-2035 (milliards USD)
- 7.22.2 PAR EMBALLAGE, 2025-2035 (milliards USD)
- 7.22.3 PAR CANAL DE DISTRIBUTION, 2025-2035 (milliards USD)
-
7.23 ESTIMATIONS DE TAILLE DU MARCHÉ BRÉSILIEN ; PRÉVISIONS
- 7.23.1 PAR TYPE, 2025-2035 (milliards USD)
- 7.23.2 PAR EMBALLAGE, 2025-2035 (milliards USD)
- 7.23.3 PAR CANAL DE DISTRIBUTION, 2025-2035 (milliards USD)
-
7.24 ESTIMATIONS DE TAILLE DU MARCHÉ MEXICAIN ; PRÉVISIONS
- 7.24.1 PAR TYPE, 2025-2035 (milliards USD)
- 7.24.2 PAR EMBALLAGE, 2025-2035 (milliards USD)
- 7.24.3 PAR CANAL DE DISTRIBUTION, 2025-2035 (milliards USD)
-
7.25 ESTIMATIONS DE TAILLE DU MARCHÉ ARGENTIN ; PRÉVISIONS
- 7.25.1 PAR TYPE, 2025-2035 (milliards USD)
- 7.25.2 PAR EMBALLAGE, 2025-2035 (milliards USD)
- 7.25.3 PAR CANAL DE DISTRIBUTION, 2025-2035 (milliards USD)
-
7.26 ESTIMATIONS DE TAILLE DU MARCHÉ RESTANT DE L'AMÉRIQUE DU SUD ; PRÉVISIONS
- 7.26.1 PAR TYPE, 2025-2035 (milliards USD)
- 7.26.2 PAR EMBALLAGE, 2025-2035 (milliards USD)
- 7.26.3 PAR CANAL DE DISTRIBUTION, 2025-2035 (milliards USD)
-
7.27 ESTIMATIONS DE TAILLE DU MARCHÉ MEA ; PRÉVISIONS
- 7.27.1 PAR TYPE, 2025-2035 (milliards USD)
- 7.27.2 PAR EMBALLAGE, 2025-2035 (milliards USD)
- 7.27.3 PAR CANAL DE DISTRIBUTION, 2025-2035 (milliards USD)
-
7.28 ESTIMATIONS DE TAILLE DU MARCHÉ DES PAYS DU CCG ; PRÉVISIONS
- 7.28.1 PAR TYPE, 2025-2035 (milliards USD)
- 7.28.2 PAR EMBALLAGE, 2025-2035 (milliards USD)
- 7.28.3 PAR CANAL DE DISTRIBUTION, 2025-2035 (milliards USD)
-
7.29 ESTIMATIONS DE TAILLE DU MARCHÉ EN AFRIQUE DU SUD ; PRÉVISIONS
- 7.29.1 PAR TYPE, 2025-2035 (milliards USD)
- 7.29.2 PAR EMBALLAGE, 2025-2035 (milliards USD)
- 7.29.3 PAR CANAL DE DISTRIBUTION, 2025-2035 (milliards USD)
-
7.30 ESTIMATIONS DE TAILLE DU MARCHÉ RESTANT DE LA MEA ; PRÉVISIONS
- 7.30.1 PAR TYPE, 2025-2035 (milliards USD)
- 7.30.2 PAR EMBALLAGE, 2025-2035 (milliards USD)
- 7.30.3 PAR CANAL DE DISTRIBUTION, 2025-2035 (milliards USD)
- 7.31 LANCEMENT DE PRODUIT/DÉVELOPPEMENT/APPROBATION
- 7.32 ACQUISITION/PARTENARIAT
-
5.1 Paysage concurrentiel
Customer Stories

“This is really good guys. Excellent work on a tight deadline. I will continue to use you going forward and recommend you to others. Nice job”

“Thanks. It’s been a pleasure working with you, please use me as reference with any other Intel employees.”

“Thanks for sending the report it gives us a good global view of the Betaïne market.”

“Thank you, this will be very helpful for OQS.”

“We found the report very insightful! we found your research firm very helpful. I'm sending this email to secure our future business.”

“I am very pleased with how market segments have been defined in a relevant way for my purposes (such as "Portable Freezers & refrigerators" and "last-mile"). In general the report is well structured. Thanks very much for your efforts.”

“I have been reading the first document or the study, ,the Global HVAC and FP market report 2021 till 2026. Must say, good info! I have not gone in depth at all parts, but got a good indication of the data inside!”

“We got the report in time, we really thank you for your support in this process. I also thank to all of your team as they did a great job.”
