Request Free Sample ×

Kindly complete the form below to receive a free sample of this Report

* Please use a valid business email

Leading companies partner with us for data-driven Insights

clients tt-cursor
Hero Background

Mercado de Tubos Termoplásticos Reforzados

ID: MRFR/Equip/33408-HCR
111 Pages
Snehal Singh
Last Updated: April 06, 2026

Informe de Investigación del Mercado de Tuberías Termoplásticas Reforzadas por Tipo (Tubería Termoplástica Reforzada con Fibra Continua, Tubería Termoplástica Reforzada con Fibra Corta, Tubería Compuesta Termoplástica), por Aplicación (Petróleo y Gas, Agua y Aguas Residuales, Procesamiento Químico, Minería, Infraestructura), por Uso Final (Industrial, Residencial, Comercial), por Material de Refuerzo (Fibra de Vidrio, Fibra de Carbono, Fibra de Aramida, Fibra de Cáñamo) y por Región (América del Norte, Europa, América del Sur, Asia-Pacífico, Medio Oriente y África) - Pronóstico hasta 2035

Compartir
Download PDF ×

We do not share your information with anyone. However, we may send you emails based on your report interest from time to time. You may contact us at any time to opt-out.

Reinforced Thermoplastic Pipe Market Infographic
Purchase Options
  1. 1 SECCIÓN I: RESUMEN EJECUTIVO Y PUNTOS CLAVE\n\n
    1. 1.1 RESUMEN EJECUTIVO\n \n
      1. 1.1.1 Visión General del Mercado\n \n
      2. 1.1.2 Hallazgos Clave\n \n
      3. 1.1.3 Segmentación del Mercado\n \n
      4. 1.1.4 Panorama Competitivo\n \n
      5. 1.1.5 Desafíos y Oportunidades\n \n
      6. 1.1.6 Perspectivas Futuras\n2 SECCIÓN II: ALCANCE, METODOLOGÍA Y ESTRUCTURA DEL MERCADO\n
    2. 2.1 INTRODUCCIÓN AL MERCADO\n \n
      1. 2.1.1 Definición\n \n
      2. 2.1.2 Alcance del estudio\n \n \n
        1. 2.1.2.1 Objetivo de la Investigación\n \n \n
        2. 2.1.2.2 Suposición\n \n \n
        3. 2.1.2.3 Limitaciones\n
    3. 2.2 METODOLOGÍA DE INVESTIGACIÓN\n \n
      1. 2.2.1 Visión General\n \n
      2. 2.2.2 Minería de Datos\n \n
      3. 2.2.3 Investigación Secundaria\n \n
      4. 2.2.4 Investigación Primaria\n \n \n
        1. 2.2.4.1 Entrevistas Primarias y Proceso de Recopilación de Información\n \n \n
        2. 2.2.4.2 Desglose de los Respondientes Primarios\n \n
      5. 2.2.5 Modelo de Pronóstico\n \n
      6. 2.2.6 Estimación del Tamaño del Mercado\n \n \n
        1. 2.2.6.1 Enfoque de Arriba hacia Abajo\n \n \n
        2. 2.2.6.2 Enfoque de Abajo hacia Arriba\n \n
      7. 2.2.7 Triangulación de Datos\n \n
      8. 2.2.8 Validación\n3 SECCIÓN III: ANÁLISIS CUALITATIVO\n
    4. 3.1 DINÁMICAS DEL MERCADO\n \n
      1. 3.1.1 Visión General\n \n
      2. 3.1.2 Impulsores\n \n
      3. 3.1.3 Restricciones\n \n
      4. 3.1.4 Oportunidades\n
    5. 3.2 ANÁLISIS DE FACTORES DEL MERCADO\n \n
      1. 3.2.1 Análisis de la Cadena de Valor\n \n
      2. 3.2.2 Análisis de las Cinco Fuerzas de Porter\n \n \n
        1. 3.2.2.1 Poder de Negociación de los Proveedores\n \n \n
        2. 3.2.2.2 Poder de Negociación de los Compradores\n \n \n
        3. 3.2.2.3 Amenaza de Nuevos Entrantes\n \n \n
        4. 3.2.2.4 Amenaza de Sustitutos\n \n \n
        5. 3.2.2.5 Intensidad de la Rivalidad\n \n
      3. 3.2.3 Análisis del Impacto del COVID-19\n \n \n
        1. 3.2.3.1 Análisis del Impacto en el Mercado\n \n \n
        2. 3.2.3.2 Impacto Regional\n \n \n
        3. 3.2.3.3 Análisis de Oportunidades y Amenazas\n4 SECCIÓN IV: ANÁLISIS CUANTITATIVO\n
    6. 4.1 Salud, POR Tipo (USD Mil millones)\n \n
      1. 4.1.1 Tubería Termoplástica Reforzada con Fibra Continua\n \n
      2. 4.1.2 Tubería Termoplástica Reforzada con Fibra Corta\n \n
      3. 4.1.3 Tubería Compuesta Termoplástica\n
    7. 4.2 Salud, POR Aplicación (USD Mil millones)\n \n
      1. 4.2.1 Petróleo y Gas\n \n
      2. 4.2.2 Agua y Aguas Residuales\n \n
      3. 4.2.3 Procesamiento Químico\n \n
      4. 4.2.4 Minería\n \n
      5. 4.2.5 Infraestructura\n
    8. 4.3 Salud, POR Uso Final (USD Mil millones)\n \n
      1. 4.3.1 Industrial\n \n
      2. 4.3.2 Residencial\n \n
      3. 4.3.3 Comercial\n
    9. 4.4 Salud, POR Material de Refuerzo (USD Mil millones)\n \n
      1. 4.4.1 Fibra de Vidrio\n \n
      2. 4.4.2 Fibra de Carbono\n \n
      3. 4.4.3 Fibra Aramida\n \n
      4. 4.4.4 Fibra de Cáñamo\n
    10. 4.5 Salud, POR Región (USD Mil millones)\n \n
      1. 4.5.1 América del Norte\n \n \n
        1. 4.5.1.1 EE. UU.\n \n \n
        2. 4.5.1.2 Canadá\n \n
      2. 4.5.2 Europa\n \n \n
        1. 4.5.2.1 Alemania\n \n \n
        2. 4.5.2.2 Reino Unido\n \n \n
        3. 4.5.2.3 Francia\n \n \n
        4. 4.5.2.4 Rusia\n \n \n
        5. 4.5.2.5 Italia\n \n \n
        6. 4.5.2.6 España\n \n \n
        7. 4.5.2.7 Resto de Europa\n \n
      3. 4.5.3 APAC\n \n \n
        1. 4.5.3.1 China\n \n \n
        2. 4.5.3.2 India\n \n \n
        3. 4.5.3.3 Japón\n \n \n
        4. 4.5.3.4 Corea del Sur\n \n \n
        5. 4.5.3.5 Malasia\n \n \n
        6. 4.5.3.6 Tailandia\n \n \n
        7. 4.5.3.7 Indonesia\n \n \n
        8. 4.5.3.8 Resto de APAC\n \n
      4. 4.5.4 América del Sur\n \n \n
        1. 4.5.4.1 Brasil\n \n \n
        2. 4.5.4.2 México\n \n \n
        3. 4.5.4.3 Argentina\n \n \n
        4. 4.5.4.4 Resto de América del Sur\n \n
      5. 4.5.5 MEA\n \n \n
        1. 4.5.5.1 Países del CCG\n \n \n
        2. 4.5.5.2 Sudáfrica\n \n \n
        3. 4.5.5.3 Resto de MEA\n5 SECCIÓN V: ANÁLISIS COMPETITIVO\n
    11. 5.1 Panorama Competitivo\n \n
      1. 5.1.1 Visión General\n \n
      2. 5.1.2 Análisis Competitivo\n \n
      3. 5.1.3 Análisis de Participación de Mercado\n \n
      4. 5.1.4 Estrategia de Crecimiento Principal en el Sector Salud\n \n
      5. 5.1.5 Comparación Competitiva\n \n
      6. 5.1.6 Principales Actores en Términos de Número de Desarrollos en el Sector Salud\n \n
      7. 5.1.7 Principales desarrollos y estrategias de crecimiento\n \n \n
        1. 5.1.7.1 Lanzamiento de Nuevos Productos/Implementación de Servicios\n \n \n
        2. 5.1.7.2 Fusiones y Adquisiciones\n \n \n
        3. 5.1.7.3 Empresas Conjuntas\n \n
      8. 5.1.8 Matriz Financiera de los Principales Actores\n \n \n
        1. 5.1.8.1 Ventas e Ingresos Operativos\n \n \n
        2. 5.1.8.2 Gastos en I+D de los Principales Actores. 2023\n
    12. 5.2 Perfiles de Empresas\n \n
      1. 5.2.1 Graham Corporation (EE. UU.)\n \n \n
        1. 5.2.1.1 Visión General Financiera\n \n \n
        2. 5.2.1.2 Productos Ofrecidos\n \n \n
        3. 5.2.1.3 Principales Desarrollos\n \n \n
        4. 5.2.1.4 Análisis FODA\n \n \n
        5. 5.2.1.5 Estrategias Clave\n \n
      2. 5.2.2 Amiantit Company (SA)\n \n \n
        1. 5.2.2.1 Visión General Financiera\n \n \n
        2. 5.2.2.2 Productos Ofrecidos\n \n \n
        3. 5.2.2.3 Principales Desarrollos\n \n \n
        4. 5.2.2.4 Análisis FODA\n \n \n
        5. 5.2.2.5 Estrategias Clave\n \n
      3. 5.2.3 National Oilwell Varco (EE. UU.)\n \n \n
        1. 5.2.3.1 Visión General Financiera\n \n \n
        2. 5.2.3.2 Productos Ofrecidos\n \n \n
        3. 5.2.3.3 Principales Desarrollos\n \n \n
        4. 5.2.3.4 Análisis FODA\n \n \n
        5. 5.2.3.5 Estrategias Clave\n \n
      4. 5.2.4 Pipelife International (AT)\n \n \n
        1. 5.2.4.1 Visión General Financiera\n \n \n
        2. 5.2.4.2 Productos Ofrecidos\n \n \n
        3. 5.2.4.3 Principales Desarrollos\n \n \n
        4. 5.2.4.4 Análisis FODA\n \n \n
        5. 5.2.4.5 Estrategias Clave\n \n
      5. 5.2.5 KWH Pipe (FI)\n \n \n
        1. 5.2.5.1 Visión General Financiera\n \n \n
        2. 5.2.5.2 Productos Ofrecidos\n \n \n
        3. 5.2.5.3 Principales Desarrollos\n \n \n
        4. 5.2.5.4 Análisis FODA\n \n \n
        5. 5.2.5.5 Estrategias Clave\n \n
      6. 5.2.6 Kraton Corporation (EE. UU.)\n \n \n
        1. 5.2.6.1 Visión General Financiera\n \n \n
        2. 5.2.6.2 Productos Ofrecidos\n \n \n
        3. 5.2.6.3 Principales Desarrollos\n \n \n
        4. 5.2.6.4 Análisis FODA\n \n \n
        5. 5.2.6.5 Estrategias Clave\n \n
      7. 5.2.7 Kuzeyboru (TR)\n \n \n
        1. 5.2.7.1 Visión General Financiera\n \n \n
        2. 5.2.7.2 Productos Ofrecidos\n \n \n
        3. 5.2.7.3 Principales Desarrollos\n \n \n
        4. 5.2.7.4 Análisis FODA\n \n \n
        5. 5.2.7.5 Estrategias Clave\n \n
      8. 5.2.8 Kumar Industries (IN)\n \n \n
        1. 5.2.8.1 Visión General Financiera\n \n \n
        2. 5.2.8.2 Productos Ofrecidos\n \n \n
        3. 5.2.8.3 Principales Desarrollos\n \n \n
        4. 5.2.8.4 Análisis FODA\n \n \n
        5. 5.2.8.5 Estrategias Clave\n \n
      9. 5.2.9 Kuzeyboru (TR)\n \n \n
        1. 5.2.9.1 Visión General Financiera\n \n \n
        2. 5.2.9.2 Productos Ofrecidos\n \n \n
        3. 5.2.9.3 Principales Desarrollos\n \n \n
        4. 5.2.9.4 Análisis FODA\n \n \n
        5. 5.2.9.5 Estrategias Clave\n
    13. 5.3 Apéndice\n \n
      1. 5.3.1 Referencias\n \n
      2. 5.3.2 Informes Relacionados\n6 LISTA DE FIGURAS\n
    14. 6.1 SINOPSIS DEL MERCADO\n
    15. 6.2 ANÁLISIS DEL MERCADO DE AMÉRICA DEL NORTE\n
    16. 6.3 ANÁLISIS DEL MERCADO DE EE. UU. POR TIPO\n
    17. 6.4 ANÁLISIS DEL MERCADO DE EE. UU. POR APLICACIÓN\n
    18. 6.5 ANÁLISIS DEL MERCADO DE EE. UU. POR USO FINAL\n
    19. 6.6 ANÁLISIS DEL MERCADO DE EE. UU. POR MATERIAL DE REFUERZO\n
    20. 6.7 ANÁLISIS DEL MERCADO DE CANADÁ POR TIPO\n
    21. 6.8 ANÁLISIS DEL MERCADO DE CANADÁ POR APLICACIÓN\n
    22. 6.9 ANÁLISIS DEL MERCADO DE CANADÁ POR USO FINAL\n
    23. 6.10 ANÁLISIS DEL MERCADO DE CANADÁ POR MATERIAL DE REFUERZO\n
    24. 6.11 ANÁLISIS DEL MERCADO DE EUROPA\n
    25. 6.12 ANÁLISIS DEL MERCADO DE ALEMANIA POR TIPO\n
    26. 6.13 ANÁLISIS DEL MERCADO DE ALEMANIA POR APLICACIÓN\n
    27. 6.14 ANÁLISIS DEL MERCADO DE ALEMANIA POR USO FINAL\n
    28. 6.15 ANÁLISIS DEL MERCADO DE ALEMANIA POR MATERIAL DE REFUERZO\n
    29. 6.16 ANÁLISIS DEL MERCADO DEL REINO UNIDO POR TIPO\n
    30. 6.17 ANÁLISIS DEL MERCADO DEL REINO UNIDO POR APLICACIÓN\n
    31. 6.18 ANÁLISIS DEL MERCADO DEL REINO UNIDO POR USO FINAL\n
    32. 6.19 ANÁLISIS DEL MERCADO DEL REINO UNIDO POR MATERIAL DE REFUERZO\n
    33. 6.20 ANÁLISIS DEL MERCADO DE FRANCIA POR TIPO\n
    34. 6.21 ANÁLISIS DEL MERCADO DE FRANCIA POR APLICACIÓN\n
    35. 6.22 ANÁLISIS DEL MERCADO DE FRANCIA POR USO FINAL\n
    36. 6.23 ANÁLISIS DEL MERCADO DE FRANCIA POR MATERIAL DE REFUERZO\n
    37. 6.24 ANÁLISIS DEL MERCADO DE RUSIA POR TIPO\n
    38. 6.25 ANÁLISIS DEL MERCADO DE RUSIA POR APLICACIÓN\n
    39. 6.26 ANÁLISIS DEL MERCADO DE RUSIA POR USO FINAL\n
    40. 6.27 ANÁLISIS DEL MERCADO DE RUSIA POR MATERIAL DE REFUERZO\n
    41. 6.28 ANÁLISIS DEL MERCADO DE ITALIA POR TIPO\n
    42. 6.29 ANÁLISIS DEL MERCADO DE ITALIA POR APLICACIÓN\n
    43. 6.30 ANÁLISIS DEL MERCADO DE ITALIA POR USO FINAL\n
    44. 6.31 ANÁLISIS DEL MERCADO DE ITALIA POR MATERIAL DE REFUERZO\n
    45. 6.32 ANÁLISIS DEL MERCADO DE ESPAÑA POR TIPO\n
    46. 6.33 ANÁLISIS DEL MERCADO DE ESPAÑA POR APLICACIÓN\n
    47. 6.34 ANÁLISIS DEL MERCADO DE ESPAÑA POR USO FINAL\n
    48. 6.35 ANÁLISIS DEL MERCADO DE ESPAÑA POR MATERIAL DE REFUERZO\n
    49. 6.36 ANÁLISIS DEL MERCADO DEL RESTO DE EUROPA POR TIPO\n
    50. 6.37 ANÁLISIS DEL MERCADO DEL RESTO DE EUROPA POR APLICACIÓN\n
    51. 6.38 ANÁLISIS DEL MERCADO DEL RESTO DE EUROPA POR USO FINAL\n
    52. 6.39 ANÁLISIS DEL MERCADO DEL RESTO DE EUROPA POR MATERIAL DE REFUERZO\n
    53. 6.40 ANÁLISIS DEL MERCADO DE APAC\n
    54. 6.41 ANÁLISIS DEL MERCADO DE CHINA POR TIPO\n
    55. 6.42 ANÁLISIS DEL MERCADO DE CHINA POR APLICACIÓN\n
    56. 6.43 ANÁLISIS DEL MERCADO DE CHINA POR USO FINAL\n
    57. 6.44 ANÁLISIS DEL MERCADO DE CHINA POR MATERIAL DE REFUERZO\n
    58. 6.45 ANÁLISIS DEL MERCADO DE INDIA POR TIPO\n
    59. 6.46 ANÁLISIS DEL MERCADO DE INDIA POR APLICACIÓN\n
    60. 6.47 ANÁLISIS DEL MERCADO DE INDIA POR USO FINAL\n
    61. 6.48 ANÁLISIS DEL MERCADO DE INDIA POR MATERIAL DE REFUERZO\n
    62. 6.49 ANÁLISIS DEL MERCADO DE JAPÓN POR TIPO\n
    63. 6.50 ANÁLISIS DEL MERCADO DE JAPÓN POR APLICACIÓN\n
    64. 6.51 ANÁLISIS DEL MERCADO DE JAPÓN POR USO FINAL\n
    65. 6.52 ANÁLISIS DEL MERCADO DE JAPÓN POR MATERIAL DE REFUERZO\n
    66. 6.53 ANÁLISIS DEL MERCADO DE COREA DEL SUR POR TIPO\n
    67. 6.54 ANÁLISIS DEL MERCADO DE COREA DEL SUR POR APLICACIÓN\n
    68. 6.55 ANÁLISIS DEL MERCADO DE COREA DEL SUR POR USO FINAL\n
    69. 6.56 ANÁLISIS DEL MERCADO DE COREA DEL SUR POR MATERIAL DE REFUERZO\n
    70. 6.57 ANÁLISIS DEL MERCADO DE MALASIA POR TIPO\n
    71. 6.58 ANÁLISIS DEL MERCADO DE MALASIA POR APLICACIÓN\n
    72. 6.59 ANÁLISIS DEL MERCADO DE MALASIA POR USO FINAL\n
    73. 6.60 ANÁLISIS DEL MERCADO DE MALASIA POR MATERIAL DE REFUERZO\n
    74. 6.61 ANÁLISIS DEL MERCADO DE TAILANDIA POR TIPO\n
    75. 6.62 ANÁLISIS DEL MERCADO DE TAILANDIA POR APLICACIÓN\n
    76. 6.63 ANÁLISIS DEL MERCADO DE TAILANDIA POR USO FINAL\n
    77. 6.64 ANÁLISIS DEL MERCADO DE TAILANDIA POR MATERIAL DE REFUERZO\n
    78. 6.65 ANÁLISIS DEL MERCADO DE INDONESIA POR TIPO\n
    79. 6.66 ANÁLISIS DEL MERCADO DE INDONESIA POR APLICACIÓN\n
    80. 6.67 ANÁLISIS DEL MERCADO DE INDONESIA POR USO FINAL\n
    81. 6.68 ANÁLISIS DEL MERCADO DE INDONESIA POR MATERIAL DE REFUERZO\n
    82. 6.69 ANÁLISIS DEL MERCADO DEL RESTO DE APAC POR TIPO\n
    83. 6.70 ANÁLISIS DEL MERCADO DEL RESTO DE APAC POR APLICACIÓN\n
    84. 6.71 ANÁLISIS DEL MERCADO DEL RESTO DE APAC POR USO FINAL\n
    85. 6.72 ANÁLISIS DEL MERCADO DEL RESTO DE APAC POR MATERIAL DE REFUERZO\n
    86. 6.73 ANÁLISIS DEL MERCADO DE AMÉRICA DEL SUR\n
    87. 6.74 ANÁLISIS DEL MERCADO DE BRASIL POR TIPO\n
    88. 6.75 ANÁLISIS DEL MERCADO DE BRASIL POR APLICACIÓN\n
    89. 6.76 ANÁLISIS DEL MERCADO DE BRASIL POR USO FINAL\n
    90. 6.77 ANÁLISIS DEL MERCADO DE BRASIL POR MATERIAL DE REFUERZO\n
    91. 6.78 ANÁLISIS DEL MERCADO DE MÉXICO POR TIPO\n
    92. 6.79 ANÁLISIS DEL MERCADO DE MÉXICO POR APLICACIÓN\n
    93. 6.80 ANÁLISIS DEL MERCADO DE MÉXICO POR USO FINAL\n
    94. 6.81 ANÁLISIS DEL MERCADO DE MÉXICO POR MATERIAL DE REFUERZO\n
    95. 6.82 ANÁLISIS DEL MERCADO DE ARGENTINA POR TIPO\n
    96. 6.83 ANÁLISIS DEL MERCADO DE ARGENTINA POR APLICACIÓN\n
    97. 6.84 ANÁLISIS DEL MERCADO DE ARGENTINA POR USO FINAL\n
    98. 6.85 ANÁLISIS DEL MERCADO DE ARGENTINA POR MATERIAL DE REFUERZO\n
    99. 6.86 ANÁLISIS DEL MERCADO DEL RESTO DE AMÉRICA DEL SUR POR TIPO\n
    100. 6.87 ANÁLISIS DEL MERCADO DEL RESTO DE AMÉRICA DEL SUR POR APLICACIÓN\n
    101. 6.88 ANÁLISIS DEL MERCADO DEL RESTO DE AMÉRICA DEL SUR POR USO FINAL\n
    102. 6.89 ANÁLISIS DEL MERCADO DEL RESTO DE AMÉRICA DEL SUR POR MATERIAL DE REFUERZO\n
    103. 6.90 ANÁLISIS DEL MERCADO DE MEA\n
    104. 6.91 ANÁLISIS DEL MERCADO DE LOS PAÍSES DEL CCG POR TIPO\n
    105. 6.92 ANÁLISIS DEL MERCADO DE LOS PAÍSES DEL CCG POR APLICACIÓN\n
    106. 6.93 ANÁLISIS DEL MERCADO DE LOS PAÍSES DEL CCG POR USO FINAL\n
    107. 6.94 ANÁLISIS DEL MERCADO DE LOS PAÍSES DEL CCG POR MATERIAL DE REFUERZO\n
    108. 6.95 ANÁLISIS DEL MERCADO DE SUDÁFRICA POR TIPO\n
    109. 6.96 ANÁLISIS DEL MERCADO DE SUDÁFRICA POR APLICACIÓN\n
    110. 6.97 ANÁLISIS DEL MERCADO DE SUDÁFRICA POR USO FINAL\n
    111. 6.98 ANÁLISIS DEL MERCADO DE SUDÁFRICA POR MATERIAL DE REFUERZO\n
    112. 6.99 ANÁLISIS DEL MERCADO DEL RESTO DE MEA POR TIPO\n
    113. 6.100 ANÁLISIS DEL MERCADO DEL RESTO DE MEA POR APLICACIÓN\n
    114. 6.101 ANÁLISIS DEL MERCADO DEL RESTO DE MEA POR USO FINAL\n
    115. 6.102 ANÁLISIS DEL MERCADO DEL RESTO DE MEA POR MATERIAL DE REFUERZO\n
    116. 6.103 CRITERIOS CLAVE DE COMPRA EN SALUD\n
    117. 6.104 PROCESO DE INVESTIGACIÓN DE MRFR\n
    118. 6.105 ANÁLISIS DRO DE SALUD\n
    119. 6.106 ANÁLISIS DEL IMPACTO DE LOS IMPULSORES: SALUD\n
    120. 6.107 ANÁLISIS DEL IMPACTO DE LAS RESTRICCIONES: SALUD\n
    121. 6.108 CADENA DE SUMINISTRO / VALOR: SALUD\n
    122. 6.109 SALUD, POR TIPO, 2024 (% DE PARTICIPACIÓN)\n
    123. 6.110 SALUD, POR TIPO, 2024 A 2035 (USD Mil millones)\n
    124. 6.111 SALUD, POR APLICACIÓN, 2024 (% DE PARTICIPACIÓN)\n
    125. 6.112 SALUD, POR APLICACIÓN, 2024 A 2035 (USD Mil millones)\n
    126. 6.113 SALUD, POR USO FINAL, 2024 (% DE PARTICIPACIÓN)\n
    127. 6.114 SALUD, POR USO FINAL, 2024 A 2035 (USD Mil millones)\n
    128. 6.115 SALUD, POR MATERIAL DE REFUERZO, 2024 (% DE PARTICIPACIÓN)\n
    129. 6.116 SALUD, POR MATERIAL DE REFUERZO, 2024 A 2035 (USD Mil millones)\n
    130. 6.117 COMPARATIVA DE LOS PRINCIPALES COMPETIDORES\n7 LISTA DE TABLAS\n
    131. 7.1 LISTA DE SUPOSICIONES\n \n
      1. 7.1.1 \n
    132. 7.2 ESTIMACIONES DEL TAMAÑO DEL MERCADO DE AMÉRICA DEL NORTE; PRONÓSTICO\n \n
      1. 7.2.1 POR TIPO, 2025-2035 (USD Mil millones)\n \n
      2. 7.2.2 POR APLICACIÓN, 2025-2035 (USD Mil millones)\n \n
      3. 7.2.3 POR USO FINAL, 2025-2035 (USD Mil millones)\n \n
      4. 7.2.4 POR MATERIAL DE REFUERZO, 2025-2035 (USD Mil millones)\n
    133. 7.3 ESTIMACIONES DEL TAMAÑO DEL MERCADO DE EE. UU.; PRONÓSTICO\n \n
      1. 7.3.1 POR TIPO, 2025-2035 (USD Mil millones)\n \n
      2. 7.3.2 POR APLICACIÓN, 2025-2035 (USD Mil millones)\n \n
      3. 7.3.3 POR USO FINAL, 2025-2035 (USD Mil millones)\n \n
      4. 7.3.4 POR MATERIAL DE REFUERZO, 2025-2035 (USD Mil millones)\n
    134. 7.4 ESTIMACIONES DEL TAMAÑO DEL MERCADO DE CANADÁ; PRONÓSTICO\n \n
      1. 7.4.1 POR TIPO, 2025-2035 (USD Mil millones)\n \n
      2. 7.4.2 POR APLICACIÓN, 2025-2035 (USD Mil millones)\n \n
      3. 7.4.3 POR USO FINAL, 2025-2035 (USD Mil millones)\n \n
      4. 7.4.4 POR MATERIAL DE REFUERZO, 2025-2035 (USD Mil millones)\n
    135. 7.5 ESTIMACIONES DEL TAMAÑO DEL MERCADO DE EUROPA; PRONÓSTICO\n \n
      1. 7.5.1 POR TIPO, 2025-2035 (USD Mil millones)\n \n
      2. 7.5.2 POR APLICACIÓN, 2025-2035 (USD Mil millones)\n \n
      3. 7.5.3 POR USO FINAL, 2025-2035 (USD Mil millones)\n \n
      4. 7.5.4 POR MATERIAL DE REFUERZO, 2025-2035 (USD Mil millones)\n
    136. 7.6 ESTIMACIONES DEL TAMAÑO DEL MERCADO DE ALEMANIA; PRONÓSTICO\n \n
      1. 7.6.1 POR TIPO, 2025-2035 (USD Mil millones)\n \n
      2. 7.6.2 POR APLICACIÓN, 2025-2035 (USD Mil millones)\n \n
      3. 7.6.3 POR USO FINAL, 2025-2035 (USD Mil millones)\n \n
      4. 7.6.4 POR MATERIAL DE REFUERZO, 2025-2035 (USD Mil millones)\n
    137. 7.7 ESTIMACIONES DEL TAMAÑO DEL MERCADO DEL REINO UNIDO; PRONÓSTICO\n \n
      1. 7.7.1 POR TIPO, 2025-2035 (USD Mil millones)\n \n
      2. 7.7.2 POR APLICACIÓN, 2025-2035 (USD Mil millones)\n \n
      3. 7.7.3 POR USO FINAL, 2025-2035 (USD Mil millones)\n \n
      4. 7.7.4 POR MATERIAL DE REFUERZO, 2025-2035 (USD Mil millones)\n
    138. 7.8 ESTIMACIONES DEL TAMAÑO DEL MERCADO DE FRANCIA; PRONÓSTICO\n \n
      1. 7.8.1 POR TIPO, 2025-2035 (USD Mil millones)\n \n
      2. 7.8.2 POR APLICACIÓN, 2025-2035 (USD Mil millones)\n \n
      3. 7.8.3 POR USO FINAL, 2025-2035 (USD Mil millones)\n \n
      4. 7.8.4 POR MATERIAL DE REFUERZO, 2025-2035 (USD Mil millones)\n
    139. 7.9 ESTIMACIONES DEL TAMAÑO DEL MERCADO DE RUSIA; PRONÓSTICO\n \n
      1. 7.9.1 POR TIPO, 2025-2035 (USD Mil millones)\n \n
      2. 7.9.2 POR APLICACIÓN, 2025-2035 (USD Mil millones)\n \n
      3. 7.9.3 POR USO FINAL, 2025-2035 (USD Mil millones)\n \n
      4. 7.9.4 POR MATERIAL DE REFUERZO, 2025-2035 (USD Mil millones)\n
    140. 7.10 ESTIMACIONES DEL TAMAÑO DEL MERCADO DE ITALIA; PRONÓSTICO\n \n
      1. 7.10.1 POR TIPO, 2025-2035 (USD Mil millones)\n \n
      2. 7.10.2 POR APLICACIÓN, 2025-2035 (USD Mil millones)\n \n
      3. 7.10.3 POR USO FINAL, 2025-2035 (USD Mil millones)\n \n
      4. 7.10.4 POR MATERIAL DE REFUERZO, 2025-2035 (USD Mil millones)\n
    141. 7.11 ESTIMACIONES DEL TAMAÑO DEL MERCADO DE ESPAÑA; PRONÓSTICO\n \n
      1. 7.11.1 POR TIPO, 2025-2035 (USD Mil millones)\n \n
      2. 7.11.2 POR APLICACIÓN, 2025-2035 (USD Mil millones)\n \n
      3. 7.11.3 POR USO FINAL, 2025-2035 (USD Mil millones)\n \n
      4. 7.11.4 POR MATERIAL DE REFUERZO, 2025-2035 (USD Mil millones)\n
    142. 7.12 ESTIMACIONES DEL TAMAÑO DEL MERCADO DEL RESTO DE EUROPA; PRONÓSTICO\n \n
      1. 7.12.1 POR TIPO, 2025-2035 (USD Mil millones)\n \n
      2. 7.12.2 POR APLICACIÓN, 2025-2035 (USD Mil millones)\n \n
      3. 7.12.3 POR USO FINAL, 2025-2035 (USD Mil millones)\n \n
      4. 7.12.4 POR MATERIAL DE REFUERZO, 2025-2035 (USD Mil millones)\n
    143. 7.13 ESTIMACIONES DEL TAMAÑO DEL MERCADO DE APAC; PRONÓSTICO\n \n
      1. 7.13.1 POR TIPO, 2025-2035 (USD Mil millones)\n \n
      2. 7.13.2 POR APLICACIÓN, 2025-2035 (USD Mil millones)\n \n
      3. 7.13.3 POR USO FINAL, 2025-2035 (USD Mil millones)\n \n
      4. 7.13.4 POR MATERIAL DE REFUERZO, 2025-2035 (USD Mil millones)\n
    144. 7.14 ESTIMACIONES DEL TAMAÑO DEL MERCADO DE CHINA; PRONÓSTICO\n \n
      1. 7.14.1 POR TIPO, 2025-2035 (USD Mil millones)\n \n
      2. 7.14.2 POR APLICACIÓN, 2025-2035 (USD Mil millones)\n \n
      3. 7.14.3 POR USO FINAL, 2025-2035 (USD Mil millones)\n \n
      4. 7.14.4 POR MATERIAL DE REFUERZO, 2025-2035 (USD Mil millones)\n
    145. 7.15 ESTIMACIONES DEL TAMAÑO DEL MERCADO DE INDIA; PRONÓSTICO\n \n
      1. 7.15.1 POR TIPO, 2025-2035 (USD Mil millones)\n \n
      2. 7.15.2 POR APLICACIÓN, 2025-2035 (USD Mil millones)\n \n
      3. 7.15.3 POR USO FINAL, 2025-2035 (USD Mil millones)\n \n
      4. 7.15.4 POR MATERIAL DE REFUERZO, 2025-2035 (USD Mil millones)\n
    146. 7.16 ESTIMACIONES DEL TAMAÑO DEL MERCADO DE JAPÓN; PRONÓSTICO\n \n
      1. 7.16.1 POR TIPO, 2025-2035 (USD Mil millones)\n \n
      2. 7.16.2 POR APLICACIÓN, 2025-2035 (USD Mil millones)\n \n
      3. 7.16.3 POR USO FINAL, 2025-2035 (USD Mil millones)\n \n
      4. 7.16.4 POR MATERIAL DE REFUERZO, 2025-2035 (USD Mil millones)\n
    147. 7.17 ESTIMACIONES DEL TAMAÑO DEL MERCADO DE COREA DEL SUR; PRONÓSTICO\n \n
      1. 7.17.1 POR TIPO, 2025-2035 (USD Mil millones)\n \n
      2. 7.17.2 POR APLICACIÓN, 2025-2035 (USD Mil millones)\n \n
      3. 7.17.3 POR USO FINAL, 2025-2035 (USD Mil millones)\n \n
      4. 7.17.4 POR MATERIAL DE REFUERZO, 2025-2035 (USD Mil millones)\n
    148. 7.18 ESTIMACIONES DEL TAMAÑO DEL MERCADO DE MALASIA; PRONÓSTICO\n \n
      1. 7.18.1 POR TIPO, 2025-2035 (USD Mil millones)\n \n
      2. 7.18.2 POR APLICACIÓN, 2025-2035 (USD Mil millones)\n \n
      3. 7.18.3 POR USO FINAL, 2025-2035 (USD Mil millones)\n \n
      4. 7.18.4 POR MATERIAL DE REFUERZO, 2025-2035 (USD Mil millones)\n
    149. 7.19 ESTIMACIONES DEL TAMAÑO DEL MERCADO DE TAILANDIA; PRONÓSTICO\n \n
      1. 7.19.1 POR TIPO, 2025-2035 (USD Mil millones)\n \n
      2. 7.19.2 POR APLICACIÓN, 2025-2035 (USD Mil millones)\n \n
      3. 7.19.3 POR USO FINAL, 2025-2035 (USD Mil millones)\n \n
      4. 7.19.4 POR MATERIAL DE REFUERZO, 2025-2035 (USD Mil millones)\n
    150. 7.20 ESTIMACIONES DEL TAMAÑO DEL MERCADO DE INDONESIA; PRONÓSTICO\n \n
      1. 7.20.1 POR TIPO, 2025-2035 (USD Mil millones)\n \n
      2. 7.20.2 POR APLICACIÓN, 2025-2035 (USD Mil millones)\n \n
      3. 7.20.3 POR USO FINAL, 2025-2035 (USD Mil millones)\n \n
      4. 7.20.4 POR MATERIAL DE REFUERZO, 2025-2035 (USD Mil millones)\n
    151. 7.21 ESTIMACIONES DEL TAMAÑO DEL MERCADO DEL RESTO DE APAC; PRONÓSTICO\n \n
      1. 7.21.1 POR TIPO, 2025-2035 (USD Mil millones)\n \n
      2. 7.21.2 POR APLICACIÓN, 2025-2035 (USD Mil millones)\n \n
      3. 7.21.3 POR USO FINAL, 2025-2035 (USD Mil millones)\n \n
      4. 7.21.4 POR MATERIAL DE REFUERZO, 2025-2035 (USD Mil millones)\n
    152. 7.22 ESTIMACIONES DEL TAMAÑO DEL MERCADO DE AMÉRICA DEL SUR; PRONÓSTICO\n \n
      1. 7.22.1 POR TIPO, 2025-2035 (USD Mil millones)\n \n
      2. 7.22.2 POR APLICACIÓN, 2025-2035 (USD Mil millones)\n \n
      3. 7.22.3 POR USO FINAL, 2025-2035 (USD Mil millones)\n \n
      4. 7.22.4 POR MATERIAL DE REFUERZO, 2025-2035 (USD Mil millones)\n
    153. 7.23 ESTIMACIONES DEL TAMAÑO DEL MERCADO DE BRASIL; PRONÓSTICO\n \n
      1. 7.23.1 POR TIPO, 2025-2035 (USD Mil millones)\n \n
      2. 7.23.2 POR APLICACIÓN, 2025-2035 (USD Mil millones)\n \n
      3. 7.23.3 POR USO FINAL, 2025-2035 (USD Mil millones)\n \n
      4. 7.23.4 POR MATERIAL DE REFUERZO, 2025-2035 (USD Mil millones)\n
    154. 7.24 ESTIMACIONES DEL TAMAÑO DEL MERCADO DE MÉXICO; PRONÓSTICO\n \n
      1. 7.24.1 POR TIPO, 2025-2035 (USD Mil millones)\n \n
      2. 7.24.2 POR APLICACIÓN, 2025-2035 (USD Mil millones)\n \n
      3. 7.24.3 POR USO FINAL, 2025-2035 (USD Mil millones)\n \n
      4. 7.24.4 POR MATERIAL DE REFUERZO, 2025-2035 (USD Mil millones)\n
    155. 7.25 ESTIMACIONES DEL TAMAÑO DEL MERCADO DE ARGENTINA; PRONÓSTICO\n \n
      1. 7.25.1 POR TIPO, 2025-2035 (USD Mil millones)\n \n
      2. 7.25.2 POR APLICACIÓN, 2025-2035 (USD Mil millones)\n \n
      3. 7.25.3 POR USO FINAL, 2025-2035 (USD Mil millones)\n \n
      4. 7.25.4 POR MATERIAL DE REFUERZO, 2025-2035 (USD Mil millones)\n
    156. 7.26 ESTIMACIONES DEL TAMAÑO DEL MERCADO DEL RESTO DE AMÉRICA DEL SUR; PRONÓSTICO\n \n
      1. 7.26.1 POR TIPO, 2025-2035 (USD Mil millones)\n \n
      2. 7.26.2 POR APLICACIÓN, 2025-2035 (USD Mil millones)\n \n
      3. 7.26.3 POR USO FINAL, 2025-2035 (USD Mil millones)\n \n
      4. 7.26.4 POR MATERIAL DE REFUERZO, 2025-2035 (USD Mil millones)\n
    157. 7.27 ESTIMACIONES DEL TAMAÑO DEL MERCADO DE MEA; PRONÓSTICO\n \n
      1. 7.27.1 POR TIPO, 2025-2035 (USD Mil millones)\n \n
      2. 7.27.2 POR APLICACIÓN, 2025-2035 (USD Mil millones)\n \n
      3. 7.27.3 POR USO FINAL, 2025-2035 (USD Mil millones)\n \n
      4. 7.27.4 POR MATERIAL DE REFUERZO, 2025-2035 (USD Mil millones)\n
    158. 7.28 ESTIMACIONES DEL TAMAÑO DEL MERCADO DE LOS PAÍSES DEL CCG; PRONÓSTICO\n \n
      1. 7.28.1 POR TIPO, 2025-2035 (USD Mil millones)\n \n
      2. 7.28.2 POR APLICACIÓN, 2025-2035 (USD Mil millones)\n \n
      3. 7.28.3 POR USO FINAL, 2025-2035 (USD Mil millones)\n \n
      4. 7.28.4 POR MATERIAL DE REFUERZO, 2025-2035 (USD Mil millones)\n
    159. 7.29 ESTIMACIONES DEL TAMAÑO DEL MERCADO DE SUDÁFRICA; PRONÓSTICO\n \n
      1. 7.29.1 POR TIPO, 2025-2035 (USD Mil millones)\n \n
      2. 7.29.2 POR APLICACIÓN, 2025-2035 (USD Mil millones)\n \n
      3. 7.29.3 POR USO FINAL, 2025-2035 (USD Mil millones)\n \n
      4. 7.29.4 POR MATERIAL DE REFUERZO, 2025-2035 (USD Mil millones)\n
    160. 7.30 ESTIMACIONES DEL TAMAÑO DEL MERCADO DEL RESTO DE MEA; PRONÓSTICO\n \n
      1. 7.30.1 POR TIPO, 2025-2035 (USD Mil millones)\n \n
      2. 7.30.2 POR APLICACIÓN, 2025-2035 (USD Mil millones)\n \n
      3. 7.30.3 POR USO FINAL, 2025-2035 (USD Mil millones)\n \n
      4. 7.30.4 POR MATERIAL DE REFUERZO, 2025-2035 (USD Mil millones)\n
    161. 7.31 LANZAMIENTO DE PRODUCTO/DESARROLLO/APROBACIÓN\n \n
      1. 7.31.1 \n
    162. 7.32 ADQUISICIÓN/PARTNERSHIP\n \n

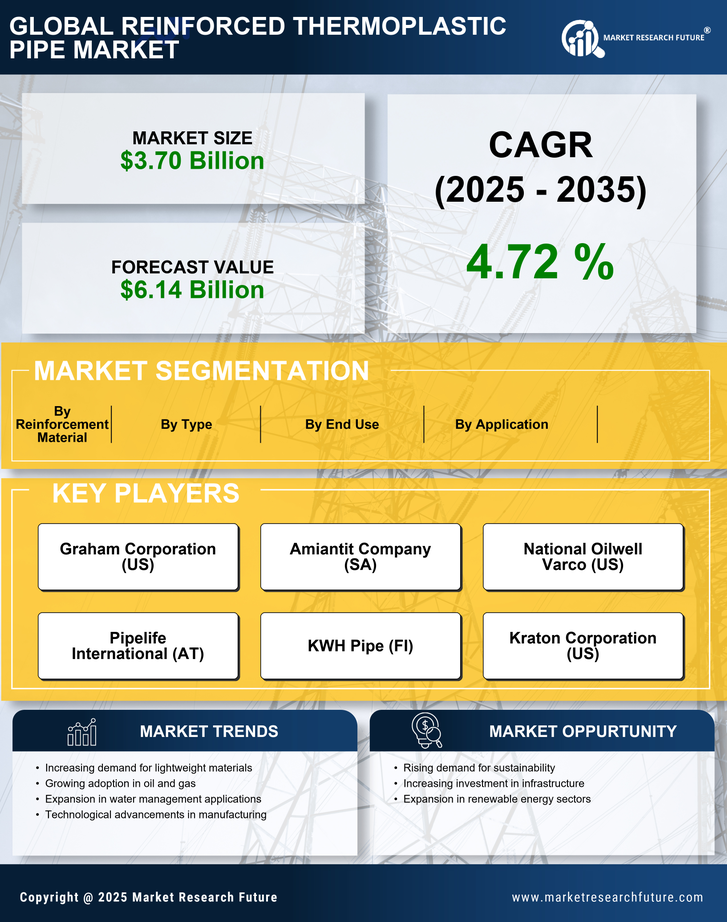
Segmentación del Mercado de Tuberías Termoplásticas Reforzadas


Mercado de Tuberías Termoplásticas Reforzadas por Tipo (USD Mil millones, 2019-2032)

Tubería Termoplástica Reforzada con Fibra Continua

Tubería Termoplástica Reforzada con Fibra Corta

Tubería Compuesta Termoplástica


Mercado de Tuberías Termoplásticas Reforzadas por Aplicación (USD Mil millones, 2019-2032)

Petróleo y Gas

Agua y Aguas Residuales

Procesamiento Químico

Minería

Infraestructura


Mercado de Tuberías Termoplásticas Reforzadas por Uso Final (USD Mil millones, 2019-2032)

Industrial

Residencial

Comercial


Mercado de Tuberías Termoplásticas Reforzadas por Material de Refuerzo (USD Mil millones, 2019-2032)

Fibra de Vidrio

Fibra de Carbono

Fibra Aramida

Fibra de Cáñamo


Mercado de Tuberías Termoplásticas Reforzadas por Región (USD Mil millones, 2019-2032)

América del Norte

Europa

América del Sur

Asia-Pacífico

Medio Oriente y África


Perspectiva Regional del Mercado de Tuberías Termoplásticas Reforzadas (USD Mil millones, 2019-2032)


Perspectiva de América del Norte (USD Mil millones, 2019-2032)

Mercado de Tuberías Termoplásticas Reforzadas de América del Norte por Tipo

Tubería Termoplástica Reforzada con Fibra Continua

Tubería Termoplástica Reforzada con Fibra Corta

Tubería Compuesta Termoplástica

Mercado de Tuberías Termoplásticas Reforzadas de América del Norte por Tipo de Aplicación

Petróleo y Gas

Agua y Aguas Residuales

Procesamiento Químico

Minería

Infraestructura

Mercado de Tuberías Termoplásticas Reforzadas de América del Norte por Tipo de Uso Final

Industrial

Residencial

Comercial

Mercado de Tuberías Termoplásticas Reforzadas de América del Norte por Tipo de Material de Refuerzo

Fibra de Vidrio

Fibra de Carbono

Fibra Aramida

Fibra de Cáñamo

Mercado de Tuberías Termoplásticas Reforzadas de América del Norte por Tipo Regional

EE. UU.

Canadá

Perspectiva de EE. UU. (USD Mil millones, 2019-2032)

Mercado de Tuberías Termoplásticas Reforzadas de EE. UU. por Tipo

Tubería Termoplástica Reforzada con Fibra Continua

Tubería Termoplástica Reforzada con Fibra Corta

Tubería Compuesta Termoplástica

Mercado de Tuberías Termoplásticas Reforzadas de EE. UU. por Tipo de Aplicación

Petróleo y Gas

Agua y Aguas Residuales

Procesamiento Químico

Minería

Infraestructura

Mercado de Tuberías Termoplásticas Reforzadas de EE. UU. por Tipo de Uso Final

Industrial

Residencial

Comercial

Mercado de Tuberías Termoplásticas Reforzadas de EE. UU. por Tipo de Material de Refuerzo

Fibra de Vidrio

Fibra de Carbono

Fibra Aramida

Fibra de Cáñamo

Perspectiva de CANADÁ (USD Mil millones, 2019-2032)

Mercado de Tuberías Termoplásticas Reforzadas de CANADÁ por Tipo

Tubería Termoplástica Reforzada con Fibra Continua

Tubería Termoplástica Reforzada con Fibra Corta

Tubería Compuesta Termoplástica

Mercado de Tuberías Termoplásticas Reforzadas de CANADÁ por Tipo de Aplicación

Petróleo y Gas

Agua y Aguas Residuales

Procesamiento Químico

Minería

Infraestructura

Mercado de Tuberías Termoplásticas Reforzadas de CANADÁ por Tipo de Uso Final

Industrial

Residencial

Comercial

Mercado de Tuberías Termoplásticas Reforzadas de CANADÁ por Tipo de Material de Refuerzo

Fibra de Vidrio

Fibra de Carbono

Fibra Aramida

Fibra de Cáñamo

Perspectiva de Europa (USD Mil millones, 2019-2032)

Mercado de Tuberías Termoplásticas Reforzadas de Europa por Tipo

Tubería Termoplástica Reforzada con Fibra Continua

Tubería Termoplástica Reforzada con Fibra Corta

Tubería Compuesta Termoplástica

Mercado de Tuberías Termoplásticas Reforzadas de Europa por Tipo de Aplicación

Petróleo y Gas

Agua y Aguas Residuales

Procesamiento Químico

Minería

Infraestructura

Mercado de Tuberías Termoplásticas Reforzadas de Europa por Tipo de Uso Final

Industrial

Residencial

Comercial

Mercado de Tuberías Termoplásticas Reforzadas de Europa por Tipo de Material de Refuerzo

Fibra de Vidrio

Fibra de Carbono

Fibra Aramida

Fibra de Cáñamo

Mercado de Tuberías Termoplásticas Reforzadas de Europa por Tipo Regional

Alemania

Reino Unido

Francia

Rusia

Italia

España

Resto de Europa

Perspectiva de ALEMANIA (USD Mil millones, 2019-2032)

Mercado de Tuberías Termoplásticas Reforzadas de ALEMANIA por Tipo

Tubería Termoplástica Reforzada con Fibra Continua

Tubería Termoplástica Reforzada con Fibra Corta

Tubería Compuesta Termoplástica

Mercado de Tuberías Termoplásticas Reforzadas de ALEMANIA por Tipo de Aplicación

Petróleo y Gas

Agua y Aguas Residuales

Procesamiento Químico

Minería

Infraestructura

Mercado de Tuberías Termoplásticas Reforzadas de ALEMANIA por Tipo de Uso Final

Industrial

Residencial

Comercial

Mercado de Tuberías Termoplásticas Reforzadas de ALEMANIA por Tipo de Material de Refuerzo

Fibra de Vidrio

Fibra de Carbono

Fibra Aramida

Fibra de Cáñamo

Perspectiva del REINO UNIDO (USD Mil millones, 2019-2032)

Mercado de Tuberías Termoplásticas Reforzadas del REINO UNIDO por Tipo

Tubería Termoplástica Reforzada con Fibra Continua

Tubería Termoplástica Reforzada con Fibra Corta

Tubería Compuesta Termoplástica

Mercado de Tuberías Termoplásticas Reforzadas del REINO UNIDO por Tipo de Aplicación

Petróleo y Gas

Agua y Aguas Residuales

Procesamiento Químico

Minería

Infraestructura

Mercado de Tuberías Termoplásticas Reforzadas del REINO UNIDO por Tipo de Uso Final

Industrial

Residencial

Comercial

Mercado de Tuberías Termoplásticas Reforzadas del REINO UNIDO por Tipo de Material de Refuerzo

Fibra de Vidrio

Fibra de Carbono

Fibra Aramida

Fibra de Cáñamo

Perspectiva de FRANCIA (USD Mil millones, 2019-2032)

Mercado de Tuberías Termoplásticas Reforzadas de FRANCIA por Tipo

Tubería Termoplástica Reforzada con Fibra Continua

Tubería Termoplástica Reforzada con Fibra Corta

Tubería Compuesta Termoplástica

Mercado de Tuberías Termoplásticas Reforzadas de FRANCIA por Tipo de Aplicación

Petróleo y Gas

Agua y Aguas Residuales

Procesamiento Químico

Minería

Infraestructura

Mercado de Tuberías Termoplásticas Reforzadas de FRANCIA por Tipo de Uso Final

Industrial

Residencial

Comercial

Mercado de Tuberías Termoplásticas Reforzadas de FRANCIA por Tipo de Material de Refuerzo

Fibra de Vidrio

Fibra de Carbono

Fibra Aramida

Fibra de Cáñamo

Perspectiva de RUSIA (USD Mil millones, 2019-2032)

Mercado de Tuberías Termoplásticas Reforzadas de RUSIA por Tipo

Tubería Termoplástica Reforzada con Fibra Continua

Tubería Termoplástica Reforzada con Fibra Corta

Tubería Compuesta Termoplástica

Mercado de Tuberías Termoplásticas Reforzadas de RUSIA por Tipo de Aplicación

Petróleo y Gas

Agua y Aguas Residuales

Procesamiento Químico

Minería

Infraestructura

Mercado de Tuberías Termoplásticas Reforzadas de RUSIA por Tipo de Uso Final

Industrial

Residencial

Comercial

Mercado de Tuberías Termoplásticas Reforzadas de RUSIA por Tipo de Material de Refuerzo

Fibra de Vidrio

Fibra de Carbono

Fibra Aramida

Fibra de Cáñamo

Perspectiva de ITALIA (USD Mil millones, 2019-2032)

Mercado de Tuberías Termoplásticas Reforzadas de ITALIA por Tipo

Tubería Termoplástica Reforzada con Fibra Continua

Tubería Termoplástica Reforzada con Fibra Corta

Tubería Compuesta Termoplástica

Mercado de Tuberías Termoplásticas Reforzadas de ITALIA por Tipo de Aplicación

Petróleo y Gas

Agua y Aguas Residuales

Procesamiento Químico

Minería

Infraestructura

Mercado de Tuberías Termoplásticas Reforzadas de ITALIA por Tipo de Uso Final

Industrial

Residencial

Comercial

Mercado de Tuberías Termoplásticas Reforzadas de ITALIA por Tipo de Material de Refuerzo

Fibra de Vidrio

Fibra de Carbono

Fibra Aramida

Fibra de Cáñamo

Perspectiva de ESPAÑA (USD Mil millones, 2019-2032)

Mercado de Tuberías Termoplásticas Reforzadas de ESPAÑA por Tipo

Tubería Termoplástica Reforzada con Fibra Continua

Tubería Termoplástica Reforzada con Fibra Corta

Tubería Compuesta Termoplástica

Mercado de Tuberías Termoplásticas Reforzadas de ESPAÑA por Tipo de Aplicación

Petróleo y Gas

Agua y Aguas Residuales

Procesamiento Químico

Minería

Infraestructura

Mercado de Tuberías Termoplásticas Reforzadas de ESPAÑA por Tipo de Uso Final

Industrial

Residencial

Comercial

Mercado de Tuberías Termoplásticas Reforzadas de ESPAÑA por Tipo de Material de Refuerzo

Fibra de Vidrio

Fibra de Carbono

Fibra Aramida

Fibra de Cáñamo

Perspectiva del RESTO DE EUROPA (USD Mil millones, 2019-2032)

Mercado de Tuberías Termoplásticas Reforzadas del RESTO DE EUROPA por Tipo

Tubería Termoplástica Reforzada con Fibra Continua

Tubería Termoplástica Reforzada con Fibra Corta

Tubería Compuesta Termoplástica

Mercado de Tuberías Termoplásticas Reforzadas del RESTO DE EUROPA por Tipo de Aplicación

Petróleo y Gas

Agua y Aguas Residuales

Procesamiento Químico

Minería

Infraestructura

Mercado de Tuberías Termoplásticas Reforzadas del RESTO DE EUROPA por Tipo de Uso Final

Industrial

Residencial

Comercial

Mercado de Tuberías Termoplásticas Reforzadas del RESTO DE EUROPA por Tipo de Material de Refuerzo

Fibra de Vidrio

Fibra de Carbono

Fibra Aramida

Fibra de Cáñamo

Perspectiva de APAC (USD Mil millones, 2019-2032)

Mercado de Tuberías Termoplásticas Reforzadas de APAC por Tipo

Tubería Termoplástica Reforzada con Fibra Continua

Tubería Termoplástica Reforzada con Fibra Corta

Tubería Compuesta Termoplástica

Mercado de Tuberías Termoplásticas Reforzadas de APAC por Tipo de Aplicación

Petróleo y Gas

Agua y Aguas Residuales

Procesamiento Químico

Minería

Infraestructura

Mercado de Tuberías Termoplásticas Reforzadas de APAC por Tipo de Uso Final

Industrial

Residencial

Comercial

Mercado de Tuberías Termoplásticas Reforzadas de APAC por Tipo de Material de Refuerzo

Fibra de Vidrio

Fibra de Carbono

Fibra Aramida

Fibra de Cáñamo

Mercado de Tuberías Termoplásticas Reforzadas de APAC por Tipo Regional

China

India

Japón

Corea del Sur

Malasia

Tailandia

Indonesia

Resto de APAC

Perspectiva de CHINA (USD Mil millones, 2019-2032)

Mercado de Tuberías Termoplásticas Reforzadas de CHINA por Tipo

Tubería Termoplástica Reforzada con Fibra Continua

Tubería Termoplástica Reforzada con Fibra Corta

Tubería Compuesta Termoplástica

Mercado de Tuberías Termoplásticas Reforzadas de CHINA por Tipo de Aplicación

Petróleo y Gas

Agua y Aguas Residuales

Procesamiento Químico

Minería

Infraestructura

Mercado de Tuberías Termoplásticas Reforzadas de CHINA por Tipo de Uso Final

Industrial

Residencial

Comercial

Mercado de Tuberías Termoplásticas Reforzadas de CHINA por Tipo de Material de Refuerzo

Fibra de Vidrio

Fibra de Carbono

Fibra Aramida

Fibra de Cáñamo

Perspectiva de INDIA (USD Mil millones, 2019-2032)

Mercado de Tuberías Termoplásticas Reforzadas de INDIA por Tipo

Tubería Termoplástica Reforzada con Fibra Continua

Tubería Termoplástica Reforzada con Fibra Corta

Tubería Compuesta Termoplástica

Mercado de Tuberías Termoplásticas Reforzadas de INDIA por Tipo de Aplicación

Petróleo y Gas

Agua y Aguas Residuales

Procesamiento Químico

Minería

Infraestructura

Mercado de Tuberías Termoplásticas Reforzadas de INDIA por Tipo de Uso Final

Industrial

Residencial

Comercial

Mercado de Tuberías Termoplásticas Reforzadas de INDIA por Tipo de Material de Refuerzo

Fibra de Vidrio

Fibra de Carbono

Fibra Aramida

Fibra de Cáñamo

Perspectiva de JAPÓN (USD Mil millones, 2019-2032)

Mercado de Tuberías Termoplásticas Reforzadas de JAPÓN por Tipo

Tubería Termoplástica Reforzada con Fibra Continua

Tubería Termoplástica Reforzada con Fibra Corta

Tubería Compuesta Termoplástica

Mercado de Tuberías Termoplásticas Reforzadas de JAPÓN por Tipo de Aplicación

Petróleo y Gas

Agua y Aguas Residuales

Procesamiento Químico

Minería

Infraestructura

Mercado de Tuberías Termoplásticas Reforzadas de JAPÓN por Tipo de Uso Final

Industrial

Residencial

Comercial

Mercado de Tuberías Termoplásticas Reforzadas de JAPÓN por Tipo de Material de Refuerzo

Fibra de Vidrio

Fibra de Carbono

Fibra Aramida

Fibra de Cáñamo

Perspectiva de COREA DEL SUR (USD Mil millones, 2019-2032)

Mercado de Tuberías Termoplásticas Reforzadas de COREA DEL SUR por Tipo

Tubería Termoplástica Reforzada con Fibra Continua

Tubería Termoplástica Reforzada con Fibra Corta

Tubería Compuesta Termoplástica

Mercado de Tuberías Termoplásticas Reforzadas de COREA DEL SUR por Tipo de Aplicación

Petróleo y Gas

Agua y Aguas Residuales

Procesamiento Químico

Minería

Infraestructura

Mercado de Tuberías Termoplásticas Reforzadas de COREA DEL SUR por Tipo de Uso Final

Industrial

Residencial

Comercial

Mercado de Tuberías Termoplásticas Reforzadas de COREA DEL SUR por Tipo de Material de Refuerzo

Fibra de Vidrio

Fibra de Carbono

Fibra Aramida

Fibra de Cáñamo

Perspectiva de MALASIA (USD Mil millones, 2019-2032)

Mercado de Tuberías Termoplásticas Reforzadas de MALASIA por Tipo

Tubería Termoplástica Reforzada con Fibra Continua

Tubería Termoplástica Reforzada con Fibra Corta

Tubería Compuesta Termoplástica

Mercado de Tuberías Termoplásticas Reforzadas de MALASIA por Tipo de Aplicación

Petróleo y Gas

Agua y Aguas Residuales

Procesamiento Químico

Minería

Infraestructura

Mercado de Tuberías Termoplásticas Reforzadas de MALASIA por Tipo de Uso Final

Industrial

Residencial

Comercial

Mercado de Tuberías Termoplásticas Reforzadas de MALASIA por Tipo de Material de Refuerzo

Fibra de Vidrio

Fibra de Carbono

Fibra Aramida

Fibra de Cáñamo

Perspectiva de TAILANDIA (USD Mil millones, 2019-2032)

Mercado de Tuberías Termoplásticas Reforzadas de TAILANDIA por Tipo

Tubería Termoplástica Reforzada con Fibra Continua

Tubería Termoplástica Reforzada con Fibra Corta

Tubería Compuesta Termoplástica

Mercado de Tuberías Termoplásticas Reforzadas de TAILANDIA por Tipo de Aplicación

Petróleo y Gas

Agua y Aguas Residuales

Procesamiento Químico

Minería

Infraestructura

Mercado de Tuberías Termoplásticas Reforzadas de TAILANDIA por Tipo de Uso Final

Industrial

Residencial

Comercial

Mercado de Tuberías Termoplásticas Reforzadas de TAILANDIA por Tipo de Material de Refuerzo

Fibra de Vidrio

Fibra de Carbono

Fibra Aramida

Fibra de Cáñamo

Perspectiva de INDONESIA (USD Mil millones, 2019-2032)

Mercado de Tuberías Termoplásticas Reforzadas de INDONESIA por Tipo

Tubería Termoplástica Reforzada con Fibra Continua

Tubería Termoplástica Reforzada con Fibra Corta

Tubería Compuesta Termoplástica

Mercado de Tuberías Termoplásticas Reforzadas de INDONESIA por Tipo de Aplicación

Petróleo y Gas

Agua y Aguas Residuales

Procesamiento Químico

Minería

Infraestructura

Mercado de Tuberías Termoplásticas Reforzadas de INDONESIA por Tipo de Uso Final

Industrial

Residencial

Comercial

Mercado de Tuberías Termoplásticas Reforzadas de INDONESIA por Tipo de Material de Refuerzo

Fibra de Vidrio

Fibra de Carbono

Fibra Aramida

Fibra de Cáñamo

Perspectiva del RESTO DE APAC (USD Mil millones, 2019-2032)

Mercado de Tuberías Termoplásticas Reforzadas del RESTO DE APAC por Tipo

Tubería Termoplástica Reforzada con Fibra Continua

Tubería Termoplástica Reforzada con Fibra Corta

Tubería Compuesta Termoplástica

Mercado de Tuberías Termoplásticas Reforzadas del RESTO DE APAC por Tipo de Aplicación

Petróleo y Gas

Agua y Aguas Residuales

Procesamiento Químico

Minería

Infraestructura

Mercado de Tuberías Termoplásticas Reforzadas del RESTO DE APAC por Tipo de Uso Final

Industrial

Residencial

Comercial

Mercado de Tuberías Termoplásticas Reforzadas del RESTO DE APAC por Tipo de Material de Refuerzo

Fibra de Vidrio

Fibra de Carbono

Fibra Aramida

Fibra de Cáñamo

Perspectiva de América del Sur (USD Mil millones, 2019-2032)

Mercado de Tuberías Termoplásticas Reforzadas de América del Sur por Tipo

Tubería Termoplástica Reforzada con Fibra Continua

Tubería Termoplástica Reforzada con Fibra Corta

Tubería Compuesta Termoplástica

Mercado de Tuberías Termoplásticas Reforzadas de América del Sur por Tipo de Aplicación

Petróleo y Gas

Agua y Aguas Residuales

Procesamiento Químico

Minería

Infraestructura

Mercado de Tuberías Termoplásticas Reforzadas de América del Sur por Tipo de Uso Final

Industrial

Residencial

Comercial

Mercado de Tuberías Termoplásticas Reforzadas de América del Sur por Tipo de Material de Refuerzo

Fibra de Vidrio

Fibra de Carbono

Fibra Aramida

Fibra de Cáñamo

Mercado de Tuberías Termoplásticas Reforzadas de América del Sur por Tipo Regional

Brasil

México

Argentina

Resto de América del Sur

Perspectiva de BRASIL (USD Mil millones, 2019-2032)

Mercado de Tuberías Termoplásticas Reforzadas de BRASIL por Tipo

Tubería Termoplástica Reforzada con Fibra Continua

Tubería Termoplástica Reforzada con Fibra Corta

Tubería Compuesta Termoplástica

Mercado de Tuberías Termoplásticas Reforzadas de BRASIL por Tipo de Aplicación

Petróleo y Gas

Agua y Aguas Residuales

Procesamiento Químico

Minería

Infraestructura

Mercado de Tuberías Termoplásticas Reforzadas de BRASIL por Tipo de Uso Final

Industrial

Residencial

Comercial

Mercado de Tuberías Termoplásticas Reforzadas de BRASIL por Tipo de Material de Refuerzo

Fibra de Vidrio

Fibra de Carbono

Fibra Aramida

Fibra de Cáñamo

Perspectiva de MÉXICO (USD Mil millones, 2019-2032)

Mercado de Tuberías Termoplásticas Reforzadas de MÉXICO por Tipo

Tubería Termoplástica Reforzada con Fibra Continua

Tubería Termoplástica Reforzada con Fibra Corta

Tubería Compuesta Termoplástica

Mercado de Tuberías Termoplásticas Reforzadas de MÉXICO por Tipo de Aplicación

Petróleo y Gas

Agua y Aguas Residuales

Procesamiento Químico

Minería

Infraestructura

Mercado de Tuberías Termoplásticas Reforzadas de MÉXICO por Tipo de Uso Final

Industrial

Residencial

Comercial

Mercado de Tuberías Termoplásticas Reforzadas de MÉXICO por Tipo de Material de Refuerzo

Fibra de Vidrio

Fibra de Carbono

Fibra Aramida

Fibra de Cáñamo

Perspectiva de ARGENTINA (USD Mil millones, 2019-2032)

Mercado de Tuberías Termoplásticas Reforzadas de ARGENTINA por Tipo

Tubería Termoplástica Reforzada con Fibra Continua

Tubería Termoplástica Reforzada con Fibra Corta

Tubería Compuesta Termoplástica

Mercado de Tuberías Termoplásticas Reforzadas de ARGENTINA por Tipo de Aplicación

Petróleo y Gas

Agua y Aguas Residuales

Procesamiento Químico

Minería

Infraestructura

Mercado de Tuberías Termoplásticas Reforzadas de ARGENTINA por Tipo de Uso Final

Industrial

Residencial

Comercial

Mercado de Tuberías Termoplásticas Reforzadas de ARGENTINA por Tipo de Material de Refuerzo

Fibra de Vidrio

Fibra de Carbono

Fibra Aramida

Fibra de Cáñamo

Perspectiva del RESTO DE AMÉRICA DEL SUR (USD Mil millones, 2019-2032)

Mercado de Tuberías Termoplásticas Reforzadas del RESTO DE AMÉRICA DEL SUR por Tipo

Tubería Termoplástica Reforzada con Fibra Continua

Tubería Termoplástica Reforzada con Fibra Corta

Tubería Compuesta Termoplástica

Mercado de Tuberías Termoplásticas Reforzadas del RESTO DE AMÉRICA DEL SUR por Tipo de Aplicación

Petróleo y Gas

Agua y Aguas Residuales

Procesamiento Químico

Minería

Infraestructura

Mercado de Tuberías Termoplásticas Reforzadas del RESTO DE AMÉRICA DEL SUR por Tipo de Uso Final

Industrial

Residencial

Comercial

Mercado de Tuberías Termoplásticas Reforzadas del RESTO DE AMÉRICA DEL SUR por Tipo de Material de Refuerzo

Fibra de Vidrio

Fibra de Carbono

Fibra Aramida

Fibra de Cáñamo

Perspectiva de MEA (USD Mil millones, 2019-2032)

Mercado de Tuberías Termoplásticas Reforzadas de MEA por Tipo

Tubería Termoplástica Reforzada con Fibra Continua

Tubería Termoplástica Reforzada con Fibra Corta

Tubería Compuesta Termoplástica

Mercado de Tuberías Termoplásticas Reforzadas de MEA por Tipo de Aplicación

Petróleo y Gas

Agua y Aguas Residuales

Procesamiento Químico

Minería

Infraestructura

Mercado de Tuberías Termoplásticas Reforzadas de MEA por Tipo de Uso Final

Industrial

Residencial

Comercial

Mercado de Tuberías Termoplásticas Reforzadas de MEA por Tipo de Material de Refuerzo

Fibra de Vidrio

Fibra de Carbono

Fibra Aramida

Fibra de Cáñamo

Mercado de Tuberías Termoplásticas Reforzadas de MEA por Tipo Regional

Países del CCG

Sudáfrica

Resto de MEA

Perspectiva de PAÍSES DEL CCG (USD Mil millones, 2019-2032)

Mercado de Tuberías Termoplásticas Reforzadas de PAÍSES DEL CCG por Tipo

Tubería Termoplástica Reforzada con Fibra Continua

Tubería Termoplástica Reforzada con Fibra Corta

Tubería Compuesta Termoplástica

Mercado de Tuberías Termoplásticas Reforzadas de PAÍSES DEL CCG por Tipo de Aplicación

Petróleo y Gas

Agua y Aguas Residuales

Procesamiento Químico

Minería

Infraestructura

Mercado de Tuberías Termoplásticas Reforzadas de PAÍSES DEL CCG por Tipo de Uso Final

Industrial

Residencial

Comercial

Mercado de Tuberías Termoplásticas Reforzadas de PAÍSES DEL CCG por Tipo de Material de Refuerzo

Fibra de Vidrio

Fibra de Carbono

Fibra Aramida

Fibra de Cáñamo

Perspectiva de SUDÁFRICA (USD Mil millones, 2019-2032)

Mercado de Tuberías Termoplásticas Reforzadas de SUDÁFRICA por Tipo

Tubería Termoplástica Reforzada con Fibra Continua

Tubería Termoplástica Reforzada con Fibra Corta

Tubería Compuesta Termoplástica

Mercado de Tuberías Termoplásticas Reforzadas de SUDÁFRICA por Tipo de Aplicación

Petróleo y Gas

Agua y Aguas Residuales

Procesamiento Químico

Minería

Infraestructura

Mercado de Tuberías Termoplásticas Reforzadas de SUDÁFRICA por Tipo de Uso Final

Industrial

Residencial

Comercial

Mercado de Tuberías Termoplásticas Reforzadas de SUDÁFRICA por Tipo de Material de Refuerzo

Fibra de Vidrio

Fibra de Carbono

Fibra Aramida

Fibra de Cáñamo

Perspectiva del RESTO DE MEA (USD Mil millones, 2019-2032)

Mercado de Tuberías Termoplásticas Reforzadas del RESTO DE MEA por Tipo

Tubería Termoplástica Reforzada con Fibra Continua

Tubería Termoplástica Reforzada con Fibra Corta

Tubería Compuesta Termoplástica

Mercado de Tuberías Termoplásticas Reforzadas del RESTO DE MEA por Tipo de Aplicación

Petróleo y Gas

Agua y Aguas Residuales

Procesamiento Químico

Minería

Infraestructura

Mercado de Tuberías Termoplásticas Reforzadas del RESTO DE MEA por Tipo de Uso Final

Industrial

Residencial

Comercial

Mercado de Tuberías Termoplásticas Reforzadas del RESTO DE MEA por Tipo de Material de Refuerzo

Fibra de Vidrio

Fibra de Carbono

Fibra Aramida

Fibra de Cáñamo


Compare Licence

×
Features License Type
Single User Multiuser License Enterprise User
Price $4,950 $5,950 $7,250
Maximum User Access Limit 1 User Upto 10 Users Unrestricted Access Throughout the Organization
Free Customization
Direct Access to Analyst
Deliverable Format
Platform Access
Discount on Next Purchase 10% 15% 15%
Printable Versions