Request Free Sample ×

Kindly complete the form below to receive a free sample of this Report

* Please use a valid business email

Leading companies partner with us for data-driven Insights

clients tt-cursor
Hero Background

IT Asset Management Software Market

ID: MRFR/ICT/0415-CR
143 Pages
Ankit Gupta
Last Updated: May 02, 2026

Informe de investigación de mercado del software de gestión de activos de TI: pronóstico global hasta 2032

Compartir
Download PDF ×

We do not share your information with anyone. However, we may send you emails based on your report interest from time to time. You may contact us at any time to opt-out.

  1. 1 RESUMEN EJECUTIVO 15
  2. 1.1.1 MERCADO GLOBAL DE SOFTWARE DE GESTIÓN DE ACTIVOS DE TI, POR COMPONENTE 17
  3. 1.1.2 MERCADO GLOBAL DE SOFTWARE DE GESTIÓN DE ACTIVOS DE TI, POR TAMAÑO DE LA ORGANIZACIÓN 18
  4. 1.1.3 MERCADO GLOBAL DE SOFTWARE DE GESTIÓN DE ACTIVOS DE TI, POR USUARIO FINAL 19
  5. 1.1.4 MERCADO GLOBAL DE SOFTWARE DE GESTIÓN DE ACTIVOS DE TI, POR TIPO DE IMPLEMENTACIÓN 20
  6. 1.1.5 MERCADO GLOBAL DE SOFTWARE DE GESTIÓN DE ACTIVOS DE TI, POR HERRAMIENTAS 21
  7. 1.1.6 MERCADO GLOBAL DE SOFTWARE DE GESTIÓN DE ACTIVOS DE TI, POR REGIÓN 22
  8. 2 INTRODUCCIÓN AL MERCADO 23
    1. 2.1 DEFINICIÓN 23
    2. 2.2 ALCANCE DEL ESTUDIO 23
    3. 2.3 ESTRUCTURA DEL MERCADO 23
  9. 3 METODOLOGÍA DE LA INVESTIGACIÓN 24
    1. 3.1 PROCESO DE INVESTIGACIÓN 24
    2. 3.2 INVESTIGACIÓN PRIMARIA 25
    3. 3.3 INVESTIGACIÓN SECUNDARIA 26
    4. 3.4 ESTIMACIÓN DEL TAMAÑO DEL MERCADO 26
    5. 3.5 ESTUDIO DE ARRIBA HACIA ABAJO Y ENFOQUE DE ABAJO HACIA ARRIBA 27
    6. 3.6 MODELO DE PRONÓSTICO 28
    7. 3.7 LISTA DE SUPUESTOS 29
  10. 4 DINÁMICA DEL MERCADO 30
    1. 4.1 IMPULSORES 30
      1. 4.1.1 CRECIENTE NECESIDAD DE CENTRALIZACIÓN Y AUTOMATIZACIÓN EN LA INFRAESTRUCTURA DE TI 30
      2. 4.1.2 CRECIENTE ENFOQUE EN COSTOS, CUMPLIMIENTO Y SEGURIDAD RELACIONADOS CON LOS ACTIVOS 31
      3. 4.1.3 ANÁLISIS DE IMPACTO DE LOS IMPULSORES 32
    2. 4.2 RESTRICCIONES 32
      1. 4.2.1 ALTOS COSTOS REQUERIDOS PARA LA IMPLEMENTACIÓN 32
      2. 4.2.2 LA FALTA DE MANO DE OBRA CALIFICADA Y LA DEFICIENTE GESTIÓN REPRESENTAN UN DESAFÍO IMPORTANTE PARA EL CRECIMIENTO DEL MERCADO 33
      3. 4.2.3 ANÁLISIS DEL IMPACTO DE LAS RESTRICCIONES 33
    3. 4.3 OPORTUNIDADES 34
      1. 4.3.1 ADOPCIÓN CRECIENTE DE SOLUCIONES DE GESTIÓN DE ACTIVOS DE TI BASADAS EN LA NUBE E INTRODUCCIÓN DE M2M E IOT 34
  11. 5 ANÁLISIS DE FACTORES DE MERCADO 35
    1. 5.1 ANÁLISIS DE LA CADENA DE VALOR 35
      1. 5.1.1 DISEÑADORES DE SOFTWARE Y DESARROLLADORES 35
      2. 5.1.2 INTEGRADORES DE SISTEMAS 36
      3. 5.1.3 ENSAMBLAJE DE USUARIO FINAL 36
    2. 5.2 MODELO DE LAS CINCO FUERZAS DE PORTER 37
      1. 5.2.1 AMENAZA DE NUEVOS ENTRANTES 37
      2. 5.2.2 PODER DE NEGOCIACIÓN DE LOS PROVEEDORES 38
      3. 5.2.3 AMENAZA DE SUSTITUTOS 38
      4. 5.2.4 PODER DE NEGOCIACIÓN DE LOS COMPRADORES 38
      5. 5.2.5 INTENSIDAD DE LA RIVALIDAD 38
    3. 5.3 IMPACTO DE LA COVID-19 39
      1. 5.3.1 IMPACTO EN LA DEMANDA DEL SOFTWARE EN VARIAS VERTICALES DE LA INDUSTRIA 39
      2. 5.3.2 IMPACTO EN LA DEMANDA DEL SOFTWARE EN VARIAS INDUSTRIA VERTICAL 39
      3. 5.3.3 IMPACTO EN LA DEMANDA DEL SOFTWARE EN LAS REGIONES 40
  12. 6 MERCADO GLOBAL DE SOFTWARE DE GESTIÓN DE ACTIVOS DE TI, POR COMPONENTE 41
    1. 6.1 DESCRIPCIÓN GENERAL 41
      1. 6.1.1 ESTIMACIONES Y PRONÓSTICOS DEL MERCADO GLOBAL DE SOFTWARE DE GESTIÓN DE ACTIVOS DE TI, POR COMPONENTE, 2018-2030 41
    2. 6.2 SOFTWARE 42
      1. 6.2.1 SOFTWARE: ESTIMACIONES Y PRONÓSTICOS DEL MERCADO, POR REGIÓN, 2018-2030 42
    3. 6.3 SERVICIOS 43
      1. 6.3.1 SERVICIOS: ESTIMACIONES Y PRONÓSTICOS DEL MERCADO PRONÓSTICO, POR REGIÓN, 2018-2030 43
  13. 7 MERCADO GLOBAL DE SOFTWARE DE GESTIÓN DE ACTIVOS DE TI, POR TAMAÑO DE ORGANIZACIÓN 44
    1. 7.1 DESCRIPCIÓN GENERAL 44
      1. 7.1.1 ESTIMACIONES Y PRONÓSTICOS DEL MERCADO GLOBAL DE SOFTWARE DE GESTIÓN DE ACTIVOS DE TI, POR TAMAÑO DE ORGANIZACIÓN, 2018-2030 44
    2. 7.2 PYME 45
      1. 7.2.1 PYME: ESTIMACIONES Y PRONÓSTICOS DEL MERCADO, POR REGIÓN, 2018-2030 45
    3. 7.3 GRAN EMPRESA 46
      1. 7.3.1 GRANDES EMPRESAS: ESTIMACIONES Y PRONÓSTICOS DEL MERCADO PRONÓSTICO, POR REGIÓN, 2018-2030 46
  14. 8 MERCADO GLOBAL DE SOFTWARE DE GESTIÓN DE ACTIVOS DE TI, POR TIPO DE IMPLEMENTACIÓN 47
    1. 8.1 DESCRIPCIÓN GENERAL 47
      1. 8.1.1 ESTIMACIONES Y PRONÓSTICOS DEL MERCADO GLOBAL DE SOFTWARE DE GESTIÓN DE ACTIVOS DE TI, POR TIPO DE IMPLEMENTACIÓN, 2018-2030 47
    2. 8.2 EN LA NUBE 48
      1. 8.2.1 EN LA NUBE: ESTIMACIONES Y PRONÓSTICOS DEL MERCADO, POR REGIÓN, 2018-2030 48
    3. 8.3 EN LAS INSTALACIONES 49
      1. 8.3.1 EN LAS INSTALACIONES: ESTIMACIONES Y PRONÓSTICOS DEL MERCADO PRONÓSTICO, POR REGIÓN, 2018-2030 49
  15. 9 MERCADO GLOBAL DE SOFTWARE DE GESTIÓN DE ACTIVOS DE TI, POR USUARIO FINAL 50
    1. 9.1 DESCRIPCIÓN GENERAL 50
      1. 9.1.1 ESTIMACIONES Y PRONÓSTICOS DEL MERCADO GLOBAL DE SOFTWARE DE GESTIÓN DE ACTIVOS DE TI, POR USUARIO FINAL, 2018-2030 50
    2. 9.2 SERVICIOS BANCARIOS Y FINANCIEROS 51
      1. 9.2.1 SERVICIOS BANCARIOS Y FINANCIEROS: ESTIMACIONES Y PRONÓSTICOS DEL MERCADO, POR REGIÓN, 2018-2030 51
    3. 9.3 VENTA MINORISTA 51
      1. 9.3.1 VENTA MINORISTA: ESTIMACIONES Y PRONÓSTICOS DEL MERCADO PRONÓSTICO, POR REGIÓN, 2018-2030 51
    4. 9.4 AEROESPACIAL Y DEFENSA 52
      1. 9.4.1 AEROESPACIAL Y DEFENSA: ESTIMACIONES DE MERCADO Y PRONÓSTICO, POR REGIÓN, 2018-2030 52
    5. 9.5 TI Y TELECOMUNICACIONES 52
      1. 9.5.1 TI Y TELECOMUNICACIONES: ESTIMACIONES DE MERCADO Y PRONÓSTICO, POR REGIÓN, 2018-2030 52
    6. 9.6 ENERGÍA Y ENERGÍA 53
      1. 9.6.1 ENERGÍA Y ENERGÍA: ESTIMACIONES DE MERCADO Y PRONÓSTICO, POR REGIÓN, 2018-2030 53
    7. 9.7 AUTOMOTRIZ Y TRANSPORTE 54
      1. 9.7.1 AUTOMOCIÓN Y TRANSPORTE: ESTIMACIONES DE MERCADO Y PRONÓSTICOS, POR REGIÓN, 2018-2030 54
    8. 9.8 OTROS 54
      1. 9.8.1 OTROS: ESTIMACIONES DE MERCADO Y PRONÓSTICOS, POR REGIÓN, 2018-2030 54
  16. 10 MERCADO GLOBAL DE SOFTWARE DE GESTIÓN DE ACTIVOS DE TI, POR HERRAMIENTAS 55
    1. 10.1 DESCRIPCIÓN GENERAL 55
      1. 10.1.1 ESTIMACIONES Y PRONÓSTICOS DEL MERCADO GLOBAL DE SOFTWARE DE GESTIÓN DE ACTIVOS DE TI PRONÓSTICO, POR HERRAMIENTAS, 2018-2030 55
    2. 10.2 DESCUBRIMIENTO/ INVENTARIO AUTOMATIZADO 56
      1. 10.2.1 DESCUBRIMIENTO/ INVENTARIO AUTOMATIZADO: ESTIMACIONES DE MERCADO Y PRONÓSTICO, POR REGIÓN, 2018-2030 56
    3. 10.3 GESTIÓN DE LICENCIAS 57
      1. 10.3.1 GESTIÓN DE LICENCIAS: ESTIMACIONES DE MERCADO Y PRONÓSTICO, POR REGIÓN, 2018-2030 57
    4. 10.4 GESTIÓN DE PARCHES Y VERSIONES 57
      1. 10.4.1 GESTIÓN DE PARCHES Y VERSIONES: ESTIMACIONES DE MERCADO Y PRONÓSTICO, POR REGIÓN, 2018-2030 58
    5. 10.5 GESTIÓN DE SOLICITUDES 58
      1. 10.5.1 GESTIÓN DE SOLICITUDES: ESTIMACIONES DE MERCADO Y PRONÓSTICO, POR REGIÓN, 2018-2030 58
    6. 10.6 CATÁLOGO DE PRODUCTOS/SERVICIOS 59
      1. 10.6.1 CATÁLOGO DE PRODUCTOS/SERVICIOS: ESTIMACIONES DE MERCADO Y PRONÓSTICO, POR REGIÓN, 2018-2030 59
    7. 10.7 GESTIÓN DE ACTIVOS DIGITALES 60
      1. 10.7.1 GESTIÓN DE ACTIVOS DIGITALES: ESTIMACIONES DE MERCADO Y PRONÓSTICO, POR REGIÓN, 2018-2030 60
    8. 10.8 OTROS 61
      1. 10.8.1 OTROS: ESTIMACIONES Y PRONÓSTICOS DEL MERCADO, POR REGIÓN, 2018-2030 61
  17. 11 SOFTWARE DE GESTIÓN DE ACTIVOS DE TI GLOBAL, POR REGIÓN 62
    1. 11.1 DESCRIPCIÓN GENERAL 62
      1. 11.1.1 ESTIMACIONES Y PRONÓSTICOS DEL MERCADO DE SOFTWARE DE GESTIÓN DE ACTIVOS DE TI GLOBAL, POR REGIÓN, 2018-2030 62
    2. 11.2 AMÉRICA DEL NORTE 63
      1. 11.2.1 ESTIMACIONES Y PRONÓSTICOS DEL MERCADO DE SOFTWARE DE GESTIÓN DE ACTIVOS DE TI EN AMÉRICA DEL NORTE PRONÓSTICO, POR PAÍS, 2018-2030 64
      2. 11.2.2 EE. UU. 66
      3. 11.2.3 CANADÁ 69
      4. 11.2.4 MÉXICO 71
    3. 11.3 EUROPA 73
      1. 11.3.1 ESTIMACIONES Y PRONÓSTICOS DEL MERCADO DE SOFTWARE DE GESTIÓN DE ACTIVOS DE TI EN EUROPA, POR PAÍS, 2018-2030 74
      2. 11.3.2 ALEMANIA 76
      3. 11.3.3 REINO UNIDO 78
      4. 11.3.4 FRANCIA 80
      5. 11.3.5 RESTO DE EUROPA 82
    4. 11.4 ASIA-PACÍFICO 85
      1. 11.4.1 ESTIMACIONES Y PRONÓSTICOS DEL MERCADO DE SOFTWARE DE GESTIÓN DE ACTIVOS DE TI EN ASIA-PACÍFICO PRONÓSTICO, POR PAÍS, 2018-2030 86
      2. 11.4.2 CHINA 88
      3. 11.4.3 INDIA 90
      4. 11.4.4 JAPÓN 92
      5. 11.4.5 RESTO DE ASIA-PACÍFICO 94
    5. 11.5 RESTO DEL MUNDO 96
      1. 11.5.1 RESTO DEL MUNDO ESTIMACIONES Y MERCADOS DE SOFTWARE DE GESTIÓN DE ACTIVOS DE TI PRONÓSTICO, POR REGIÓN, 2018-2030 96
  18. 12 PERFILES DE EMPRESAS 99
    1. 12.1 FRESHWORKS INC. 99
      1. 12.1.1 DESCRIPCIÓN GENERAL DE LA EMPRESA 99
      2. 12.1.2 DESCRIPCIÓN FINANCIERA 99
      3. 12.1.3 PRODUCTOS OFRECIDOS 100
      4. 12.1.4 DESARROLLOS CLAVE 100
      5. 12.1.5 ESTRATEGIAS CLAVE 100
    2. 12.2 BMC SOFTWARE 101
      1. 12.2.1 DESCRIPCIÓN GENERAL DE LA EMPRESA 101
      2. 12.2.2 DESCRIPCIÓN FINANCIERA 102
      3. 12.2.3 PRODUCTOS OFRECIDOS 102
      4. 12.2.4 DESARROLLOS CLAVE 102
      5. 12.2.5 ANÁLISIS FODA 103
      6. 12.2.6 ESTRATEGIAS CLAVE 103
    3. 12.3 SYSAID TECHNOLOGIES LTD 104
      1. 12.3.1 DESCRIPCIÓN GENERAL DE LA EMPRESA 104
      2. 12.3.2 DESCRIPCIÓN FINANCIERA 104
      3. 12.3.3 PRODUCTOS OFRECIDOS 104
      4. 12.3.4 DESARROLLOS CLAVE 104
    4. 12.4 SERVICENOW, INC 105
      1. 12.4.1 DESCRIPCIÓN GENERAL DE LA EMPRESA 105
      2. 12.4.2 DESCRIPCIÓN FINANCIERA 105
      3. 12.4.3 PRODUCTOS OFRECIDOS 106
      4. 12.4.4 DESARROLLOS CLAVE 106
      5. 12.4.5 Análisis FODA 106
      6. 12.4.6 Estrategias clave 107
    5. 12.5 Asset Panda LLC 108
      1. 12.5.1 Descripción general de la empresa 108
      2. 12.5.2 Descripción financiera 108
      3. 12.5.3 Productos ofrecidos 108
      4. 12.5.4 Desarrollos clave 108
    6. 12.6 Samanage Ltd 109
      1. 12.6.1 Descripción general de la empresa 109
      2. 12.6.2 Descripción financiera 109
      3. 12.6.3 Productos ofrecidos 109
      4. 12.6.4 Desarrollos clave 109
    7. 12.7 Microsoft Corporation 110
      1. 12.7.1 DESCRIPCIÓN GENERAL DE LA EMPRESA 110
      2. 12.7.2 DESCRIPCIÓN GENERAL FINANCIERA 110
      3. 12.7.3 PRODUCTOS OFRECIDOS 111
      4. 12.7.4 DESARROLLOS CLAVE 111
      5. 12.7.5 ANÁLISIS FODA 111
      6. 12.7.6 ESTRATEGIAS CLAVE 112
    8. 12.8 FLEXERA SOFTWARE LLC 113
      1. 12.8.1 DESCRIPCIÓN GENERAL DE LA EMPRESA 113
      2. 12.8.2 DESCRIPCIÓN GENERAL FINANCIERA 113
      3. 12.8.3 PRODUCTOS OFRECIDOS 113
      4. 12.8.4 DESARROLLOS CLAVE 113
      5. 12.8.5 ANÁLISIS FODA 114
      6. 12.8.6 ESTRATEGIAS CLAVE 114
    9. 12.9 IBM CORPORATION 115
      1. 12.9.1 RESEÑA DE LA EMPRESA 115
      2. 12.9.2 RESEÑA FINANCIERA 115
      3. 12.9.3 PRODUCTOS OFRECIDOS 116
      4. 12.9.4 DESARROLLOS CLAVE 116
      5. 12.9.5 ANÁLISIS FODA 117
      6. 12.9.6 ESTRATEGIAS CLAVE 117
    10. 12.10 HP INC 118
      1. 12.10.1 RESEÑA DE LA EMPRESA 118
      2. 12.10.2 RESEÑA FINANCIERA 118
      3. 12.10.3 PRODUCTOS OFRECIDOS 119
      4. 12.10.4 DESARROLLOS CLAVE 119
      5. 12.10.5 ANÁLISIS FODA 119
      6. 12.10.6 ESTRATEGIAS CLAVE 120
    11. ?
    12. LISTA DE TABLAS
    13. TABLA 1 LISTA DE SUPUESTOS 29
    14. TABLA 2 ESTIMACIONES Y PRONÓSTICOS DEL MERCADO GLOBAL DE SOFTWARE DE GESTIÓN DE ACTIVOS DE TI, POR COMPONENTE, 2018-2030 (MILLONES DE USD) 41
    15. TABLA 3 SOFTWARE: ESTIMACIONES Y PRONÓSTICOS DEL MERCADO, POR REGIÓN, 2018-2030 (MILLONES DE USD) 42
    16. TABLA 4 SERVICIOS: ESTIMACIONES Y PRONÓSTICOS DEL MERCADO PRONÓSTICO, POR REGIÓN, 2018-2030 (MILLONES DE USD) 43
    17. TABLA 5 ESTIMACIONES Y PRONÓSTICOS DEL MERCADO GLOBAL DE SOFTWARE DE GESTIÓN DE ACTIVOS DE TI, POR TAMAÑO DE ORGANIZACIÓN, 2018-2030 (MILLONES DE USD) 44
    18. TABLA 6 PYME: ESTIMACIONES Y PRONÓSTICOS DEL MERCADO, POR REGIÓN, 2018-2030 (MILLONES DE USD) 45
    19. TABLA 7 GRANDES EMPRESAS: ESTIMACIONES Y PRONÓSTICOS DEL MERCADO, POR REGIÓN, 2018-2030 (MILLONES DE USD) 46
    20. TABLA 8 ESTIMACIONES Y PRONÓSTICOS DEL MERCADO GLOBAL DE SOFTWARE DE GESTIÓN DE ACTIVOS DE TI PRONÓSTICO, POR TIPO DE IMPLEMENTACIÓN, 2018-2030 (MILLONES DE USD) 47
    21. TABLA 9 EN LA NUBE: ESTIMACIONES DE MERCADO Y PRONÓSTICO, POR REGIÓN, 2018-2030 (MILLONES DE USD) 48
    22. TABLA 10 EN LAS INSTALACIONES: ESTIMACIONES DE MERCADO Y PRONÓSTICO, POR REGIÓN, 2018-2030 (MILLONES DE USD) 49
    23. TABLA 11 ESTIMACIONES Y PRONÓSTICOS DEL MERCADO GLOBAL DE SOFTWARE DE GESTIÓN DE ACTIVOS DE TI, POR USUARIO FINAL, 2018-2030 (MILLONES DE USD) 50
    24. TABLA 12 SERVICIOS BANCARIOS Y FINANCIEROS: ESTIMACIONES DE MERCADO Y PRONÓSTICO, POR REGIÓN, 2018-2030 (MILLONES DE USD) 51
    25. TABLA 13 VENTA MINORISTA: ESTIMACIONES DE MERCADO Y PRONÓSTICO, POR REGIÓN, 2018-2030 (MILLONES DE USD) 51
    26. TABLA 14 AEROESPACIAL Y DEFENSA: ESTIMACIONES DE MERCADO Y PRONÓSTICO, POR REGIÓN, 2018-2030 (MILLONES DE USD) 52
    27. TABLA 15 TI Y TELECOMUNICACIONES: ESTIMACIONES DE MERCADO Y PRONÓSTICO, POR REGIÓN, 2018-2030 (MILLONES DE USD) 52
    28. TABLA 16 ENERGÍA Y ENERGÍA: ESTIMACIONES DE MERCADO Y PRONÓSTICO, POR REGIÓN, 2018-2030 (MILLONES DE USD) 53
    29. TABLA 17 AUTOMOTRIZ Y TRANSPORTE: ESTIMACIONES DE MERCADO Y PRONÓSTICO, POR REGIÓN, 2018-2030 (MILLONES DE USD) 54
    30. TABLA 18 OTROS: ESTIMACIONES DE MERCADO Y PRONÓSTICO, POR REGIÓN, 2018-2030 (MILLONES DE USD) 54
    31. TABLA 19 ESTIMACIONES Y PRONÓSTICOS DEL MERCADO GLOBAL DE SOFTWARE DE GESTIÓN DE ACTIVOS DE TI, POR HERRAMIENTAS, 2018-2030 (MILLONES DE USD) 55
    32. TABLA 20 DESCUBRIMIENTO/INVENTARIO AUTOMATIZADO: ESTIMACIONES DE MERCADO Y PRONÓSTICO, POR REGIÓN, 2018-2030 (MILLONES DE USD) 56
    33. TABLA 21 GESTIÓN DE LICENCIAS: ESTIMACIONES DE MERCADO Y PRONÓSTICO, POR REGIÓN, 2018-2030 (MILLONES DE USD) 57
    34. TABLA 22 GESTIÓN DE PARCHES Y VERSIONES: ESTIMACIONES DE MERCADO Y PRONÓSTICO, POR REGIÓN, 2018-2030 (MILLONES DE USD) 58
    35. TABLA 23 GESTIÓN DE SOLICITUDES: ESTIMACIONES DE MERCADO Y PRONÓSTICO, POR REGIÓN, 2018-2030 (MILLONES DE USD) 58
    36. TABLA 24 CATÁLOGO DE PRODUCTOS/SERVICIOS: ESTIMACIONES DE MERCADO Y PRONÓSTICO, POR REGIÓN, 2018-2030 (MILLONES DE USD) 59
    37. TABLA 25 GESTIÓN DE ACTIVOS DIGITALES: ESTIMACIONES DE MERCADO Y PRONÓSTICO, POR REGIÓN, 2018-2030 (MILLONES DE USD) 60
    38. TABLA 26 OTROS: ESTIMACIONES DE MERCADO Y PRONÓSTICO, POR REGIÓN, 2018-2030 (MILLONES DE USD) 61
    39. TABLA 27 ESTIMACIONES Y PRONÓSTICOS DEL MERCADO GLOBAL DE SOFTWARE DE GESTIÓN DE ACTIVOS DE TI, POR REGIÓN, 2018-2030 (MILLONES DE USD) 62
    40. TABLA 28 AMÉRICA DEL NORTE: ESTIMACIONES DE MERCADO Y PRONÓSTICO, POR PAÍS, 2018-2030 (MILLONES DE USD) 64
    41. TABLA 29 AMÉRICA DEL NORTE: ESTIMACIONES DE MERCADO, POR COMPONENTE, 2018-2030 (MILLONES DE USD) 64
    42. TABLA 30 AMÉRICA DEL NORTE: ESTIMACIONES DE MERCADO, POR TAMAÑO DE ORGANIZACIÓN, 2018-2030 (MILLONES DE USD) 64
    43. TABLA 31 AMÉRICA DEL NORTE: ESTIMACIONES DE MERCADO, POR TIPO DE IMPLEMENTACIÓN, 2018-2030 (MILLONES DE USD) 65
    44. TABLA 32 AMÉRICA DEL NORTE: ESTIMACIONES DE MERCADO, POR USUARIO FINAL, 2018-2030 (MILLONES DE USD) 65
    45. TABLA 33 AMÉRICA DEL NORTE: ESTIMACIONES DE MERCADO, POR HERRAMIENTAS, 2018–2030 (USD MILLONES) 66
    46. TABLA 34 EE. UU.: ESTIMACIONES DE MERCADO, POR COMPONENTE, 2018–2030 (USD MILLONES) 66
    47. TABLA 35 EE. UU.: ESTIMACIONES DE MERCADO, POR TAMAÑO DE ORGANIZACIÓN, 2018–2030 (USD MILLONES) 67
    48. TABLA 36 EE. UU.: ESTIMACIONES DE MERCADO, POR TIPO DE IMPLEMENTACIÓN, 2018–2030 (USD MILLONES) 67
    49. TABLA 37 EE. UU.: ESTIMACIONES DE MERCADO, POR USUARIO FINAL, 2018–2030 (USD MILLONES) 67
    50. TABLA 38 EE. UU.: ESTIMACIONES DE MERCADO, POR HERRAMIENTAS, 2018–2030 (USD MILLONES) 68
    51. TABLA 39 CANADÁ: ESTIMACIONES DE MERCADO, POR COMPONENTE, 2018-2030 (USD MILLONES) 69
    52. TABLA 40 CANADÁ: ESTIMACIONES DE MERCADO, POR TAMAÑO DE ORGANIZACIÓN, 2018-2030 (USD MILLONES) 69
    53. TABLA 41 CANADÁ: ESTIMACIONES DE MERCADO, POR TIPO DE IMPLEMENTACIÓN, 2018-2030 (USD MILLONES) 69
    54. TABLA 42 CANADÁ: ESTIMACIONES DE MERCADO, POR USUARIO FINAL, 2018-2030 (USD MILLONES) 70
    55. TABLA 43 CANADÁ: ESTIMACIONES DE MERCADO, POR USUARIO FINAL, 2018-2030 (USD MILLONES) 70
    56. TABLA 44 MÉXICO: ESTIMACIONES DE MERCADO, POR COMPONENTE, 2018-2030 (USD MILLONES) 71
    57. TABLA 45 MÉXICO: ESTIMACIONES DE MERCADO, POR TAMAÑO DE ORGANIZACIÓN, 2018-2030 (MILLONES DE USD) 71
    58. TABLA 46 MÉXICO: ESTIMACIONES DE MERCADO, POR TIPO DE IMPLEMENTACIÓN, 2018-2030 (MILLONES DE USD) 71
    59. TABLA 47 MÉXICO: ESTIMACIONES DE MERCADO, POR USUARIO FINAL, 2018-2030 (MILLONES DE USD) 72
    60. TABLA 48 MÉXICO: ESTIMACIONES DE MERCADO, POR USUARIO FINAL, 2018-2030 (MILLONES DE USD) 72
    61. TABLA 49 EUROPA: ESTIMACIONES DE MERCADO Y PRONÓSTICO POR PAÍS, 2018-2030 (MILLONES DE USD) 74
    62. TABLA 50 EUROPA: ESTIMACIONES DE MERCADO POR COMPONENTE, 2018-2030 (MILLONES DE USD) 74
    63. TABLA 51 EUROPA: ESTIMACIONES DE MERCADO POR TAMAÑO DE ORGANIZACIÓN, 2018-2030 (MILLONES DE USD) 74
    64. TABLA 52 EUROPA: ESTIMACIONES DE MERCADO POR TIPO DE IMPLEMENTACIÓN, 2018-2030 (MILLONES DE USD) 75
    65. TABLA 53 EUROPA: ESTIMACIONES DE MERCADO POR USUARIO FINAL, 2018-2030 (MILLONES DE USD) 75
    66. TABLA 54 EUROPA: ESTIMACIONES DE MERCADO POR USUARIO FINAL, 2018-2030 (MILLONES DE USD) 76
    67. TABLA 55 ALEMANIA: ESTIMACIONES DE MERCADO, POR COMPONENTE, 2018-2030 (MILLONES DE USD) 76
    68. TABLA 56 ALEMANIA: ESTIMACIONES DE MERCADO, POR TAMAÑO DE ORGANIZACIÓN, 2018-2030 (MILLONES DE USD) 77
    69. TABLA 57 ALEMANIA: ESTIMACIONES DE MERCADO, POR TIPO DE IMPLEMENTACIÓN, 2018-2030 (MILLONES DE USD) 77
    70. TABLA 58 ALEMANIA: ESTIMACIONES DE MERCADO, POR USUARIO FINAL, 2018-2030 (MILLONES DE USD) 77
    71. TABLA 59 ALEMANIA: ESTIMACIONES DE MERCADO, POR USUARIO FINAL, 2018-2030 (MILLONES DE USD) 78
    72. TABLA 60 REINO UNIDO: ESTIMACIONES DE MERCADO, POR COMPONENTE, 2018–2030 (MILLONES DE USD) 78
    73. TABLA 61 REINO UNIDO: ESTIMACIONES DE MERCADO, POR TAMAÑO DE ORGANIZACIÓN, 2018–2030 (MILLONES DE USD) 79
    74. TABLA 62 REINO UNIDO: ESTIMACIONES DE MERCADO, POR TIPO DE IMPLEMENTACIÓN, 2018–2030 (MILLONES DE USD) 79
    75. TABLA 63 REINO UNIDO: ESTIMACIONES DE MERCADO, POR USUARIO FINAL, 2018–2030 (MILLONES DE USD) 79
    76. TABLA 64 REINO UNIDO: ESTIMACIONES DE MERCADO, POR USUARIO FINAL, 2018–2030 (MILLONES DE USD) 80
    77. TABLA 65 FRANCIA: ESTIMACIONES DE MERCADO, POR COMPONENTE, 2018–2030 (MILLONES DE USD) 80
    78. TABLA 66 FRANCIA: ESTIMACIONES DE MERCADO, POR TAMAÑO DE LA ORGANIZACIÓN, 2018-2030 (MILLONES DE USD) 81
    79. TABLA 67 FRANCIA: ESTIMACIONES DE MERCADO, POR TIPO DE IMPLEMENTACIÓN, 2018-2030 (MILLONES DE USD) 81
    80. TABLA 68 FRANCIA: ESTIMACIONES DE MERCADO, POR USUARIO FINAL, 2018-2030 (MILLONES DE USD) 81
    81. TABLA 69 FRANCIA: ESTIMACIONES DE MERCADO, POR USUARIO FINAL, 2018-2030 (MILLONES DE USD) 82
    82. TABLA 70 RESTO DE EUROPA: ESTIMACIONES DE MERCADO, POR COMPONENTE, 2018-2030 (MILLONES DE USD) 82
    83. TABLA 71 RESTO DE EUROPA: ESTIMACIONES DE MERCADO, POR TAMAÑO DE LA ORGANIZACIÓN, 2018-2030 (MILLONES DE USD) 83
    84. TABLA 72 RESTO DE EUROPA: ESTIMACIONES DE MERCADO, POR TIPO DE IMPLEMENTACIÓN, 2018-2030 (MILLONES DE USD) 83
    85. TABLA 73 RESTO DE EUROPA: ESTIMACIONES DE MERCADO, POR USUARIO FINAL, 2018-2030 (MILLONES DE USD) 83
    86. TABLA 74 RESTO

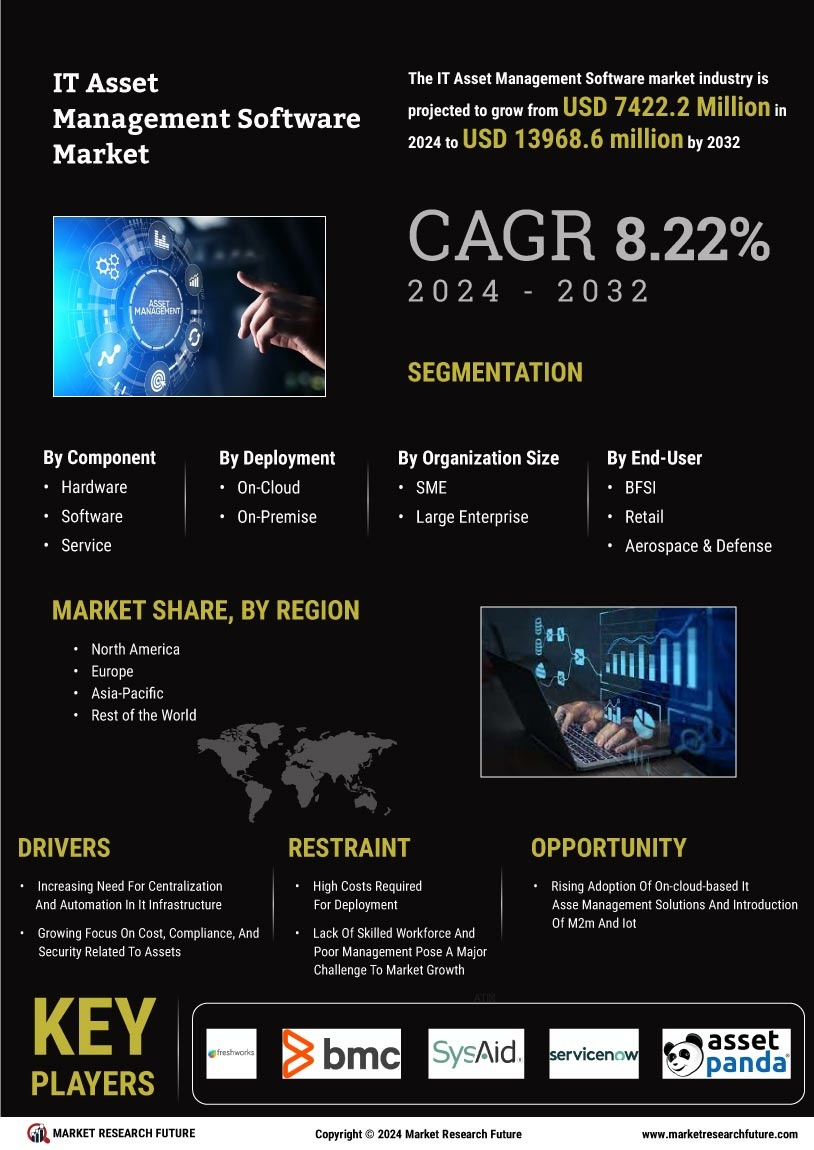
Segmentación del mercado de software de gestión de activos de TI

Perspectiva global de los componentes del software de gestión de activos de TI (millones de USD, 2018-2032)

  • Hardware

  • Software

  • Servicio

Perspectiva global de la implementación del software de gestión de activos de TI (millones de USD, 2018-2032)

  • En la nube

  • En las instalaciones

Perspectiva global del tamaño de la organización del software de gestión de activos de TI (millones de USD, 2018-2032)

  • PYME

  • Gran empresa

Perspectiva global del usuario final del software de gestión de activos de TI (millones de USD), 2018-2032

  • BFSI

  • Venta minorista

  • Aeroespacial y defensa

  • TI y Telecomunicaciones

Perspectiva global de herramientas de software de gestión de activos de TI (millones de USD, 2018-2032)

  • Descubrimiento/Inventario automatizado

  • Gestión de licencias

  • Parches y Gestión de versiones

  • Gestión de solicitudes

  • Catálogo de productos/servicios

  • Gestión de activos digitales

  • Otros

Perspectiva regional global del software de gestión de activos de TI (en millones de USD, 2018-2032)

  • Perspectivas para Norteamérica (millones de USD, 2018-2032)

    • Software de gestión de activos de TI en Norteamérica por componente

      • Hardware

      • Software

      • Servicio

    • Software de gestión de activos de TI en Norteamérica por implementación

      • En la nube

      • En las instalaciones

    • Software de gestión de activos de TI en Norteamérica por tamaño de organización

      • PYME

      • Gran empresa

    • Software de gestión de activos de TI en Norteamérica por usuario final

      • BFSI

      • Venta minorista

      • Aeroespacial y defensa

      • TI y Telecomunicaciones

    • Software de gestión de activos de TI de América del Norte por herramientas

      • Descubrimiento/Inventario automatizado

      • Gestión de licencias

      • Parches y Gestión de versiones

      • Gestión de solicitudes

      • Catálogo de productos/servicios

      • Gestión de activos digitales

      • Otros

    • Perspectiva de EE. UU. (millones de USD, 2018-2032)

    • Software de gestión de activos de TI de EE. UU. por componente

      • Hardware

      • Software

      • Servicio

    • Software de gestión de activos de TI de EE. UU. por implementación

      • En la nube

      • En las instalaciones

    • Software de gestión de activos de TI en EE. UU. por tamaño de organización

      • PYME

      • Gran empresa

    • Software de gestión de activos de TI en EE. UU. por usuario final

      • BFSI

      • Venta minorista

      • Aeroespacial y defensa

      • TI y Telecomunicaciones

    • Software de gestión de activos de TI de EE. UU. por Tools

      • Descubrimiento/Inventario automatizado

      • Gestión de licencias

      • Parches y Gestión de versiones

      • Gestión de solicitudes

      • Catálogo de productos/servicios

      • Gestión de activos digitales

      • Otros

    • Perspectivas para Canadá (millones de USD, 2018-2032)

    • Software de gestión de activos de TI en Canadá por componente

      • Hardware

      • Software

      • Servicio

    • Software de gestión de activos de TI en Canadá por Implementación

      • En la nube

      • En las instalaciones

    • Software de gestión de activos de TI en Canadá por tamaño de organización

      • PYME

      • Gran empresa

    • Software de gestión de activos de TI en Canadá por usuario final

      • BFSI

      • Venta minorista

      • Aeroespacial y defensa

      • TI y Telecomunicaciones

    • Software de gestión de activos de TI de Canadá por Tools

      • Descubrimiento/Inventario automatizado

      • Gestión de licencias

      • Parches y Gestión de versiones

      • Gestión de solicitudes

      • Catálogo de productos/servicios

      • Gestión de activos digitales

      • Otros

  • Perspectivas en Europa (millones de USD, 2018-2032)

    • Software de gestión de activos de TI en Europa por componente

      • Hardware

      • Software

      • Servicio

    • TI en Europa Software de gestión de activos por implementación

      • En la nube

      • En las instalaciones

    • Software de gestión de activos de TI en Europa por tamaño de organización

      • PYME

      • Gran empresa

    • Software de gestión de activos de TI en Europa por usuario final

      • BFSI

      • Comercio minorista

      • Aeroespacial y defensa

      • TI y Telecomunicaciones

    • Software de gestión de activos de TI en Europa por herramientas

      • Descubrimiento/Inventario automatizado

      • Gestión de licencias

      • Parches y Gestión de versiones

      • Gestión de solicitudes

      • Catálogo de productos/servicios

      • Gestión de activos digitales

      • Otros

    • Alemania Perspectivas (millones de USD, 2018-2032)

    • Software de gestión de activos de TI en Alemania por componente

      • Hardware

      • Software

      • Servicio

    • Software de gestión de activos de TI en Alemania por Implementación

      • En la nube

      • En las instalaciones

    • Software de gestión de activos de TI en Alemania por tamaño de organización

      • PYME

      • Gran empresa

    • Software de gestión de activos de TI en Alemania por usuario final

      • BFSI

      • Comercio minorista

      • Aeroespacial y defensa

      • TI y Telecomunicaciones

    • Software de gestión de activos de TI de Tools, Alemania

      • Descubrimiento/Inventario automatizado

      • Gestión de licencias

      • Parches y Gestión de versiones

      • Gestión de solicitudes

      • Catálogo de productos/servicios

      • Gestión de activos digitales

      • Otros

    • Perspectivas en Francia (millones de USD, 2018-2032)

    • Software de gestión de activos de TI en Francia por componente

      • Hardware

      • Software

      • Servicio

    • Software de gestión de activos de TI en Francia por implementación

      • En la nube

      • En las instalaciones

    • Software de gestión de activos de TI en Francia por tamaño de organización

      • PYME

      • Gran empresa

    • Software de gestión de activos de TI en Francia por usuario final

      • BFSI

      • Comercio minorista

      • Aeroespacial y defensa

      • TI y Telecomunicaciones

    • Software de gestión de activos de TI de Francia por Tools

      • Descubrimiento/Inventario automatizado

      • Gestión de licencias

      • Parches y Gestión de versiones

      • Gestión de solicitudes

      • Catálogo de productos/servicios

      • Gestión de activos digitales

      • Otros

    • Perspectivas para el Reino Unido (millones de USD, 2018-2032)

    • Software de gestión de activos de TI en el Reino Unido por componente

      • Hardware

      • Software

      • Servicio

    • Software de gestión de activos de TI en el Reino Unido por implementación

      • En la nube

      • En las instalaciones

    • Software de gestión de activos de TI del Reino Unido por tamaño de organización

      • PYME

      • Gran empresa

    • Software de gestión de activos de TI del Reino Unido por usuario final

      • BFSI

      • Venta minorista

      • Aeroespacial y defensa

      • TI y Telecomunicaciones

    • Software de gestión de activos de TI del Reino Unido de Tools

      • Descubrimiento/Inventario automatizado

      • Gestión de licencias

      • Parches y Gestión de versiones

      • Gestión de solicitudes

      • Catálogo de productos/servicios

      • Gestión de activos digitales

      • Otros

    • Resto de EuropaPerspectivas (millones de USD, 2018-2032)

    • Software de gestión de activos de TI para el resto de Europa por componente

      • Hardware

      • Software

      • Servicio

    • Resto de Europa Software de gestión de activos de TI por implementación

      • En la nube

      • En las instalaciones

    • Software de gestión de activos de TI en el resto de Europa por tamaño de organización

      • PYME

      • Gran empresa

    • Software de gestión de activos de TI en el resto de Europa por usuario final

      • BFSI

      • Comercio minorista

      • Aeroespacial y defensa

      • TI y Telecomunicaciones

    • Software de gestión de activos de TI para el resto de Europa por Tools

      • Descubrimiento/Inventario automatizado

      • Gestión de licencias

      • Parches y Gestión de versiones

      • Gestión de solicitudes

      • Catálogo de productos/servicios

      • Gestión de activos digitales

      • Otros

  • Perspectivas para Asia-Pacífico (millones de USD, 2018-2032)

    • Software de gestión de activos de TI para Asia-Pacífico Componente

      • Hardware

      • Software

      • Servicio

    • Software de gestión de activos de TI en Asia-Pacífico por implementación

      • En la nube

      • En las instalaciones

    • Software de gestión de activos de TI en Asia-Pacífico por tamaño de organización

      • PYME

      • Gran empresa

    • Gestión de activos de TI en Asia-Pacífico Software por usuario final

      • BFSI

      • Venta minorista

      • Aeroespacial y defensa

      • TI y telecomunicaciones

    • Software de gestión de activos de TI de Asia-Pacífico por herramientas

      • Descubrimiento/Inventario automatizado

      • Gestión de licencias

      • Parches y Gestión de versiones

      • Gestión de solicitudes

      • Catálogo de productos/servicios

      • Gestión de activos digitales

      • Otros

    • Perspectivas de China (millones de USD, 2018-2032)

    • Software de gestión de activos de TI en China por componente

      • Hardware

      • Software

      • Servicio

    • Software de gestión de activos de TI en China por implementación

      • En la nube

      • En las instalaciones

    • Software de gestión de activos de TI en China por tamaño de organización

      • PYME

      • Gran empresa

    • Software de gestión de activos de TI en China por usuario final

      • BFSI

      • Venta minorista

      • Aeroespacial y defensa

      • TI y Telecomunicaciones

    • Software de gestión de activos de TI de China por Tools

      • Descubrimiento/Inventario automatizado

      • Gestión de licencias

      • Parches y Gestión de versiones

      • Gestión de solicitudes

      • Catálogo de productos/servicios

      • Gestión de activos digitales

      • Otros

    • Perspectivas para Japón (millones de USD, 2018-2032)

    • Software de gestión de activos de TI en Japón por componente

      • Hardware

      • Software

      • Servicio

    • Software de gestión de activos de TI en Japón por Implementación

      • En la nube

      • En las instalaciones

    • Software de gestión de activos de TI en Japón por tamaño de organización

      • PYME

      • Gran empresa

    • Software de gestión de activos de TI en Japón por usuario final

      • BFSI

      • Venta minorista

      • Aeroespacial y defensa

      • TI y Telecomunicaciones

    • Software de gestión de activos de TI de Japón por Tools

      • Descubrimiento/Inventario automatizado

      • Gestión de licencias

      • Parches y Gestión de versiones

      • Gestión de solicitudes

      • Catálogo de productos/servicios

      • Gestión de activos digitales

      • Otros

    • Perspectivas de India (millones de USD, 2018-2032)

    • Software de gestión de activos de TI en India por componente

      • Hardware

      • Software

      • Servicio

    • Software de gestión de activos de TI en India por implementación

      • En la nube

      • En las instalaciones

    • Software de gestión de activos de TI en India por tamaño de organización

      • PYME

      • Gran empresa

    • Software de gestión de activos de TI en India por usuario final

      • BFSI

      • Venta minorista

      • Aeroespacial y defensa

      • TI y Telecomunicaciones

    • Software de gestión de activos de TI de India por herramientas

      • Descubrimiento/Inventario automatizado

      • Gestión de licencias

      • Parches y Gestión de versiones

      • Gestión de solicitudes

      • Catálogo de productos/servicios

      • Gestión de activos digitales

      • Otros

    • Perspectivas para el resto de Asia-Pacífico (millones de USD, 2018-2032)

    • Software de gestión de activos de TI para el resto de Asia-Pacífico Componente

      • Hardware

      • Software

      • Servicio

    • Resto de software de gestión de activos de TI de Asia-Pacífico por implementación

      • En la nube

      • En las instalaciones

    • Resto de software de gestión de activos de TI de Asia-Pacífico por tamaño de la organización

      • PYME

      • Gran empresa

    • Resto de Software de gestión de activos de TI en Asia-Pacífico por usuario final

      • BFSI

      • Venta minorista

      • Aeroespacial y defensa

      • TI y telecomunicaciones

    • Resto de software de gestión de activos de TI en Asia-Pacífico por herramientas

      • Descubrimiento/Inventario automatizado

      • Gestión de licencias

      • Parches y Gestión de versiones

      • Gestión de solicitudes

      • Catálogo de productos/servicios

      • Gestión de activos digitales

      • Otros

  • Perspectivas para el resto del mundo (millones de USD, 2018-2032)

    • Software de gestión de activos de TI para el resto del mundo por Componente

      • Hardware

      • Software

      • Servicio

    • Software de gestión de activos de TI en el resto del mundo por implementación

      • En la nube

      • En las instalaciones

    • Software de gestión de activos de TI en el resto del mundo por tamaño de la organización

      • PYME

      • Gran empresa

    • Software de gestión de activos de TI en el resto del mundo por Usuario final

      • BFSI

      • Venta minorista

      • Aeroespacial y defensa

      • TI y telecomunicaciones

    • Software de gestión de activos de TI para el resto del mundo por herramientas

      • Descubrimiento/Inventario automatizado

      • Gestión de licencias

      • Parches y Gestión de versiones

      • Gestión de solicitudes

      • Catálogo de productos/servicios

      • Gestión de activos digitales

      • Otros

    • Perspectiva para Oriente Medio y África (millones de USD, 2018-2032)

    • Oriente Medio y África Software de gestión de activos de TI en África por componente

      • Hardware

      • Software

      • Servicio

    • Software de gestión de activos de TI en Oriente Medio y África por implementación

      • En la nube

      • En las instalaciones

    • Oriente Medio y África Software de gestión de activos de TI en África por tamaño de organización

      • PYME

      • Gran empresa

    • Software de gestión de activos de TI en Oriente Medio y África por usuario final

      • BFSI

      • Venta minorista

      • Aeroespacial y defensa

      • TI y telecomunicaciones

    • Oriente Medio y Software de gestión de activos de TI en África por herramientas

      • Descubrimiento/Inventario automatizado

      • Gestión de licencias

      • Gestión de parches y versiones

      • Gestión de solicitudes

      • Catálogo de productos/servicios

      • Gestión de activos digitales

      • Otros


    • Perspectivas para América Latina(Millones de USD, 2018-2032)

    • Software de gestión de activos de TI en América Latina por componente

      • Hardware

      • Software

      • Servicio

    • Software de gestión de activos de TI en América Latina por implementación

      • En la nube

      • En las instalaciones

    • Software de gestión de activos de TI en América Latina por Tamaño de la organización

      • PYME

      • Gran empresa

    • Software de gestión de activos de TI en Latinoamérica por usuario final

      • BFSI

      • Minorista

      • Aeroespacial y defensa

      • TI y Telecomunicaciones

    • Software de gestión de activos de TI para Latinoamérica por herramientas

      • Descubrimiento/Inventario automatizado

      • Gestión de licencias

      • Gestión de parches y versiones

      • Gestión de solicitudes

      • Catálogo de productos/servicios

      • Gestión de activos digitales

      • Otros

Compare Licence

×
Features License Type
Single User Multiuser License Enterprise User
Price $4,950 $5,950 $7,250
Maximum User Access Limit 1 User Upto 10 Users Unrestricted Access Throughout the Organization
Free Customization
Direct Access to Analyst
Deliverable Format
Platform Access
Discount on Next Purchase 10% 15% 15%
Printable Versions