Request Free Sample ×

Kindly complete the form below to receive a free sample of this Report

* Please use a valid business email

Leading companies partner with us for data-driven Insights

clients tt-cursor
Hero Background

Healthcare Revenue Cycle Management Market

ID: MRFR/HS/0376-CR
122 Pages
Satyendra Maurya
Last Updated: May 07, 2026

Informe de investigación de mercado sobre la gestión del ciclo de ingresos (RCM) en el sector sanitario: pronóstico hasta 2032

Compartir
Download PDF ×

We do not share your information with anyone. However, we may send you emails based on your report interest from time to time. You may contact us at any time to opt-out.

  1. 1 Prólogo del informe
  2. 2 Introducción
    1. 2.1 Alcance del estudio 17
    2. 2.2 Objetivo de la investigación 17
    3. 2.3 Supuestos y Limitaciones 17
      1. 2.3.1 Supuestos 17
      2. 2.3.2 Limitaciones 17
    4. 2.4 Estructura del mercado 18
  3. 3 Metodología de la investigación
    1. 3.1 Investigación primaria 21
    2. 3.2 Investigación secundaria 21
    3. 3.3 Estimación del tamaño del mercado 21
      1. 3.3.1 Análisis de la cuota de mercado 22
    4. 3.4 Enfoque de precios de mercado 23
  4. 4 Dinámica del mercado
    1. 4.1 Impulsores 25
      1. 4.1.1 Creciente adopción del software RCM 25
      2. 4.1.2 Inclinación hacia un sistema de salud integrado 25
      3. 4.1.3 Aumento de las auditorías de recuperación 26
      4. 4.1.4 Creciente número de hospitales y servicios de salud 26
    2. 4.2 Restricciones 27
      1. 4.2.1 Necesidad de profesionales bien capacitados 27
      2. 4.2.2 Alto costo de los sistemas RCM 27
    3. 4.3 Oportunidades 27
      1. 4.3.1 Desarrollo de infraestructura de atención médica y soporte de infraestructura de TI 27
    4. 4.4 Megatendencias 28
      1. 4.4.1 Adopción de tecnología avanzada en atención médica 28
    5. 4.5 Indicadores macroeconómicos 28
  5. 5 Análisis de factores de mercado
    1. 5.1 Análisis de la cadena de valor 29
      1. 5.1.1 Insumos 30
      2. 5.1.2 Procesos de desarrollo de software 30
      3. 5.1.3 Pruebas 30
      4. 5.1.4 Marketing y Distribución 30
      5. 5.1.5 Servicios posteriores a la venta 30
    2. 5.2 Modelo de las cinco fuerzas de Porter 31
      1. 5.2.1 Poder de negociación de los proveedores 32
      2. 5.2.2 Poder de negociación de los compradores 32
      3. 5.2.3 Amenaza de nuevos participantes 32
      4. 5.2.4 Amenaza de sustitutos 32
      5. 5.2.5 Intensidad de la rivalidad 33
    3. 5.3 Demanda y Oferta: Análisis de brechas 33
    4. 5.4 Análisis de precios 33
    5. 5.5 Análisis de oportunidades de inversión 34
  6. 6 Mercado global de gestión del ciclo de ingresos de atención médica, por tipo de producto
    1. 6.1 Introducción 35
    2. 6.2 Software integrado 37
    3. 6.3 Software independiente 38
  7. 7 Mercado global de gestión del ciclo de ingresos de atención médica, por componente
    1. 7.1 Introducción 39
    2. 7.2 Software 41
    3. 7.3 Servicios 42
  8. 8 Mercado global de gestión del ciclo de ingresos de atención médica, por implementación
    1. 8.1 Introducción 43
    2. 8.2 Local 45
    3. 8.3 Basado en la nube/web 46
  9. 9 Mercado global de gestión del ciclo de ingresos de atención médica, por usuario final
    1. 9.1 Introducción 47
    2. 9.2 Hospitales 49
    3. 9.3 Servicios ambulatorios 50
  10. 10 Atención médica global Mercado de Gestión del Ciclo de Ingresos por Región
    1. 10.1 Introducción 51
    2. 10.2 América 53
      1. 10.2.1 América del Norte 57
        1. 10.2.1.1 EE. UU. 59
        2. 10.2.1.2 Canadá 61
      2. 10.2.2 América del Sur 63
    3. 10.3 Europa 65
      1. 10.3.1 Europa Occidental 69
        1. 10.3.1.1 Alemania 71
        2. 10.3.1.2 Francia 73
        3. 10.3.1.3 Reino Unido 75
        4. 10.3.1.4 Italia 77
        5. 10.3.1.5 España 79
        6. 10.3.1.6 Resto de Europa Occidental 81
      2. 10.3.2 Europa del Este 83
    4. 10.4 Asia Pacífico 85
      1. 10.4.1 Japón 89
      2. 10.4.2 China 91
      3. 10.4.3 India 93
      4. 10.4.4 República de Corea 95
      5. 10.4.5 Australia 97
      6. 10.4.6 Resto de Asia-Pacífico 99
    5. 10.5 Oriente Medio y África 101
      1. 10.5.1 Oriente Medio 104
      2. 10.5.2 África 106
  11. 11 Panorama de la empresa
    1. 11.1 Introducción 108
    2. 11.2 Análisis de las acciones de la empresa 108
    3. 11.3 Desarrollos clave 110
  12. 12 Perfil de la empresa
    1. 12.1 Quest Diagnostics 111
      1. 12.1.1 Descripción general de la empresa 111
      2. 12.1.2 Información financiera 111
      3. 12.1.3 Productos 111
      4. 12.1.4 Estrategia 111
      5. 12.1.5 Desarrollos clave 111
    2. 12.2 Epic Systems 112
      1. 12.2.1 Descripción general de la empresa 112
      2. 12.2.2 Información financiera 112
      3. 12.2.3 Productos 112
      4. 12.2.4 Estrategia 112
      5. 12.2.5 Desarrollos Clave 112
    3. 12.3 Cerner Corporation 113
      1. 12.3.1 Descripción General de la Empresa 113
      2. 12.3.2 Información Financiera 113
      3. 12.3.3 Productos 113
      4. 12.3.4 Estrategia 113
      5. 12.3.5 Desarrollos Clave 113
    4. 12.4 General Electric Company 114
      1. 12.4.1 Descripción General de la Empresa 114
      2. 12.4.2 Información Financiera 114
      3. 12.4.3 Productos 114
      4. 12.4.4 Estrategia 114
    5. 12.5 Mckesson Corporation 115
      1. 12.5.1 Descripción General de la Empresa 115
      2. 12.5.2 Información Financiera 115
      3. 12.5.3 Productos 115
      4. 12.5.4 Estrategia 115
      5. 12.5.5 Desarrollos Clave 115
    6. 12.6 Siemens Healthcare 116
      1. 12.6.1 Descripción General de la Empresa 116
      2. 12.6.2 Información Financiera 116
      3. 12.6.3 Productos 116
      4. 12.6.4 Estrategia 116
      5. 12.6.5 Desarrollos Clave 116
    7. 12.7 Allscripts 117
      1. 12.7.1 Descripción General de la Empresa 117
      2. 12.7.2 Información Financiera 117
      3. 12.7.3 Productos 117
      4. 12.7.4 Estrategia 117
      5. 12.7.5 Desarrollos Clave 117
  13. 13 Conclusión
    1. 13.1 Hallazgos Clave 118
      1. 13.1.1 Perspectiva del CEO 118
      2. 13.1.2 Necesidades insatisfechas 118
      3. 13.1.3 Empresas clave a tener en cuenta 118
  14. 14 Apéndice
    1. 14.1 Plan de discusión 119
    2. 14.2 Referencias 121
  15. 15 Lista de tablas
    1. TABLA 1 ENTREVISTAS PRINCIPALES 22
    2. TABLA 2 MERCADO GLOBAL DE GESTIÓN DEL CICLO DE INGRESOS DE ATENCIÓN MÉDICA, POR TIPO DE PRODUCTO 2023-2032 (MILLONES DE USD) 36
    3. TABLA 3 MERCADO GLOBAL DE SOFTWARE INTEGRADO, POR REGIÓN 2023-2032 (MILLONES DE USD) 37
    4. TABLA 4 MERCADO GLOBAL DE SOFTWARE INDEPENDIENTE, POR REGIÓN 2023-2032 (USD MILLONES) 38
    5. TABLA 5 MERCADO GLOBAL DE GESTIÓN DEL CICLO DE INGRESOS DE ATENCIÓN MÉDICA, POR COMPONENTE 2023-2032 (USD MILLONES) 40
    6. TABLA 6 MERCADO GLOBAL DE SOFTWARE, POR REGIÓN 2023-2032 (USD MILLONES) 41
    7. TABLA 7 MERCADO GLOBAL DE SERVICIOS, POR REGIÓN 2023-2032 (USD MILLONES) 42
    8. TABLA 8 MERCADO GLOBAL DE GESTIÓN DEL CICLO DE INGRESOS DE ATENCIÓN MÉDICA, POR IMPLEMENTACIÓN 2023-2032 (USD MILLONES) 44
    9. TABLA 9 MERCADO GLOBAL EN LAS INSTALACIONES, POR REGIÓN 2023-2032 (USD MILLONES) 45
    10. TABLA 10 GLOBAL MERCADO DE LA NUBE/WEB, POR REGIÓN, 2023-2032 (MILLONES DE USD) 46
    11. TABLA 11 MERCADO GLOBAL DE GESTIÓN DEL CICLO DE INGRESOS DE ATENCIÓN MÉDICA, POR USUARIO FINAL, 2023-2032 (MILLONES DE USD) 48
    12. TABLA 12 MERCADO GLOBAL DE HOSPITALES, POR REGIÓN, 2023-2032 (MILLONES DE USD) 49
    13. TABLA 13 MERCADO GLOBAL DE SERVICIOS AMBULATORIOS, POR REGIÓN, 2023-2032 (MILLONES DE USD) 50
    14. TABLA 14 MERCADO GLOBAL DE GESTIÓN DEL CICLO DE INGRESOS DE ATENCIÓN MÉDICA, POR REGIÓN, 2023-2032 (MILLONES DE USD) 52
    15. TABLA 15 MERCADO DE GESTIÓN DEL CICLO DE INGRESOS DE ATENCIÓN MÉDICA DE LAS AMÉRICAS, POR REGIÓN, 2023-2032 (USD MILLONES) 54
    16. TABLA 16 MERCADO DE GESTIÓN DEL CICLO DE INGRESOS DE ATENCIÓN MÉDICA EN LAS AMÉRICAS, POR TIPO DE PRODUCTO, 2023-2032 (USD MILLONES) 54
    17. TABLA 17 MERCADO DE GESTIÓN DEL CICLO DE INGRESOS DE ATENCIÓN MÉDICA EN LAS AMÉRICAS, POR COMPONENTE, 2023-2032 (USD MILLONES) 55
    18. TABLA 18 MERCADO DE GESTIÓN DEL CICLO DE INGRESOS DE ATENCIÓN MÉDICA EN LAS AMÉRICAS, POR IMPLEMENTACIÓN, 2023-2032 (USD MILLONES) 55
    19. TABLA 19 MERCADO DE GESTIÓN DEL CICLO DE INGRESOS DE ATENCIÓN MÉDICA EN LAS AMÉRICAS, POR USUARIO FINAL, 2023-2032 (USD MILLONES) 56
    20. TABLA 20 AMÉRICA DEL NORTE MERCADO DE GESTIÓN DEL CICLO DE INGRESOS DE ATENCIÓN MÉDICA, POR TIPO DE PRODUCTO, 2023-2032 (MILLONES DE USD) 57
    21. TABLA 21 MERCADO DE GESTIÓN DEL CICLO DE INGRESOS DE ATENCIÓN MÉDICA EN AMÉRICA DEL NORTE, POR COMPONENTE, 2023-2032 (MILLONES DE USD) 57
    22. TABLA 22 MERCADO DE GESTIÓN DEL CICLO DE INGRESOS DE ATENCIÓN MÉDICA EN AMÉRICA DEL NORTE, POR IMPLEMENTACIÓN, 2023-2032 (MILLONES DE USD) 58
    23. TABLA 23 MERCADO DE GESTIÓN DEL CICLO DE INGRESOS DE ATENCIÓN MÉDICA EN AMÉRICA DEL NORTE, POR USUARIO FINAL, 2023-2032 (MILLONES DE USD) 58
    24. TABLA 24 MERCADO DE GESTIÓN DEL CICLO DE INGRESOS DE ATENCIÓN MÉDICA EN EE. UU., POR TIPO DE PRODUCTO, 2023-2032 (USD MILLONES) 59
    25. TABLA 25 MERCADO DE GESTIÓN DEL CICLO DE INGRESOS DE ATENCIÓN MÉDICA DE EE. UU., POR COMPONENTE, 2023-2032, (USD MILLONES) 59
    26. TABLA 26 MERCADO DE GESTIÓN DEL CICLO DE INGRESOS DE ATENCIÓN MÉDICA DE EE. UU., POR IMPLEMENTACIÓN, 2023-2032 (USD MILLONES) 60
    27. TABLA 27 MERCADO DE GESTIÓN DEL CICLO DE INGRESOS DE ATENCIÓN MÉDICA DE EE. UU., POR USUARIO FINAL, 2023-2032 (USD MILLONES) 60
    28. TABLA 28 MERCADO DE GESTIÓN DEL CICLO DE INGRESOS DE ATENCIÓN MÉDICA DE CANADÁ, POR TIPO DE PRODUCTO, 2023-2032 (USD MILLONES) 61
    29. TABLA 29 INGRESOS DE ATENCIÓN MÉDICA DE CANADÁ MERCADO DE GESTIÓN DEL CICLO DE INGRESOS DE SALUD, POR COMPONENTE, 2023-2032 (MILLONES DE USD) 61
    30. TABLA 30 MERCADO DE GESTIÓN DEL CICLO DE INGRESOS DE SALUD DE CANADÁ, POR IMPLEMENTACIÓN, 2023-2032 (MILLONES DE USD) 62
    31. TABLA 31 MERCADO DE GESTIÓN DEL CICLO DE INGRESOS DE SALUD DE CANADÁ, POR USUARIO FINAL, 2023-2032 (MILLONES DE USD) 62
    32. TABLA 32 MERCADO DE GESTIÓN DEL CICLO DE INGRESOS DE SALUD DE SUDAMÉRICA, POR TIPO DE PRODUCTO, 2023-2032 (MILLONES DE USD) 63
    33. TABLA 33 MERCADO DE GESTIÓN DEL CICLO DE INGRESOS DE SALUD DE SUDAMÉRICA, POR COMPONENTE, 2023-2032 (MILLONES DE USD) 63
    34. TABLA 34 MERCADO DE GESTIÓN DEL CICLO DE INGRESOS DE ATENCIÓN SANITARIA EN SUDAMÉRICA, POR IMPLEMENTACIÓN, 2023-2032 (MILLONES DE USD) 64
    35. TABLA 35 MERCADO DE GESTIÓN DEL CICLO DE INGRESOS DE ATENCIÓN SANITARIA EN SUDAMÉRICA, POR USUARIO FINAL, 2023-2032 (MILLONES DE USD) 64
    36. TABLA 36 MERCADO DE GESTIÓN DEL CICLO DE INGRESOS DE ATENCIÓN SANITARIA EN EUROPA, POR REGIÓN, 2023-2032 (MILLONES DE USD) 66
    37. TABLA 37 MERCADO DE GESTIÓN DEL CICLO DE INGRESOS DE ATENCIÓN SANITARIA EN EUROPA, POR TIPO DE PRODUCTO, 2023-2032 (MILLONES DE USD) 66
    38. TABLA 38 MERCADO DE GESTIÓN DEL CICLO DE INGRESOS DE ATENCIÓN SANITARIA EN EUROPA, POR COMPONENTE, 2023-2032 (USD MILLONES) 67
    39. TABLA 39 MERCADO EUROPEO DE GESTIÓN DEL CICLO DE INGRESOS DE ATENCIÓN SANITARIA, POR IMPLEMENTACIÓN, 2023-2032 (USD MILLONES) 67
    40. TABLA 40 MERCADO EUROPEO DE GESTIÓN DEL CICLO DE INGRESOS DE ATENCIÓN SANITARIA, POR USUARIO FINAL, 2023-2032 (USD MILLONES) 68
    41. TABLA 41 MERCADO DE GESTIÓN DEL CICLO DE INGRESOS DE ATENCIÓN SANITARIA DE EUROPA OCCIDENTAL, POR TIPO DE PRODUCTO, 2023-2032 (USD MILLONES) 69
    42. TABLA 42 MERCADO DE GESTIÓN DEL CICLO DE INGRESOS DE ATENCIÓN SANITARIA DE EUROPA OCCIDENTAL, POR COMPONENTE, 2023-2032 (USD MILLONES) 69
    43. TABLA 43 ATENCIÓN SANITARIA DE EUROPA OCCIDENTAL MERCADO DE GESTIÓN DEL CICLO DE INGRESOS, POR IMPLEMENTACIÓN, 2023-2032 (MILLONES DE USD) 70
    44. TABLA 44 MERCADO DE GESTIÓN DEL CICLO DE INGRESOS DE ATENCIÓN SANITARIA EN EUROPA OCCIDENTAL, POR USUARIO FINAL, 2023-2032 (MILLONES DE USD) 70
    45. TABLA 45 MERCADO DE GESTIÓN DEL CICLO DE INGRESOS DE ATENCIÓN SANITARIA EN ALEMANIA, POR TIPO DE PRODUCTO, 2023-2032 (MILLONES DE USD) 71
    46. TABLA 46 MERCADO DE GESTIÓN DEL CICLO DE INGRESOS DE ATENCIÓN SANITARIA EN ALEMANIA, POR COMPONENTE, 2023-2032 (MILLONES DE USD) 71
    47. TABLA 47 MERCADO DE GESTIÓN DEL CICLO DE INGRESOS DE ATENCIÓN SANITARIA EN ALEMANIA, POR IMPLEMENTACIÓN, 2023-2032 (MILLONES DE USD) 72
    48. TABLA 48 MERCADO DE GESTIÓN DEL CICLO DE INGRESOS DE ATENCIÓN SANITARIA DE ALEMANIA, POR USUARIO FINAL, 2023-2032 (MILLONES DE USD) 72
    49. TABLA 49 MERCADO DE GESTIÓN DEL CICLO DE INGRESOS DE ATENCIÓN SANITARIA DE FRANCIA, POR TIPO DE PRODUCTO, 2023-2032 (MILLONES DE USD) 73
    50. TABLA 50 MERCADO DE GESTIÓN DEL CICLO DE INGRESOS DE ATENCIÓN SANITARIA DE FRANCIA, POR COMPONENTE, 2023-2032 (MILLONES DE USD) 73
    51. TABLA 51 MERCADO DE GESTIÓN DEL CICLO DE INGRESOS DE ATENCIÓN SANITARIA DE FRANCIA, POR IMPLEMENTACIÓN, 2023-2032 (MILLONES DE USD) 74
    52. TABLA 52 MERCADO DE GESTIÓN DEL CICLO DE INGRESOS DE ATENCIÓN SANITARIA DE FRANCIA, POR USUARIO FINAL, 2023-2032 (USD MILLONES) 74
    53. TABLA 53 MERCADO DE GESTIÓN DEL CICLO DE INGRESOS DE ATENCIÓN SANITARIA DEL REINO UNIDO, POR TIPO DE PRODUCTO, 2023-2032 (USD MILLONES) 75
    54. TABLA 54 MERCADO DE GESTIÓN DEL CICLO DE INGRESOS DE ATENCIÓN SANITARIA DEL REINO UNIDO, POR COMPONENTE, 2023-2032 (USD MILLONES) 75
    55. TABLA 55 MERCADO DE GESTIÓN DEL CICLO DE INGRESOS DE ATENCIÓN SANITARIA DEL REINO UNIDO, POR IMPLEMENTACIÓN, 2023-2032 (USD MILLONES) 76
    56. TABLA 56 MERCADO DE GESTIÓN DEL CICLO DE INGRESOS DE ATENCIÓN SANITARIA DEL REINO UNIDO, POR USUARIO FINAL, 2023-2032 (USD MILLONES) 76
    57. TABLA 57 ATENCIÓN SANITARIA EN ITALIA MERCADO DE GESTIÓN DEL CICLO DE INGRESOS, POR TIPO DE PRODUCTO, 2023-2032 (MILLONES DE USD) 77
    58. TABLA 58 MERCADO DE GESTIÓN DEL CICLO DE INGRESOS DE ATENCIÓN SANITARIA EN ITALIA, POR COMPONENTE, 2023-2032 (MILLONES DE USD) 77
    59. TABLA 59 MERCADO DE GESTIÓN DEL CICLO DE INGRESOS DE ATENCIÓN SANITARIA EN ITALIA, POR IMPLEMENTACIÓN, 2023-2032 (MILLONES DE USD) 78
    60. TABLA 60 MERCADO DE GESTIÓN DEL CICLO DE INGRESOS DE ATENCIÓN SANITARIA EN ITALIA, POR USUARIO FINAL, 2023-2032 (MILLONES DE USD) 78
    61. TABLA 61 MERCADO DE GESTIÓN DEL CICLO DE INGRESOS DE ATENCIÓN SANITARIA EN ESPAÑA, POR TIPO DE PRODUCTO, 2023-2032 (MILLONES DE USD) 79
    62. TABLA 62 MERCADO DE GESTIÓN DEL CICLO DE INGRESOS SANITARIOS EN ESPAÑA, POR COMPONENTE, 2023-2032 (MILLONES DE USD) 79
    63. TABLA 63 MERCADO DE GESTIÓN DEL CICLO DE INGRESOS SANITARIOS EN ESPAÑA, POR IMPLEMENTACIÓN, 2023-2032 (MILLONES DE USD) 80
    64. TABLA 64 MERCADO DE GESTIÓN DEL CICLO DE INGRESOS SANITARIOS EN ESPAÑA, POR USUARIO FINAL, 2023-2032 (MILLONES DE USD) 80
    65. TABLA 65 RESTO DE EUROPA OCCIDENTAL MERCADO DE GESTIÓN DEL CICLO DE INGRESOS SANITARIOS, POR TIPO DE PRODUCTO, 2023-2032 (MILLONES DE USD) 81
    66. TABLA 66 RESTO DE EUROPA OCCIDENTAL MERCADO DE GESTIÓN DEL CICLO DE INGRESOS SANITARIOS, POR COMPONENTE, 2023-2032 (MILLONES DE USD) 81
    67. TABLA 67 RESTO DEL MERCADO DE GESTIÓN DEL CICLO DE INGRESOS DE ATENCIÓN SANITARIA DE EUROPA OCCIDENTAL, POR IMPLEMENTACIÓN, 2023-2032 (MILLONES DE USD) 82
    68. TABLA 68 RESTO DEL MERCADO DE GESTIÓN DEL CICLO DE INGRESOS DE ATENCIÓN SANITARIA DE EUROPA OCCIDENTAL, POR USUARIO FINAL, 2023-2032 (MILLONES DE USD) 82
    69. TABLA 69 MERCADO DE GESTIÓN DEL CICLO DE INGRESOS DE ATENCIÓN SANITARIA DE EUROPA ORIENTAL, POR TIPO DE PRODUCTO, 2023-2032 (MILLONES DE USD) 83
    70. TABLA 70 MERCADO DE GESTIÓN DEL CICLO DE INGRESOS DE ATENCIÓN SANITARIA DE EUROPA ORIENTAL, POR COMPONENTE, 2023-2032 (MILLONES DE USD) 83
    71. TABLA 71 MERCADO DE GESTIÓN DEL CICLO DE INGRESOS DE ATENCIÓN SANITARIA DE EUROPA ORIENTAL, POR IMPLEMENTACIÓN, 2023-2032 (MILLONES DE USD) 84
    72. TABLA 72 MERCADO DE GESTIÓN DEL CICLO DE INGRESOS DE ATENCIÓN SANITARIA DE EUROPA ORIENTAL, POR USUARIO FINAL, 2023-2032 (MILLONES DE USD) 84
    73. TABLA 73 MERCADO DE GESTIÓN DEL CICLO DE INGRESOS DE ATENCIÓN SANITARIA DE ASIA-PACÍFICO, POR PAÍS, 2023-2032 (MILLONES DE USD) 86
    74. TABLA 74 MERCADO DE GESTIÓN DEL CICLO DE INGRESOS DE ATENCIÓN SANITARIA DE ASIA-PACÍFICO, POR TIPO DE PRODUCTO, 2023-2032 (MILLONES DE USD) 86
    75. TABLA 75 GESTIÓN DEL CICLO DE INGRESOS DE ATENCIÓN SANITARIA DE ASIA-PACÍFICO MERCADO, POR COMPONENTE, 2023-2032 (USD MILLONES) 87
    76. TABLA 76 MERCADO DE GESTIÓN DEL CICLO DE INGRESOS DE ATENCIÓN MÉDICA DE ASIA-PACÍFICO, POR IMPLEMENTACIÓN, 2023-2032 (USD MILLONES) 87
    77. TABLA 77 MERCADO DE GESTIÓN DEL CICLO DE INGRESOS DE ATENCIÓN MÉDICA DE ASIA-PACÍFICO, POR USUARIO FINAL, 2023-2032 (USD MILLONES) 88
    78. TABLA 78 MERCADO DE GESTIÓN DEL CICLO DE INGRESOS DE ATENCIÓN MÉDICA DE JAPÓN, POR TIPO DE PRODUCTO, 2023-2032 (USD MILLONES) 89
    79. TABLA 79 MERCADO DE GESTIÓN DEL CICLO DE INGRESOS DE ATENCIÓN MÉDICA DE JAPÓN, POR COMPONENTE, 2023-2032 (USD MILLONES) 89
    80. TABLA 80 JAPÓN MERCADO DE GESTIÓN DEL CICLO DE INGRESOS DE ATENCIÓN SANITARIA, POR IMPLEMENTACIÓN, 2023-2032 (MILLONES DE USD) 90
    81. TABLA 81 MERCADO DE GESTIÓN DEL CICLO DE INGRESOS DE ATENCIÓN SANITARIA EN JAPÓN, POR USUARIO FINAL, 2023-2032 (MILLONES DE USD) 90
    82. TABLA 82 MERCADO DE GESTIÓN DEL CICLO DE INGRESOS DE ATENCIÓN SANITARIA EN CHINA, POR TIPO DE PRODUCTO, 2023-2032 (MILLONES DE USD) 91
    83. TABLA 83 MERCADO DE GESTIÓN DEL CICLO DE INGRESOS DE ATENCIÓN SANITARIA EN CHINA, POR COMPONENTE, 2023-2032 (MILLONES DE USD) 91
    84. TABLA 84 MERCADO DE GESTIÓN DEL CICLO DE INGRESOS DE ATENCIÓN SANITARIA EN CHINA, POR IMPLEMENTACIÓN, 2023-2032 (MILLONES DE USD) 92
    85. TABLA 85 MERCADO DE GESTIÓN DEL CICLO DE INGRESOS DE ATENCIÓN SANITARIA EN CHINA, POR USUARIO FINAL, 2023-2032, (MILLONES DE USD) 92
    86. TABLA 86 MERCADO DE GESTIÓN DEL CICLO DE INGRESOS DE ATENCIÓN SANITARIA EN INDIA, POR TIPO DE PRODUCTO, 2023-2032 (MILLONES DE USD) 93
    87. TABLA 87 MERCADO DE GESTIÓN DEL CICLO DE INGRESOS DE ATENCIÓN SANITARIA EN INDIA, POR COMPONENTE, 2023-2032 (MILLONES DE USD) 93
    88. TABLA 88 MERCADO DE GESTIÓN DEL CICLO DE INGRESOS DE ATENCIÓN SANITARIA EN INDIA, POR IMPLEMENTACIÓN, 2023-2032 (MILLONES DE USD) 94
    89. TABLA 89 MERCADO DE GESTIÓN DEL CICLO DE INGRESOS DE ATENCIÓN SANITARIA EN INDIA, POR USUARIO FINAL, 2023-2032 (USD MILLONES) 94
    90. TABLA 90 MERCADO DE GESTIÓN DEL CICLO DE INGRESOS DE ATENCIÓN MÉDICA DE LA REPÚBLICA DE COREA, POR TIPO DE PRODUCTO, 2023-2032 (USD MILLONES) 95
    91. TABLA 91 MERCADO DE GESTIÓN DEL CICLO DE INGRESOS DE ATENCIÓN MÉDICA DE LA REPÚBLICA DE COREA, POR COMPONENTE, 2023-2032 (USD MILLONES) 95
    92. TABLA 92 MERCADO DE GESTIÓN DEL CICLO DE INGRESOS DE ATENCIÓN MÉDICA DE LA REPÚBLICA DE COREA, POR IMPLEMENTACIÓN, 2023-2032 (USD MILLONES) 96
    93. TABLA 93 MERCADO DE GESTIÓN DEL CICLO DE INGRESOS DE ATENCIÓN MÉDICA DE LA REPÚBLICA DE COREA, POR USUARIO FINAL, 2023-2032 (USD MILLONES) 96
    94. TABLA 94 MERCADO DE GESTIÓN DEL CICLO DE INGRESOS DE ATENCIÓN MÉDICA DE AUSTRALIA, POR TIPO DE PRODUCTO, 2023-2032 (MILLONES DE USD) 97
    95. TABLA 95 MERCADO DE GESTIÓN DEL CICLO DE INGRESOS DE ATENCIÓN MÉDICA DE AUSTRALIA, POR COMPONENTE, 2023-2032 (MILLONES DE USD) 97
    96. TABLA 96 MERCADO DE GESTIÓN DEL CICLO DE INGRESOS DE ATENCIÓN MÉDICA DE AUSTRALIA, POR IMPLEMENTACIÓN, 2023-2032 (MILLONES DE USD) 98
    97. TABLA 97 MERCADO DE GESTIÓN DEL CICLO DE INGRESOS DE ATENCIÓN MÉDICA DE AUSTRALIA, POR USUARIO FINAL, 2023-2032 (MILLONES DE USD) 98
    98. TABLA 98 RESTO DEL MERCADO DE GESTIÓN DEL CICLO DE INGRESOS DE ATENCIÓN MÉDICA DE ASIA-PACÍFICO, POR TIPO DE PRODUCTO, 2023-2032 (USD MILLONES) 99
    99. TABLA 99 RESTO DEL MERCADO DE GESTIÓN DEL CICLO DE INGRESOS DE ATENCIÓN MÉDICA DE ASIA-PACÍFICO, POR COMPONENTE, 2023-2032 (USD MILLONES) 99
    100. TABLA 100 RESTO DEL MERCADO DE GESTIÓN DEL CICLO DE INGRESOS DE ATENCIÓN MÉDICA DE ASIA-PACÍFICO, POR IMPLEMENTACIÓN, 2023-2032 (USD MILLONES) 100
    101. TABLA 101 RESTO DEL MERCADO DE GESTIÓN DEL CICLO DE INGRESOS DE ATENCIÓN MÉDICA DE ASIA-PACÍFICO, POR USUARIO FINAL, 2023-2032 (USD MILLONES) 100
    102. TABLA 102 ORIENTE MEDIO Y MERCADO DE GESTIÓN DEL CICLO DE INGRESOS DE ATENCIÓN MÉDICA EN ÁFRICA, POR REGIÓN, 2023-2032 (MILLONES DE USD) 101
    103. TABLA 103 MERCADO DE GESTIÓN DEL CICLO DE INGRESOS DE ATENCIÓN MÉDICA EN ORIENTE MEDIO Y ÁFRICA, POR TIPO DE PRODUCTO, 2023-2032 (MILLONES DE USD) 102
    104. TABLA 104 MERCADO DE GESTIÓN DEL CICLO DE INGRESOS DE ATENCIÓN MÉDICA EN ORIENTE MEDIO Y ÁFRICA, POR COMPONENTE, 2023-2032 (MILLONES DE USD) 102
    105. TABLA 105 MERCADO DE GESTIÓN DEL CICLO DE INGRESOS DE ATENCIÓN MÉDICA EN ORIENTE MEDIO Y ÁFRICA, POR COMPONENTE, 2023-2032 (MILLONES DE USD) 102
    106. TABLA 106 MERCADO DE GESTIÓN DEL CICLO DE INGRESOS DE LA ATENCIÓN SANITARIA EN ÁFRICA, POR IMPLEMENTACIÓN, 2023-2032 (MILLONES DE USD) 103
    107. TABLA 106 ORIENTE MEDIO Y MERCADO DE GESTIÓN DEL CICLO DE INGRESOS DE ATENCIÓN SANITARIA EN ÁFRICA, POR USUARIO FINAL, 2023-2032 (MILLONES DE USD) 103
    108. TABLA 107 MERCADO DE GESTIÓN DEL CICLO DE INGRESOS DE ATENCIÓN SANITARIA EN ORIENTE MEDIO, POR TIPO DE PRODUCTO, 2023-2032 (MILLONES DE USD) 104
    109. TABLA 108 MERCADO DE GESTIÓN DEL CICLO DE INGRESOS DE ATENCIÓN SANITARIA EN ORIENTE MEDIO, POR COMPONENTE, 2023-2032 (MILLONES DE USD) 104
    110. TABLA 109 MERCADO DE GESTIÓN DEL CICLO DE INGRESOS DE ATENCIÓN SANITARIA EN ORIENTE MEDIO, POR IMPLEMENTACIÓN, 2023-2032 (MILLONES DE USD) 105
    111. TABLA 110 GESTIÓN DEL CICLO DE INGRESOS DE ATENCIÓN SANITARIA EN ORIENTE MEDIO MERCADO, POR USUARIO FINAL, 2023-2032 (MILLONES DE USD) 105
    112. TABLA 111 MERCADO DE GESTIÓN DEL CICLO DE INGRESOS DE ATENCIÓN SANITARIA EN ÁFRICA, POR TIPO DE PRODUCTO, 2023-2032 (MILLONES DE USD) 106
    113. TABLA 112 MERCADO DE GESTIÓN DEL CICLO DE INGRESOS DE ATENCIÓN SANITARIA EN ÁFRICA, POR COMPONENTE, 2023-2032 (MILLONES DE USD) 106
    114. TABLA 113 MERCADO DE GESTIÓN DEL CICLO DE INGRESOS DE ATENCIÓN SANITARIA EN ÁFRICA, POR IMPLEMENTACIÓN, 2023-2032 (MILLONES DE USD) 107
    115. TABLA 114 MERCADO DE GESTIÓN DEL CICLO DE INGRESOS DE ATENCIÓN SANITARIA EN ÁFRICA, POR USUARIO FINAL, 2023-2032 (MILLONES DE USD) 107
    116. ?
  16. 16 Lista de figuras
    1. FIGURA 1 CUOTA DE MERCADO GLOBAL DE GESTIÓN DEL CICLO DE INGRESOS DE ATENCIÓN MÉDICA, POR IMPLEMENTACIÓN, 2023 (%) 13
    2. FIGURA 2 CUOTA DE MERCADO GLOBAL DE GESTIÓN DEL CICLO DE INGRESOS DE ATENCIÓN MÉDICA, POR COMPONENTE, 2023 (%) 14
    3. FIGURA 3 CUOTA DE MERCADO GLOBAL DE GESTIÓN DEL CICLO DE INGRESOS DE ATENCIÓN MÉDICA, POR TIPO DE PRODUCTO, 2023 (%) 14
    4. FIGURA 4 CUOTA DE MERCADO GLOBAL DE GESTIÓN DEL CICLO DE INGRESOS DE ATENCIÓN MÉDICA, POR USUARIO FINAL, 2023 (%) 15
    5. FIGURA 5 CUOTA DE MERCADO GLOBAL DE GESTIÓN DEL CICLO DE INGRESOS DE ATENCIÓN MÉDICA, POR REGIÓN, 2023 (%) 16
    6. FIGURA 1 MERCADO GLOBAL DE GESTIÓN DEL CICLO DE INGRESOS DE ATENCIÓN MÉDICA: ESTRUCTURA DEL MERCADO 18
    7. FIGURA 2 PROCESO DE INVESTIGACIÓN 19
    8. FIGURA 3 ANÁLISIS DEL IMPACTO DE LOS IMPULSORES Y RESTRICCIONES DEL MERCADO GLOBAL DE GESTIÓN DEL CICLO DE INGRESOS DE ATENCIÓN MÉDICA 24
    9. FIGURA 4 ANÁLISIS DE LA CADENA DE VALOR DE LA GESTIÓN DEL CICLO DE INGRESOS DE ATENCIÓN MÉDICA (RCM) 29
    10. FIGURA 5 MODELO DE LAS CINCO FUERZAS DE PORTERS 31
    11. FIGURA 6 MERCADO GLOBAL DE GESTIÓN DEL CICLO DE INGRESOS DE ATENCIÓN MÉDICA, POR TIPO DE PRODUCTO 2023 y 2032 (USD MILLONES) 35
    12. FIGURA 7 MERCADO GLOBAL DE GESTIÓN DEL CICLO DE INGRESOS DE ATENCIÓN MÉDICA, POR COMPONENTE 2023 Y 2032 (USD MILLONES) 39
    13. FIGURA 8 MERCADO GLOBAL DE GESTIÓN DEL CICLO DE INGRESOS DE ATENCIÓN MÉDICA, POR IMPLEMENTACIÓN 2023 Y 2032 (USD MILLONES) 43
    14. FIGURA 9 MERCADO GLOBAL DE GESTIÓN DEL CICLO DE INGRESOS DE ATENCIÓN MÉDICA, POR USUARIO FINAL 2023 Y 2032 (USD MILLONES) 47
    15. FIGURA 10 CUOTA DE MERCADO GLOBAL DE GESTIÓN DEL CICLO DE INGRESOS DE ATENCIÓN MÉDICA, POR REGIÓN, 2023 Y 2032 (%) 51
    16. FIGURA 11 CUOTA DE MERCADO DE GESTIÓN DEL CICLO DE INGRESOS DE ATENCIÓN MÉDICA EN AMÉRICA, POR REGIÓN, 2023 (%) 53
    17. FIGURA 12 CUOTA DE MERCADO DE GESTIÓN DEL CICLO DE INGRESOS DE ATENCIÓN MÉDICA EN EUROPA, POR REGIÓN, 2023 (%) 65
    18. FIGURA 13 CUOTA DE MERCADO DE GESTIÓN DEL CICLO DE INGRESOS DE ATENCIÓN MÉDICA EN ASIA-PACÍFICO, POR REGIÓN, 2023 (%) 85
    19. FIGURA 14 ORIENTE MEDIO Y MERCADO DE GESTIÓN DEL CICLO DE INGRESOS DE ATENCIÓN SANITARIA EN ÁFRICA, POR REGIÓN, 2023 (%) 101
    20. FIGURA 15 ANÁLISIS DE LA PARTICIPACIÓN DE LAS EMPRESAS DE GESTIÓN DEL CICLO DE INGRESOS DE ATENCIÓN SANITARIA A NIVEL MUNDIAL, 2023 (%) 108

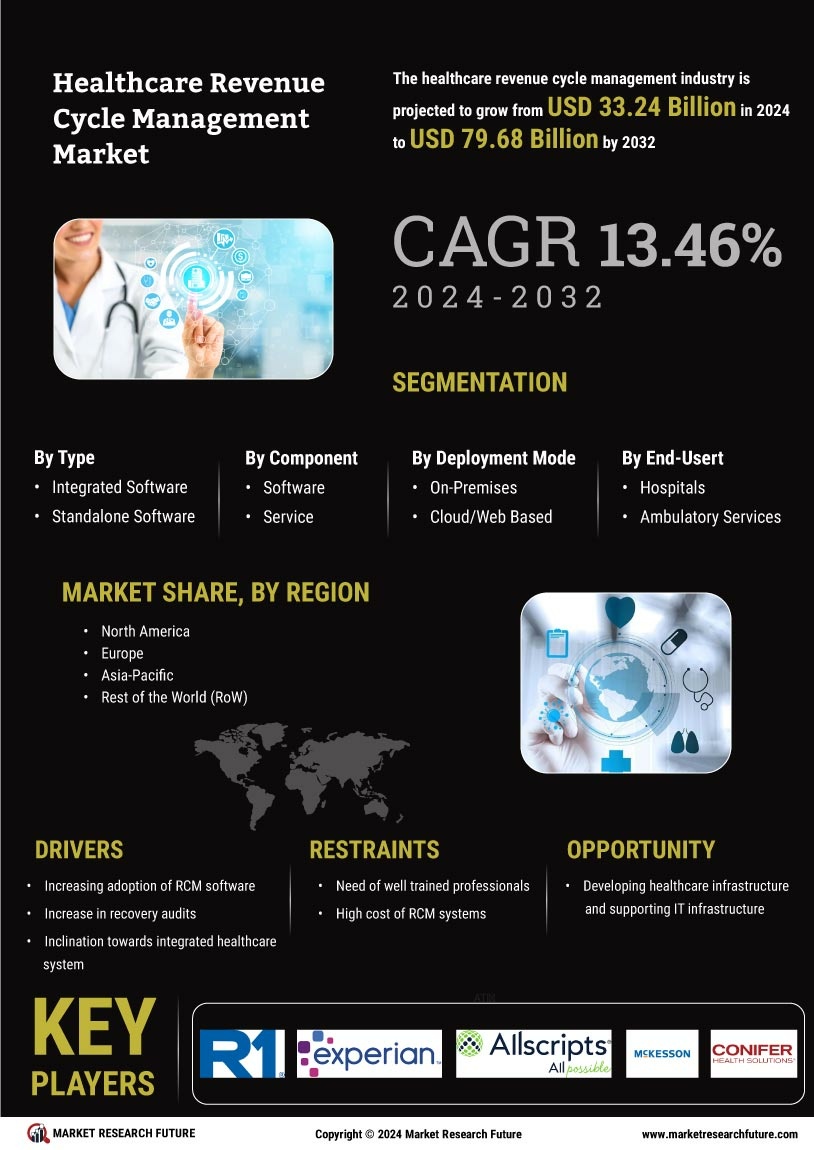
Gestión del ciclo de ingresos de la atención médicaSegmentación del mercado

Perspectiva del tipo de producto de gestión del ciclo de ingresos de la atención médica (miles de millones de USD, 2018-2032)

  • Software integrado

  • Software independiente

Perspectiva del componente de gestión del ciclo de ingresos de la atención médica (miles de millones de USD, 2018-2032)

  • Software

  • Servicio

Perspectiva del modo de implementación de la gestión del ciclo de ingresos de la atención médica (miles de millones de USD, 2018-2032)

  • Local

  • Basado en la nube/web

Perspectiva del usuario final de la gestión del ciclo de ingresos de la atención médica (miles de millones de USD, 2018-2032)

  • Hospitales

  • Servicios ambulatorios

Perspectiva regional de la gestión del ciclo de ingresos de la atención médica (miles de millones de USD, 2018-2032)

  • Perspectiva de Norteamérica (miles de millones de USD, 2018-2032)

    • Gestión del ciclo de ingresos de atención médica en Norteamérica por tipo de producto

      • Software integrado

      • Software independiente

    • Gestión del ciclo de ingresos de atención médica en Norteamérica por componente

      • Software

      • Servicio

    • Gestión del ciclo de ingresos de atención médica en Norteamérica por implementación Modo

      • Local

      • Basado en la nube/web

    • Gestión del ciclo de ingresos del sector salud en Norteamérica por usuario final

      • Hospitales

      • Servicios ambulatorios

    • Perspectiva de EE. UU. (miles de millones de USD, 2018-2032)

    • Gestión del ciclo de ingresos del sector salud en EE. UU. por tipo de producto

      • Software integrado

      • Independiente Software

    • Gestión del ciclo de ingresos del sector sanitario en EE. UU. por componente

      • Software

      • Servicio

    • Gestión del ciclo de ingresos del sector sanitario en EE. UU. por modo de implementación

      • Local

      • Basado en la nube/web

    • Gestión del ciclo de ingresos del sector sanitario en EE. UU. por usuario final

      • Hospitales

      • Ambulatorio Servicios

    • CANADÁPerspectivas (miles de millones de USD, 2018-2032)

    • CANADÁ: Gestión del ciclo de ingresos de atención médica por tipo de producto

      • Software integrado

      • Software independiente

    • CANADÁ: Gestión del ciclo de ingresos de atención médica por componente

      • Software

      • Servicio

    • CANADÁ: Gestión del ciclo de ingresos de atención médica por implementación Modo

      • Local

      • Basado en la nube/web

    • CANADÁ: Gestión del ciclo de ingresos de atención médica por usuario final

      • Hospitales

      • Servicios ambulatorios

  • Perspectivas para Europa (miles de millones de USD, 2018-2032)

    • Gestión del ciclo de ingresos de atención médica en Europa por tipo de producto

      • Software integrado

      • Independiente Software

    • Gestión del ciclo de ingresos de la sanidad en Europa por componente

      • Software

      • Servicio

    • Gestión del ciclo de ingresos de la sanidad en Europa por modo de implementación

      • Local

      • Basado en la nube/web

    • Gestión del ciclo de ingresos de la sanidad en Europa por usuario final

      • Hospitales

      • Ambulatorio Servicios

    • Alemania Perspectivas (miles de millones de USD, 2018-2032)

    • Gestión del ciclo de ingresos del sector sanitario en Alemania por tipo de producto

      • Software integrado

      • Software independiente

    • Gestión del ciclo de ingresos del sector sanitario en Alemania por componente

      • Software

      • Servicio

    • Gestión del ciclo de ingresos del sector sanitario en Alemania por implementación Modo

      • Local

      • Basado en la nube/web

    • Gestión del ciclo de ingresos del sector sanitario en Alemania por usuario final

      • Hospitales

      • Servicios ambulatorios

    • Perspectivas para Francia (miles de millones de USD, 2018-2032)

    • Gestión del ciclo de ingresos del sector sanitario en Francia por tipo de producto

      • Software integrado

      • Independiente Software

    • Gestión del ciclo de ingresos de la sanidad en Francia por componente

      • Software

      • Servicio

    • Gestión del ciclo de ingresos de la sanidad en Francia por modo de implementación

      • Local

      • Basado en la nube/web

    • Gestión del ciclo de ingresos de la sanidad en Francia por usuario final

      • Hospitales

      • Ambulatorio Servicios

    • Perspectivas para el Reino Unido (miles de millones de USD, 2018-2032)

    • Gestión del ciclo de ingresos de atención médica en el Reino Unido por tipo de producto

      • Software integrado

      • Software independiente

    • Gestión del ciclo de ingresos de atención médica en el Reino Unido por componente

      • Software

      • Servicio

    • Gestión del ciclo de ingresos de atención médica en el Reino Unido por implementación Modo

      • Local

      • Basado en la nube/web

    • Gestión del ciclo de ingresos de atención médica en el Reino Unido por usuario final

      • Hospitales

      • Servicios ambulatorios

    • ITALIAPerspectivas (miles de millones de USD, 2018-2032)

    • ITALIA: Gestión del ciclo de ingresos de atención médica por tipo de producto

      • Software integrado

      • Independiente Software

    • Gestión del ciclo de ingresos de atención médica en Italia por componente

      • Software

      • Servicio

    • Gestión del ciclo de ingresos de atención médica en Italia por modo de implementación

      • Local

      • Basado en la nube/web

    • Gestión del ciclo de ingresos de atención médica en Italia por usuario final

      • Hospitales

      • Ambulatorio Servicios

    • Perspectivas para ESPAÑA (miles de millones de USD, 2018-2032)

    • Gestión del ciclo de ingresos del sector sanitario en España por tipo de producto

      • Software integrado

      • Software independiente

    • Gestión del ciclo de ingresos del sector sanitario en España por componente

      • Software

      • Servicio

    • Gestión del ciclo de ingresos del sector sanitario en España por implementación Modo

      • Local

      • Basado en la nube/web

    • Gestión del ciclo de ingresos de atención médica en España por usuario final

      • Hospitales

      • Servicios ambulatorios

    • Perspectiva para el resto de Europa (miles de millones de USD, 2018-2032)

    • Gestión del ciclo de ingresos de atención médica en el resto de Europa por tipo de producto

      • Software integrado

      • Independiente Software

    • Gestión del ciclo de ingresos de la atención médica en el resto de Europa por componente

      • Software

      • Servicio

    • Gestión del ciclo de ingresos de la atención médica en el resto de Europa por modo de implementación

      • Local

      • Basado en la nube/web

    • Gestión del ciclo de ingresos de la atención médica en el resto de Europa por usuario final

      • Hospitales

      • Ambulatorio Servicios

  • Perspectivas de Asia-Pacífico (miles de millones de USD, 2018-2032)

    • Gestión del ciclo de ingresos de atención médica en Asia-Pacífico por tipo de producto

      • Software integrado

      • Software independiente

    • Gestión del ciclo de ingresos de atención médica en Asia-Pacífico por componente

      • Software

      • Servicio

    • Gestión del ciclo de ingresos de atención médica en Asia-Pacífico por implementación Modo

      • Local

      • Basado en la nube/web

    • Gestión del ciclo de ingresos de atención médica en Asia-Pacífico por usuario final

      • Hospitales

      • Servicios ambulatorios

    • Perspectiva de China (miles de millones de USD, 2018-2032)

    • Gestión del ciclo de ingresos de atención médica en China por tipo de producto

      • Software integrado

      • Independiente Software

    • Gestión del ciclo de ingresos de atención médica en China por componente

      • Software

      • Servicio

    • Gestión del ciclo de ingresos de atención médica en China por modo de implementación

      • Local

      • Basado en la nube/web

    • Gestión del ciclo de ingresos de atención médica en China por usuario final

      • Hospitales

      • Ambulatorio Servicios

    • Perspectivas para Japón (miles de millones de USD, 2018-2032)

    • Gestión del ciclo de ingresos del sector sanitario en Japón por tipo de producto

      • Software integrado

      • Software independiente

    • Gestión del ciclo de ingresos del sector sanitario en Japón por componente

      • Software

      • Servicio

    • Gestión del ciclo de ingresos del sector sanitario en Japón por implementación Modo

      • Local

      • Basado en la nube/web

    • Gestión del ciclo de ingresos del sector sanitario en Japón por usuario final

      • Hospitales

      • Servicios ambulatorios

    • Perspectivas para India (miles de millones de USD, 2018-2032)

    • Gestión del ciclo de ingresos del sector sanitario en India por tipo de producto

      • Software integrado

      • Independiente Software

    • Gestión del ciclo de ingresos de la atención médica en India por componente

      • Software

      • Servicio

    • Gestión del ciclo de ingresos de la atención médica en India por modo de implementación

      • Local

      • Basado en la nube/web

    • Gestión del ciclo de ingresos de la atención médica en India por usuario final

      • Hospitales

      • Ambulatorio Servicios

    • Perspectivas para Australia (miles de millones de USD, 2018-2032)

    • Gestión del ciclo de ingresos del sector sanitario en Australia por tipo de producto

      • Software integrado

      • Software independiente

    • Gestión del ciclo de ingresos del sector sanitario en Australia por componente

      • Software

      • Servicio

    • Gestión del ciclo de ingresos del sector sanitario en Australia por implementación Modo

      • Local

      • Basado en la nube/web

    • Gestión del ciclo de ingresos de atención médica en Australia por usuario final

      • Hospitales

      • Servicios ambulatorios

    • Perspectivas para el resto de Asia-Pacífico (miles de millones de USD, 2018-2032)

    • Gestión del ciclo de ingresos de atención médica en el resto de Asia-Pacífico por tipo de producto

      • Integrado Software

      • Software independiente

    • Gestión del ciclo de ingresos de atención médica en el resto de Asia-Pacífico por componente

      • Software

      • Servicio

    • Gestión del ciclo de ingresos de atención médica en el resto de Asia-Pacífico por modo de implementación

      • En las instalaciones

      • Basado en la nube/web

    • Gestión del ciclo de ingresos de atención médica en el resto de Asia-Pacífico por Usuario final

      • Hospitales

      • Servicios ambulatorios

  • Perspectiva para el resto del mundo (miles de millones de USD, 2018-2032)

    • Gestión del ciclo de ingresos de atención médica en el resto del mundo por tipo de producto

      • Software integrado

      • Software independiente

    • Gestión del ciclo de ingresos de atención médica en el resto del mundo por Componente

      • Software

      • Servicio

    • Gestión del ciclo de ingresos de atención médica en el resto del mundo por modo de implementación

      • Local

      • Basado en la nube/web

    • Gestión del ciclo de ingresos de atención médica en el resto del mundo por usuario final

      • Hospitales

      • Servicios ambulatorios

    • Perspectiva para Oriente Medio (miles de millones de USD, 2018-2032)

    • Gestión del ciclo de ingresos de la atención médica en Oriente Medio por tipo de producto

      • Software integrado

      • Software independiente

    • Gestión del ciclo de ingresos de la atención médica en Oriente Medio por componente

      • Software

      • Servicio

    • Gestión del ciclo de ingresos de la atención médica en Oriente Medio por modo de implementación

      • Local

      • Nube/Web Basado en

    • Gestión del ciclo de ingresos de la atención médica en Oriente Medio por usuario final

      • Hospitales

      • Servicios ambulatorios

    • Perspectivas de África(miles de millones de USD, 2018-2032)

    • Gestión del ciclo de ingresos de la atención médica en África por tipo de producto

      • Software integrado

      • Software independiente

    • Gestión del ciclo de ingresos de la atención médica en África por Componente

      • Software

      • Servicio

    • Gestión del ciclo de ingresos de la atención médica en África por modo de implementación

      • Local

      • Basado en la nube/web

    • Gestión del ciclo de ingresos de la atención médica en África por usuario final

      • Hospitales

      • Servicios ambulatorios

    • Perspectiva para América Latina(miles de millones de USD, 2018-2032)

    • Gestión del ciclo de ingresos del sector salud en América Latina por tipo de producto

      • Software integrado

      • Software independiente

    • Gestión del ciclo de ingresos del sector salud en América Latina por componente

      • Software

      • Servicio

    • Gestión del ciclo de ingresos del sector salud en América Latina por modo de implementación

      • Local

      • Nube/Web Basado en

    • Gestión del ciclo de ingresos de atención médica en América Latina por usuario final

      • Hospitales

      • Servicios ambulatorios

Compare Licence

×
Features License Type
Single User Multiuser License Enterprise User
Price $4,950 $5,950 $7,250
Maximum User Access Limit 1 User Upto 10 Users Unrestricted Access Throughout the Organization
Free Customization
Direct Access to Analyst
Deliverable Format
Platform Access
Discount on Next Purchase 10% 15% 15%
Printable Versions