Request Free Sample ×

Kindly complete the form below to receive a free sample of this Report

* Please use a valid business email

Leading companies partner with us for data-driven Insights

clients tt-cursor
Hero Background

Baking Mixes Market

ID: MRFR/FnB/1599-CR
110 Pages
Harshita Gorde
Last Updated: May 02, 2026

Informe de investigación de mercado de mezclas para hornear: pronóstico global hasta 2032

Compartir
Download PDF ×

We do not share your information with anyone. However, we may send you emails based on your report interest from time to time. You may contact us at any time to opt-out.

Baking Mixes Market Infographic
Purchase Options
  1. 1 RESUMEN EJECUTIVO
    1. 1.1 ANÁLISIS DEL ATRACTIVO DEL MERCADO 19
      1. 1.1.1 MERCADO MUNDIAL DE MEZCLAS PARA HORNEAR, POR TIPO DE PRODUCTO, 2023 20
      2. 1.1.2 MERCADO MUNDIAL DE MEZCLAS PARA HORNEAR, POR CATEGORÍA, 2023 21
      3. 1.1.3 MERCADO MUNDIAL DE MEZCLAS PARA PAN, POR USO FINAL, 2023 22
      4. 1.1.4 MERCADO MUNDIAL DE MEZCLAS PARA PAN, POR CANAL DE DISTRIBUCIÓN, 2023 23
      5. 1.1.5 MERCADO MUNDIAL DE MEZCLAS PARA PAN, POR REGIÓN 24
  2. 2 INTRODUCCIÓN AL MERCADO
    1. 2.1 DEFINICIÓN 25
    2. 2.2 ALCANCE DEL ESTUDIO 25
    3. 2.3 OBJETIVO DE LA INVESTIGACIÓN 25
    4. 2.4 ESTRUCTURA DEL MERCADO 25
    5. 2.5 CRITERIOS CLAVE DE COMPRA 26
  3. 3 METODOLOGÍA DE INVESTIGACIÓN
    1. 3.1 PROCESO DE INVESTIGACIÓN 27
    2. 3.2 INVESTIGACIÓN PRIMARIA 28
    3. 3.3 INVESTIGACIÓN SECUNDARIA 29
    4. 3.4 ESTIMACIÓN DEL TAMAÑO DEL MERCADO 29
    5. 3.5 MODELO DE PRONÓSTICO 31
    6. 3.6 LISTA DE SUPUESTOS Y PREVISIONES LIMITACIONES 32
  4. 4 DINÁMICA DEL MERCADO
    1. 4.1 INTRODUCCIÓN 33
    2. 4.2 IMPULSORES 34
      1. 4.2.1 CRECIMIENTO DE LA INDUSTRIA DE LA PANIFICACIÓN 34
      2. 4.2.2 CRECIMIENTO DE LA DEMANDA DE ALIMENTOS LISTOS PARA COMER/COMIDA PREPARADA 34
      3. 4.2.3 CRECIMIENTO DEL SECTOR MINORISTA ORGANIZADO EN ASIA-PACÍFICO 34
      4. 4.2.4 ANÁLISIS DE IMPACTO DE LOS IMPULSORES 35
    3. 4.3 RESTRICCIÓN 35
      1. 4.3.1 REGLAMENTACIÓN MARCO 35
      2. 4.3.2 ANÁLISIS DE IMPACTO DE LAS RESTRICCIONES 36
    4. 4.4 OPORTUNIDADES 36
      1. 4.4.1 AUMENTO DEL CONSUMO DE PRODUCTOS “LIBRE DE”, DE ETIQUETA LIMPIA 36
      2. 4.4.2 INNOVACIONES DE PRODUCTOS 37
    5. 4.5 DESAFÍOS 37
      1. 4.5.1 PERCEPCIONES DE LOS CONSUMIDORES E INCLINACIÓN HACIA LOS INGREDIENTES NATURALES PARA PANIFICACIÓN 37
  5. 5 ​​ANÁLISIS DE LOS FACTORES DE MERCADO
    1. 5.1 ANÁLISIS DE LA CADENA DE VALOR 38
      1. 5.1.1 MATERIAS PRIMAS 39
      2. 5.1.2 PROCESAMIENTO 39
      3. 5.1.3 EMBALAJE 39
    2. 5.2 ANÁLISIS DE LA CADENA DE SUMINISTRO 40
    3. 5.3 MODELO DE LAS CINCO FUERZAS DE PORTER 41
      1. 5.3.1 AMENAZA DE NUEVOS PARTICIPANTES 41
      2. 5.3.2 PODER DE NEGOCIACIÓN DE LOS PROVEEDORES 42
      3. 5.3.3 PODER DE NEGOCIACIÓN DE LOS COMPRADORES 42
      4. 5.3.4 AMENAZA DE SUSTITUTOS 42
      5. 5.3.5 RIVALIDAD 43
    4. 5.4 ANÁLISIS CUALITATIVO DE LOS INGREDIENTES INCLUIDOS EN LAS MEZCLAS PARA HORNEAR 43
      1. 5.4.1 ACEITE- 43
      2. 5.4.2 GRASAS- 43
      3. 5.4.3 POLVO PARA HORNEAR- 43
      4. 5.4.4 EMULSIONANTES- 44
      5. 5.4.5 ESTABILIZADORES- 44
      6. 5.4.6 ESPESANTES- 44
      7. 5.4.7 COLORES- 44
      8. 5.4.8 SABORES- 44
      9. 5.4.9 ENZIMAS- 44
      10. 5.4.10 CONSERVANTES- 45
    5. 5.5 EVOLUCIÓN DE LOS INGREDIENTES 45
  6. 6 IMPACTO DEL BROTE DE COVID-19 EN LAS MEZCLAS PARA HORNEAR A NIVEL MUNDIAL MERCADO
  7. 6.1.1 IMPACTO EN LA PRODUCCIÓN 47
  8. 6.1.2 IMPACTO EN EL COMPORTAMIENTO DE COMPRA DEL CONSUMIDOR 47
  9. 6.1.3 IMPACTO EN LA CADENA DE SUMINISTRO 47
  10. 6.1.4 IMPACTO EN LOS PRECIOS 48
  11. 6.1.5 IMPACTO EN TIENDAS VS. VENTAS NO BASADAS EN TIENDAS 48
  12. 7 MERCADO MUNDIAL DE MEZCLAS PARA HORNEAR, POR TIPO DE PRODUCTO
    1. 7.1 DESCRIPCIÓN GENERAL 49
      1. 7.1.1 ESTIMACIONES Y ESTIMACIONES DEL MERCADO MUNDIAL DE MEZCLAS PARA HORNEAR; PRONÓSTICO, POR TIPO DE PRODUCTO, 2024-2032 50
    2. 7.2 COOKIE & MEZCLAS DE GALLETAS 50
      1. 7.2.1 COOKIE & MEZCLAS DE GALLETAS: ESTIMACIONES DEL MERCADO & PREVISIÓN, POR REGIÓN, 2024-2032 51
    3. 7.3 TORTERÍA, PASTELERÍA & MEZCLAS PARA MUFFIN 52
      1. 7.3.1 PASTEL, PASTELERÍA Y TARTAS MEZCLAS PARA MUFFIN: ESTIMACIONES DEL MERCADO Y PREGUNTAS PRONÓSTICO, POR REGIÓN, 2024-2032 52
    4. 7.4 MEZCLAS DE PAN 53
      1. 7.4.1 MEZCLAS DE PAN: ESTIMACIONES DEL MERCADO Y COMENTARIOS PRONÓSTICOS POR REGIÓN, 2024-2032 53
    5. 7.5 OTROS 54
      1. 7.5.1 OTROS: ESTIMACIONES DEL MERCADO Y PREVISIÓN PRONÓSTICO, POR REGIÓN, 2024-2032 54
  13. 8 MERCADO MUNDIAL DE MEZCLAS PARA HORNEAR, POR CATEGORÍA
    1. 8.1 DESCRIPCIÓN GENERAL 55
      1. 8.1.1 ESTIMACIONES Y PREVISIONES DEL MERCADO MUNDIAL DE MEZCLAS PARA HORNEAR; PRONÓSTICO, POR CATEGORÍA, 2024-2032 56
    2. 8.2 CONVENCIONAL 57
      1. 8.2.1 CONVENCIONAL: ESTIMACIONES DE MERCADO & PRONÓSTICO, POR REGIÓN, 2024-2032 57
    3. 8.3 SIN GLUTEN 58
      1. 8.3.1 SIN GLUTEN: ESTIMACIONES DEL MERCADO Y COMENTARIOS PRONÓSTICO, POR REGIÓN, 2024-2032 58
  14. 9 MERCADO MUNDIAL DE MEZCLAS PARA HORNEAR, POR USO FINAL
    1. 9.1 DESCRIPCIÓN GENERAL 59
      1. 9.1.1 ESTIMACIONES Y PREVISIÓN DEL MERCADO MUNDIAL DE MEZCLAS PARA HORNEAR; PRONÓSTICO, POR USO FINAL, 2024-2032 60
    2. 9.2 CONSUMIDORES MINORISTAS 60
      1. 9.2.1 CONSUMIDORES MINORISTAS: ESTIMACIONES DEL MERCADO & PRONÓSTICO, POR REGIÓN, 2024-2032 61
    3. 9.3 SERVICIO DE ALIMENTOS 62
      1. 9.3.1 SERVICIO DE ALIMENTOS: ESTIMACIONES DEL MERCADO Y COMENTARIOS PRONÓSTICO, POR REGIÓN, 2024-2032 62
  15. 10 MERCADO MUNDIAL DE MEZCLAS PARA PAN, POR CANAL DE DISTRIBUCIÓN
    1. 10.1 DESCRIPCIÓN GENERAL 63
      1. 10.1.1 ESTIMACIONES Y PREVISIÓN DEL MERCADO MUNDIAL DE MEZCLAS PARA PAN. PRONÓSTICO, POR CANAL DE DISTRIBUCIÓN, 2024-2032 64
    2. 10.2 EN TIENDAS 65
      1. 10.2.1 EN TIENDAS: ESTIMACIONES DE MERCADO & PRONÓSTICO, POR REGIÓN, 2024-2032 65
    3. 10.3 NO BASADO EN TIENDAS 66
      1. 10.3.1 NO BASADO EN TIENDAS: ESTIMACIONES DE MERCADO & PRONÓSTICO, POR REGIÓN, 2024-2032 66
  16. 11 MERCADO MUNDIAL DE MEZCLAS PARA HORNEAR, POR REGIÓN
    1. 11.1 RESUMEN 67
    2. 11.2 AMÉRICA DEL NORTE 69
      1. 11.2.1 EE. UU. 73
      2. 11.2.2 CANADÁ 76
      3. 11.2.3 MÉXICO 79
    3. 11.3 EUROPA 82
      1. 11.3.1 Reino Unido 86
      2. 11.3.2 ALEMANIA 89
      3. 11.3.3 FRANCIA 92
      4. 11.3.4 ITALIA 94
      5. 11.3.5 ESPAÑA 97
      6. 11.3.6 RESTO DE EUROPA 100
    4. 11.4 ASIA-PACÍFICO 103
      1. 11.4.1 CHINA 107
      2. 11.4.2 INDIA 110
      3. 11.4.3 JAPÓN 113
      4. 11.4.4 AUSTRALIA & NUEVA ZELANDA 115
      5. 11.4.5 RESTO DE ASIA-PACÍFICO 118
    5. 11.5 RESTO DEL MUNDO 122
      1. 11.5.1 AMÉRICA DEL SUR 126
      2. 11.5.2 ORIENTE MEDIO 129
      3. 11.5.3 ÁFRICA 131
  17. 12 PANORAMA COMPETITIVO
    1. 12.1 INTRODUCCIÓN 135
      1. 12.1.1 ANÁLISIS DE LA ESTRATEGIA DE MERCADO 135
    2. 12.2 COMPETITIVO Evaluación comparativa 136
    3. 12.3 DESARROLLOS CLAVE Y ESTRATEGIAS DE CRECIMIENTO 136
      1. 12.3.1 EXPANSIONES 136
      2. 12.3.2 LANZAMIENTO DE PRODUCTOS 137
      3. 12.3.3 ADQUISICIÓN 137
  18. 13 PERFILES DE LA EMPRESA
    1. 13.1 MOLINOS GENERALES, INC. 138
      1. 13.1.1 DESCRIPCIÓN GENERAL DE LA COMPAÑÍA 138
      2. 13.1.2 DESCRIPCIÓN FINANCIERA 139
      3. 13.1.3 PRODUCTOS OFRECIDOS 139
      4. 13.1.4 DESARROLLOS CLAVE 140
      5. 13.1.5 ANÁLISIS FODA 140
      6. 13.1.6 ESTRATEGIAS CLAVE 141
    2. 13.2 CONAGRA BRANDS, INC. 142
      1. 13.2.1 DESCRIPCIÓN GENERAL DE LA COMPAÑÍA 142
      2. 13.2.2 RESUMEN FINANCIERO 142
      3. 13.2.3 PRODUCTOS OFRECIDOS 143
      4. 13.2.4 DESARROLLOS CLAVE 143
      5. 13.2.5 ANÁLISIS FODA 144
      6. 13.2.6 ESTRATEGIAS CLAVE 144
    3. 13.3 CHELSEA MILLING COMPANY 145
      1. 13.3.1 DESCRIPCIÓN GENERAL DE LA COMPAÑÍA 145
      2. 13.3.2 DESCRIPCIÓN FINANCIERA 145
      3. 13.3.3 PRODUCTOS OFRECIDOS 145
      4. 13.3.4 DESARROLLOS CLAVE 146
      5. 13.3.5 ESTRATEGIAS CLAVE 146
    4. 13.4 ASSOCIATION BRITISH FOODS PLC 147
      1. 13.4.1 DESCRIPCIÓN GENERAL DE LA COMPAÑÍA 147
      2. 13.4.2 DESCRIPCIÓN FINANCIERA 147
      3. 13.4.3 PRODUCTOS OFRECIDOS 148
      4. 13.4.4 DESARROLLOS CLAVE 148
      5. 13.4.5 ANÁLISIS FODA 149
      6. 13.4.6 ESTRATEGIAS CLAVE 149
    5. 13.5 MONDEL?Z INTERNATIONAL, INC. 150
      1. 13.5.1 DESCRIPCIÓN GENERAL DE LA COMPAÑÍA 150
      2. 13.5.2 RESUMEN FINANCIERO 151
      3. 13.5.3 PRODUCTOS OFRECIDOS 151
      4. 13.5.4 DESARROLLOS CLAVE 152
      5. 13.5.5 ANÁLISIS FODA 152
      6. 13.5.6 ESTRATEGIAS CLAVE 152
    6. 13.6 BOB'S RED MILL NATURAL FOODS, INC. 153
      1. 13.6.1 DESCRIPCIÓN GENERAL DE LA COMPAÑÍA 153
      2. 13.6.2 DESCRIPCIÓN FINANCIERA 153
      3. 13.6.3 PRODUCTOS OFRECIDOS 153
      4. 13.6.4 DESARROLLOS CLAVE 154
      5. 13.6.5 ESTRATEGIAS CLAVE 154
    7. 13.7 HAIN CELESTIAL 155
      1. 13.7.1 DESCRIPCIÓN GENERAL DE LA COMPAÑÍA 155
      2. 13.7.2 DESCRIPCIÓN FINANCIERA 155
      3. 13.7.3 PRODUCTOS OFRECIDOS 156
      4. 13.7.4 DESARROLLOS CLAVE 156
      5. 13.7.5 ESTRATEGIAS CLAVE 156
    8. 13.8 KETO Y LA COMPAÑÍA 157
      1. 13.8.1 DESCRIPCIÓN GENERAL DE LA COMPAÑÍA 157
      2. 13.8.2 DESCRIPCIÓN FINANCIERA 157
      3. 13.8.3 PRODUCTOS OFRECIDOS 157
      4. 13.8.4 DESARROLLOS CLAVE 157
      5. 13.8.5 ESTRATEGIAS CLAVE 157
    9. 13.9 CONTINENTAL MILLS, INC. 158
      1. 13.9.1 DESCRIPCIÓN GENERAL DE LA COMPAÑÍA 158
      2. 13.9.2 DESCRIPCIÓN FINANCIERA 158
      3. 13.9.3 PRODUCTOS OFRECIDOS 158
      4. 13.9.4 DESARROLLOS CLAVE 159
      5. 13.9.5 ESTRATEGIAS CLAVE 159
    10. 13.10 DAWN FOOD PRODUCTS, INC. 160
      1. 13.10.1 DESCRIPCIÓN GENERAL DE LA COMPAÑÍA 160
      2. 13.10.2 DESCRIPCIÓN FINANCIERA 160
      3. 13.10.3 PRODUCTOS OFRECIDOS 160
      4. 13.10.4 DESARROLLOS CLAVE 160
      5. 13.10.5 ANÁLISIS FODA 161
      6. 13.10.6 ESTRATEGIAS CLAVE 161
  19. 14 REFERENCIAS
  20. 15 LISTA DE TABLAS
    1. TABLA 1 ENTREVISTAS PRINCIPALES 28
    2. TABLA 2 LISTA DE SUPUESTOS Y PRESUPUESTOS LIMITACIONES 32
    3. TABLA 3 MERCADO MUNDIAL DE MEZCLAS PARA PANIFICACIÓN: DESARROLLOS 46
    4. TABLA 4 ESTIMACIONES Y OBTENCIONES DEL MERCADO MUNDIAL DE MEZCLAS PARA PANIFICACIÓN. PRONÓSTICO, POR TIPO DE PRODUCTO, 2024-2032 (MILLONES DE USD) 50
    5. TABLA 5 ESTIMACIONES Y PREVISIONES DEL MERCADO MUNDIAL DE MEZCLAS PARA HORNEAR. PRONÓSTICO POR TIPO DE PRODUCTO, 2024-2032 (MILES DE UNIDADES) 50
    6. TABLA 6 COOKIE & MEZCLAS DE GALLETAS: ESTIMACIONES DEL MERCADO & PRONÓSTICO, POR REGIÓN, 2024-2032 (MILLONES DE USD) 51
    7. TABLA 7 COOKIE & MEZCLAS DE GALLETAS: ESTIMACIONES DEL MERCADO & PREVISIÓN POR REGIÓN, 2024-2032 (MILES DE UNIDADES) 51
    8. TABLA 8 TORTERÍA, PASTELERÍA & MEZCLAS PARA MUFFIN: ESTIMACIONES DEL MERCADO Y PREGUNTAS PRONÓSTICO, POR REGIÓN, 2024-2032 (MILLONES DE USD) 52
    9. TABLA 9 TORTERÍA, PASTELERÍA & MEZCLAS PARA MUFFIN: ESTIMACIONES DEL MERCADO Y PREGUNTAS PRONÓSTICO, POR REGIÓN, 2024-2032 (MILES DE UNIDADES) 52
    10. TABLA 10 MEZCLAS DE PAN: ESTIMACIONES DEL MERCADO Y PREVISIÓN. PRONÓSTICO, POR REGIÓN, 2024-2032 (MILLONES DE USD) 53
    11. TABLA 11 MEZCLAS DE PAN: ESTIMACIONES DEL MERCADO Y PREVISIÓN PRONÓSTICO, POR REGIÓN, 2024-2032 (MILES DE UNIDADES) 53
    12. TABLA 12 OTROS: ESTIMACIONES DE MERCADO & PRONÓSTICO, POR REGIÓN, 2024-2032 (MILLONES DE USD) 54
    13. TABLA 13 OTROS: ESTIMACIONES DE MERCADO & PRONÓSTICO, POR REGIÓN, 2024-2032 (MILES DE UNIDADES) 54
    14. TABLA 14 ESTIMACIONES Y PREVISIONES DEL MERCADO MUNDIAL DE MEZCLAS PARA PANIFICACIÓN. PRONÓSTICO, POR CATEGORÍA, 2024-2032 (MILLONES DE USD) 56
    15. TABLA 15 ESTIMACIONES Y PREVISIONES DEL MERCADO MUNDIAL DE MEZCLAS PARA PANIFICACIÓN. PRONÓSTICO, POR CATEGORÍA, 2024-2032 (MILES DE UNIDADES) 56
    16. TABLA 16 CONVENCIONAL: ESTIMACIONES DE MERCADO & PRONÓSTICO, POR REGIÓN, 2024-2032 (MILLONES DE USD) 57
    17. TABLA 17 CONVENCIONAL: ESTIMACIONES DE MERCADO & PRONÓSTICO, POR REGIÓN, 2024-2032 (MILES DE UNIDADES) 57
    18. TABLA 18 SIN GLUTEN: ESTIMACIONES DEL MERCADO & PRONÓSTICO, POR REGIÓN, 2024-2032 (MILLONES DE USD) 58
    19. TABLA 19 SIN GLUTEN: ESTIMACIONES DEL MERCADO & PRONÓSTICO, POR REGIÓN, 2024-2032 (MILES DE UNIDADES) 58
    20. TABLA 20 ESTIMACIONES Y PREVISIONES DEL MERCADO MUNDIAL DE MEZCLAS PARA PANIFICACIÓN. PRONÓSTICO, POR USO FINAL, 2024-2032 (MILLONES DE USD) 60
    21. TABLA 21 ESTIMACIONES Y PREVISIONES DEL MERCADO MUNDIAL DE MEZCLAS PARA HORNEAR. PRONÓSTICO, POR USO FINAL, 2024-2032 (MILES DE UNIDADES) 60
    22. TABLA 22 CONSUMIDORES MINORISTAS: ESTIMACIONES DEL MERCADO & PRONÓSTICO, POR REGIÓN, 2024-2032 (MILLONES DE USD) 61
    23. TABLA 23 CONVERANOS: ESTIMACIONES DEL MERCADO Y PRONÓSTICO, POR REGIÓN, 2024-2032 (MILES DE UNIDADES) 61
    24. TABLA 24 SERVICIO DE ALIMENTOS: ESTIMACIONES DE MERCADO Y PREVISIÓN PRONÓSTICO, POR REGIÓN, 2024-2032 (MILLONES DE USD) 62
    25. TABLA 25 SERVICIO DE ALIMENTOS: ESTIMACIONES DEL MERCADO Y PREVISIÓN PRONÓSTICO, POR REGIÓN, 2024-2032 (MILES DE UNIDADES) 62
    26. TABLA 26 ESTIMACIONES Y PREVISIONES DEL MERCADO MUNDIAL DE MEZCLAS PARA PANIFICACIÓN. PRONÓSTICO, POR CANAL DE DISTRIBUCIÓN, 2024-2032 (MILLONES DE USD) 64
    27. TABLA 27 ESTIMACIONES Y PRESENTACIONES DEL MERCADO MUNDIAL DE MEZCLAS PARA PANIFICACIÓN. PRONÓSTICO, POR CANAL DE DISTRIBUCIÓN, 2024-2032 (MILES DE UNIDADES) 64
    28. TABLA 28 TIENDAS: ESTIMACIONES DE MERCADO & PRONÓSTICO, POR REGIÓN, 2024-2032 (MILLONES DE USD) 65
    29. TABLA 29 EN TIENDAS: ESTIMACIONES DE MERCADO Y PREVISIÓN PRONÓSTICO, POR REGIÓN, 2024-2032 (MILES DE UNIDADES) 65
    30. TABLA 30 NO BASADO EN TIENDAS: ESTIMACIONES DE MERCADO & PRONÓSTICO, POR REGIÓN, 2024-2032 (MILLONES DE USD) 66
    31. TABLA 31 NO BASADO EN TIENDAS: ESTIMACIONES Y EFECTOS DEL MERCADO PRONÓSTICO, POR REGIÓN, 2024-2032 (MILES DE UNIDADES) 66
    32. TABLA 32 ESTIMACIONES Y PREVISIONES DEL MERCADO MUNDIAL DE MEZCLAS PARA PANIFICACIÓN. PRONÓSTICO, POR REGIÓN, 2024-2032 (MILLONES DE USD) 68
    33. TABLA 33 ESTIMACIONES Y PREVISIONES DEL MERCADO MUNDIAL DE MEZCLAS PARA PANIFICACIÓN. PRONÓSTICO, POR REGIÓN, 2024-2032 (MILES DE UNIDADES) 68
    34. TABLA 34 AMÉRICA DEL NORTE: ESTIMACIONES Y PREVISIONES DEL MERCADO PRONÓSTICO, POR PAÍS, 2024-2032 (MILLONES DE USD) 69
    35. TABLA 35 AMÉRICA DEL NORTE: ESTIMACIONES Y PREVISIONES DEL MERCADO PRONÓSTICO, POR PAÍS, 2024-2032 (MILES DE UNIDADES) 70
    36. TABLA 36 AMÉRICA DEL NORTE: MERCADO DE MEZCLAS PARA PAN, POR TIPO DE PRODUCTO, 2024-2032 (MILLONES DE USD) 70
    37. TABLA 37 AMÉRICA DEL NORTE: MERCADO DE MEZCLAS PARA PAN, POR CATEGORÍA, 2024-2032 (MILLONES DE USD) 70
    38. TABLA 38 AMÉRICA DEL NORTE: MERCADO DE MEZCLAS PARA PAN, POR USO FINAL, 2024-2032 (MILLONES DE USD) 71
    39. TABLA 39 AMÉRICA DEL NORTE: MERCADO DE MEZCLAS PARA PAN, POR CANAL DE DISTRIBUCIÓN, 2024-2032 (MILLONES DE USD) 71
    40. TABLA 40 AMÉRICA DEL NORTE: MERCADO DE MEZCLAS PARA PAN, POR TIPO DE PRODUCTO, 2024-2032 (MILES DE UNIDADES) 71
    41. TABLA 41 AMÉRICA DEL NORTE: MERCADO DE MEZCLAS PARA PAN, POR CATEGORÍA, 2024-2032 (MILES DE UNIDADES) 72
    42. TABLA 42 AMÉRICA DEL NORTE: MERCADO DE MEZCLAS PARA PAN, POR USO FINAL, 2024-2032 (MILES DE UNIDADES) 72
    43. TABLA 43 AMÉRICA DEL NORTE: MERCADO DE MEZCLAS PARA PAN, POR CANAL DE DISTRIBUCIÓN, 2024-2032 (MILES DE UNIDADES) 72
    44. TABLA 44 EE. UU.: MERCADO DE MEZCLAS PARA PAN, POR TIPO DE PRODUCTO, 2024-2032 (MILLONES DE USD) 73
    45. TABLA 45 EE. UU.: MERCADO DE MEZCLAS PARA PAN, POR CATEGORÍA, 2024-2032 (MILLONES DE USD) 73
    46. TABLA 46 EE. UU.: MERCADO DE MEZCLAS PARA HORNEAR, POR USO FINAL, 2024-2032 (MILLONES DE USD) 73
    47. TABLA 47 EE. UU.: MERCADO DE MEZCLAS PARA HORNEAR, POR CANAL DE DISTRIBUCIÓN, 2024-2032 (MILLONES DE USD) 74
    48. TABLA 48 EE. UU.: MERCADO DE MEZCLAS PARA PAN, POR TIPO DE PRODUCTO, 2024-2032 (MILES DE UNIDADES) 74
    49. TABLA 49 EE. UU.: MERCADO DE MEZCLAS PARA PAN, POR CATEGORÍA, 2024-2032 (MILES DE UNIDADES) 75
    50. TABLA 50 EE. UU.: MERCADO DE MEZCLAS PARA PAN, POR USO FINAL, 2024-2032 (MILES DE UNIDADES) 75
    51. TABLA 51 EE. UU.: MERCADO DE MEZCLAS PARA PAN, POR CANAL DE DISTRIBUCIÓN, 2024-2032 (MILES DE UNIDADES) 75
    52. TABLA 52 CANADÁ: MERCADO DE MEZCLAS PARA PAN, POR TIPO DE PRODUCTO, 2024-2032 (MILLONES DE USD) 76
    53. TABLA 53 CANADÁ: MERCADO DE MEZCLAS PARA HORNEAR, POR CATEGORÍA, 2024-2032 (MILLONES DE USD) 76
    54. TABLA 54 CANADÁ: MERCADO DE MEZCLAS PARA HORNEAR, POR USO FINAL, 2024-2032 (MILLONES DE USD) 76
    55. TABLA 55 CANADÁ: MERCADO DE MEZCLAS PARA PAN, POR CANAL DE DISTRIBUCIÓN, 2024-2032 (MILLONES DE USD) 77
    56. TABLA 56 CANADÁ: MERCADO DE MEZCLAS PARA PAN, POR TIPO DE PRODUCTO, 2024-2032 (MILES DE UNIDADES) 77
    57. TABLA 57 CANADÁ: MERCADO DE MEZCLAS PARA HORNEAR, POR CATEGORÍA, 2024-2032 (MILES DE UNIDADES) 77
    58. TABLA 58 CANADÁ: MERCADO DE MEZCLAS PARA HORNEAR, POR USO FINAL, 2024-2032 (MILES DE UNIDADES) 78
    59. TABLA 59 CANADÁ: MERCADO DE MEZCLAS PARA PANIFICACIÓN, POR CANAL DE DISTRIBUCIÓN, 2024-2032 (MILES DE UNIDADES) 78
    60. TABLA 60 MÉXICO: MERCADO DE MEZCLAS PARA PANIFICACIÓN, POR TIPO DE PRODUCTO, 2024-2032 (MILLONES DE USD) 79
    61. TABLA 61 MÉXICO: PANIFICACIÓN MERCADO DE MEZCLAS, POR CATEGORÍA, 2024-2032 (MILLONES DE USD) 79
    62. TABLA 62 MÉXICO: MERCADO DE MEZCLAS PARA PAN, POR USO FINAL, 2024-2032 (MILLONES DE USD) 79
    63. TABLA 63 MÉXICO: MERCADO DE MEZCLAS PARA PAN, POR DISTRIBUCIÓN CANAL, 2024-2032 (MILLONES DE USD) 80
    64. TABLA 64 MÉXICO: MERCADO DE MEZCLAS PARA PAN, POR TIPO DE PRODUCTO, 2024-2032 (MILES DE UNIDADES) 80
    65. TABLA 65 MÉXICO: MERCADO DE MEZCLAS PARA PAN, POR CATEGORÍA, 2024-2032 (MILES DE UNIDADES) 80
    66. CUADRO 66 MÉXICO: MERCADO DE MEZCLAS PARA PAN, POR USO FINAL, 2024-2032 (MILES DE UNIDADES) 81
    67. CUADRO 67 MÉXICO: MERCADO DE MEZCLAS PARA PAN, POR CANAL DE DISTRIBUCIÓN, 2024-2032 (MILES DE UNIDADES) 81
    68. TABLA 68 EUROPA: ESTIMACIONES DE MERCADO & PRONÓSTICOS POR PAÍS, 2024-2032 (MILLONES DE USD) 82
    69. TABLA 69 EUROPA: ESTIMACIONES DEL MERCADO & PRONÓSTICO, POR PAÍS, 2024-2032 (MILES DE UNIDADES) 83
    70. TABLA 70 EUROPA: MERCADO DE MEZCLAS PARA PAN, POR TIPO DE PRODUCTO, 2024-2032 (MILLONES DE USD) 83
    71. TABLA 71 EUROPA: MERCADO DE MEZCLAS PARA PAN, POR CATEGORÍA, 2024-2032 (MILLONES DE USD) 83
    72. TABLA 72 EUROPA: MERCADO DE MEZCLAS PARA HORNEAR, POR USO FINAL, 2024-2032 (MILLONES DE USD) 84
    73. TABLA 73 EUROPA: MERCADO DE MEZCLAS PARA HORNEAR, POR CANAL DE DISTRIBUCIÓN, 2024-2032 (USD MILLONES) 84
    74. TABLA 74 EUROPA: MERCADO DE MEZCLAS PARA PANIFICACIÓN, POR TIPO DE PRODUCTO, 2024-2032 (MILES DE UNIDADES) 84
    75. TABLA 75 EUROPA: MERCADO DE MEZCLAS PARA PANIFICACIÓN, POR CATEGORÍA, 2024-2032 (MILES DE UNIDADES) 85
    76. TABLA 76 EUROPA: MERCADO DE MEZCLAS PARA PANIFICACIÓN, POR USO FINAL, 2024-2032 (MILES DE UNIDADES) 85
    77. TABLA 77 EUROPA: MERCADO DE MEZCLAS PARA PANIFICACIÓN, POR CANAL DE DISTRIBUCIÓN, 2024-2032 (MILES DE UNIDADES) 85
    78. TABLA 78 REINO UNIDO: MERCADO DE MEZCLAS PARA HORNEAR, POR TIPO DE PRODUCTO, 2024-2032 (MILLONES DE USD) 86
    79. TABLA 79 Reino Unido: MERCADO DE MEZCLAS PARA HORNEAR, POR CATEGORÍA, 2024-2032 (MILLONES DE USD) 86
    80. TABLA 80 REINO UNIDO: MERCADO DE MEZCLAS PARA HORNEAR, POR USO FINAL, 2024-2032 (MILLONES DE USD) 86
    81. TABLA 81 Reino Unido: MERCADO DE MEZCLAS PARA HORNEAR, POR CANAL DE DISTRIBUCIÓN, 2024-2032 (MILLONES DE USD) 87
    82. TABLA 82 REINO UNIDO: MERCADO DE MEZCLAS PARA HORNEAR, POR PRODUCTO TIPO, 2024-2032 (MILES DE UNIDADES) 87
    83. TABLA 83 REINO UNIDO: MERCADO DE MEZCLAS PARA HORNEAR, POR CATEGORÍA, 2024-2032 (MILES DE UNIDADES) 88
    84. TABLA 84 REINO UNIDO: MERCADO DE MEZCLAS PARA HORNEAR, POR USO FINAL, 2024-2032 (MILES DE UNIDADES) 88
    85. TABLA 85 REINO UNIDO: MERCADO DE MEZCLAS PARA HORNEAR, POR CANAL DE DISTRIBUCIÓN, 2024-2032 (MILES DE UNIDADES) 88
    86. TABLA 86 ALEMANIA: MERCADO DE MEZCLAS PARA HORNEAR, POR TIPO DE PRODUCTO, 2024-2032 (MILLONES DE USD) 89
    87. TABLA 87 ALEMANIA: MERCADO DE MEZCLAS PARA HORNEAR, POR CATEGORÍA, 2024-2032 (MILLONES DE USD) 89
    88. TABLA 88 ALEMANIA: MERCADO DE MEZCLAS PARA HORNEAR, POR USO FINAL, 2024-2032 (MILLONES DE USD) 89
    89. TABLA 89 ALEMANIA: MERCADO DE MEZCLAS PARA PANIFICACIÓN, POR CANAL DE DISTRIBUCIÓN, 2024-2032 (MILLONES DE USD) 90
    90. TABLA 90 ALEMANIA: MERCADO DE MEZCLAS PARA PANIFICACIÓN, POR TIPO DE PRODUCTO, 2024-2032 (MILES DE UNIDADES) 90
    91. TABLA 91 ALEMANIA: PANIFICACIÓN MERCADO DE MEZCLAS, POR CATEGORÍA, 2024-2032 (MILES DE UNIDADES) 90
    92. TABLA 92 ALEMANIA: MERCADO DE MEZCLAS PARA PAN, POR USO FINAL, 2024-2032 (MILES DE UNIDADES) 91
    93. TABLA 93 ALEMANIA: MERCADO DE MEZCLAS PARA PAN, POR DISTRIBUCIÓN CANAL, 2024-2032 (MILES DE UNIDADES) 91
    94. TABLA 94 FRANCIA: MERCADO DE MEZCLAS PARA PANIFICACIÓN, POR TIPO DE PRODUCTO, 2024-2032 (MILLONES DE USD) 92
    95. TABLA 95 FRANCIA: MERCADO DE MEZCLAS PARA PANIFICACIÓN, POR CATEGORÍA, 2024-2032 (MILLONES DE USD) 92
    96. TABLA 96 FRANCIA: MERCADO DE MEZCLAS PARA HORNEAR, POR USO FINAL, 2024-2032 (MILLONES DE USD) 92
    97. TABLA 97 FRANCIA: MERCADO DE MEZCLAS PARA HORNEAR, POR CANAL DE DISTRIBUCIÓN, 2024-2032 (MILLONES DE USD) 93
    98. TABLA 98 FRANCIA: MERCADO DE MEZCLAS PARA PANIFICACIÓN, POR TIPO DE PRODUCTO, 2024-2032 (MILES DE UNIDADES) 93
    99. TABLA 99 FRANCIA: MERCADO DE MEZCLAS PARA PANIFICACIÓN, POR CATEGORÍA, 2024-2032 (MILES DE UNIDADES) 93
    100. TABLA 100 FRANCIA: MERCADO DE MEZCLAS PARA PANIFICACIÓN, POR USO FINAL, 2024-2032 (MILES DE UNIDADES) 94
    101. TABLA 101 FRANCIA: MERCADO DE MEZCLAS PARA PANIFICACIÓN, POR CANAL DE DISTRIBUCIÓN, 2024-2032 (MILES DE UNIDADES) 94
    102. TABLA 102 ITALIA: MERCADO DE MEZCLAS PARA PAN, POR TIPO DE PRODUCTO, 2024-2032 (MILLONES DE USD) 94
    103. TABLA 103 ITALIA: MERCADO DE MEZCLAS PARA PAN, POR CATEGORÍA, 2024-2032 (MILLONES DE USD) 95
    104. TABLA 104 ITALIA: MERCADO DE MEZCLAS PARA PAN, POR FINAL USO, 2024-2032 (MILLONES DE USD) 95
    105. TABLA 105 ITALIA: MERCADO DE MEZCLAS PARA PAN, POR CANAL DE DISTRIBUCIÓN, 2024-2032 (MILLONES DE USD) 95
    106. TABLA 106 ITALIA: MERCADO DE MEZCLAS PARA PAN, POR TIPO DE PRODUCTO, 2024-2032 (MILES DE UNIDADES) 96
    107. TABLA 107 ITALIA: MERCADO DE MEZCLAS PARA PANIFICACIÓN, POR CATEGORÍA, 2024-2032 (MILES DE UNIDADES) 96
    108. TABLA 108 ITALIA: MERCADO DE MEZCLAS PARA PANIFICACIÓN, POR USO FINAL, 2024-2032 (MILES DE UNIDADES) 96
    109. TABLA 109 ITALIA: MERCADO DE MEZCLAS PARA PANIFICACIÓN, POR CANAL DE DISTRIBUCIÓN, 2024-2032 (MILES DE UNIDADES) 97
    110. TABLA 110 ESPAÑA: MERCADO DE MEZCLAS PARA PANIFICACIÓN, POR TIPO DE PRODUCTO, 2024-2032 (MILLONES DE USD) 97
    111. TABLA 111 ESPAÑA: MERCADO DE MEZCLAS PARA PANIFICACIÓN, POR CATEGORÍA, 2024-2032 (MILLONES DE USD) 97
    112. TABLA 112 ESPAÑA: MERCADO DE MEZCLAS PARA PANIFICACIÓN, POR USO FINAL, 2024-2032 (MILLONES DE USD) 98
    113. TABLA 113 ESPAÑA: MERCADO DE MEZCLAS PARA PANIFICACIÓN, POR CANAL DE DISTRIBUCIÓN, 2024-2032 (MILLONES DE USD) 98
    114. TABLA 114 ESPAÑA: MERCADO DE MEZCLAS PARA PANIFICACIÓN, POR TIPO DE PRODUCTO, 2024-2032 (MILES DE UNIDADES) 98
    115. TABLA 115 ESPAÑA: PANIFICACIÓN MERCADO DE MEZCLAS, POR CATEGORÍA, 2024-2032 (MILES DE UNIDADES) 99
    116. TABLA 116 ESPAÑA: MERCADO DE MEZCLAS PARA PANIFICACIÓN, POR USO FINAL, 2024-2032 (MILES DE UNIDADES) 99
    117. TABLA 117 ESPAÑA: MERCADO DE MEZCLAS PARA PANIFICACIÓN, POR DISTRIBUCIÓN CANAL, 2024-2032 (MILES DE UNIDADES) 99
    118. TABLA 118 RESTO DE EUROPA: MERCADO DE MEZCLAS PARA PAN, POR TIPO DE PRODUCTO, 2024-2032 (MILLONES DE USD) 100
    119. TABLA 119 RESTO DE EUROPA: MERCADO DE MEZCLAS PARA PAN, POR CATEGORÍA, 2024-2032 (MILLONES DE USD) 100
    120. TABLA 120 RESTO DE EUROPA: MERCADO DE MEZCLAS PARA PANIFICACIÓN, POR USO FINAL, 2024-2032 (MILLONES DE USD) 100
    121. TABLA 121 RESTO DE EUROPA: MERCADO DE MEZCLAS PARA PANIFICACIÓN, POR CANAL DE DISTRIBUCIÓN, 2024-2032 (MILLONES DE USD) 101
    122. TABLA 122 RESTO DE EUROPA: MERCADO DE MEZCLAS PARA PAN, POR TIPO DE PRODUCTO, 2024-2032 (MILES DE UNIDADES) 101
    123. TABLA 123 RESTO DE EUROPA: MERCADO DE MEZCLAS PARA PAN, POR CATEGORÍA, 2024-2032 (MILES DE UNIDADES) 102
    124. TABLA 124 RESTO DE EUROPA: MERCADO DE MEZCLAS PARA PANIFICACIÓN, POR USO FINAL, 2024-2032 (MILES DE UNIDADES) 102
    125. TABLA 125 RESTO DE EUROPA: MERCADO DE MEZCLAS PARA PANIFICACIÓN, POR CANAL DE DISTRIBUCIÓN, 2024-2032 (MILES DE UNIDADES) 102
    126. TABLA 126 ASIA-PACÍFICO: ESTIMACIONES DE MERCADO & PRONÓSTICO, POR PAÍS, 2024-2032 (MILLONES DE USD) 103
    127. TABLA 127 ASIA-PACÍFICO: ESTIMACIONES DEL MERCADO Y EFECTOS PRONÓSTICO, POR PAÍS, 2024-2032 (MILES DE UNIDADES) 104
    128. TABLA 128 ASIA-PACÍFICO: MERCADO DE MEZCLAS PARA HORNEAR, POR TIPO DE PRODUCTO, 2024-2032 (MILLONES DE USD) 104
    129. TABLA 129 ASIA-PACÍFICO: MEZCLAS PARA HORNEAR MERCADO, POR CATEGORÍA, 2024-2032 (MILLONES DE USD) 105
    130. TABLA 130 ASIA-PACÍFICO: MERCADO DE MEZCLAS PARA HORNEAR, POR USO FINAL, 2024-2032 (MILLONES DE USD) 105
    131. TABLA 131 ASIA-PACÍFICO: MERCADO DE MEZCLAS PARA HORNEAR, POR CANAL DE DISTRIBUCIÓN, 2024-2032 (MILLONES DE USD) 105
    132. TABLA 132 ASIA-PACÍFICO: MERCADO DE MEZCLAS PARA HORNEAR, POR TIPO DE PRODUCTO, 2024-2032 (MILES DE UNIDADES) 106
    133. TABLA 133 ASIA-PACÍFICO: MERCADO DE MEZCLAS PARA HORNEAR, POR CATEGORÍA, 2024-2032 (MILES DE UNIDADES) 106
    134. TABLA 134 ASIA-PACÍFICO: MERCADO DE MEZCLAS PARA HORNEAR, POR USO FINAL, 2024-2032 (MILES DE UNIDADES) 106
    135. TABLA 135 ASIA-PACÍFICO: MERCADO DE MEZCLAS PARA HORNEAR, POR CANAL DE DISTRIBUCIÓN, 2024-2032 (MILES DE UNIDADES) 107
    136. TABLA 136 CHINA: MERCADO DE MEZCLAS PARA PAN, POR TIPO DE PRODUCTO, 2024-2032 (MILLONES DE USD) 107
    137. TABLA 137 CHINA: MERCADO DE MEZCLAS PARA PAN, POR CATEGORÍA, 2024-2032 (MILLONES DE USD) 107
    138. TABLA 138 CHINA: MERCADO DE MEZCLAS PARA PAN, POR USO FINAL, 2024-2032 (MILLONES DE USD) 108
    139. TABLA 139 CHINA: MERCADO DE MEZCLAS PARA PAN, POR CANAL DE DISTRIBUCIÓN, 2024-2032 (MILLONES DE USD) 108
    140. TABLA 140 CHINA: MERCADO DE MEZCLAS PARA PAN, POR TIPO DE PRODUCTO, 2024-2032 (MILES DE UNIDADES) 108
    141. TABLA 141 CHINA: MERCADO DE MEZCLAS PARA PAN, POR CATEGORÍA, 2024-2032 (MILES DE UNIDADES) 109
    142. TABLA 142 CHINA: MERCADO DE MEZCLAS PARA PAN, POR USO FINAL, 2024-2032 (MILES DE UNIDADES) 109
    143. TABLA 143 CHINA: MERCADO DE MEZCLAS PARA PAN, POR CANAL DE DISTRIBUCIÓN, 2024-2032 (MILES DE UNIDADES) 109
    144. TABLA 144 INDIA: MERCADO DE MEZCLAS PARA HORNEAR, POR TIPO DE PRODUCTO, 2024-2032 (MILLONES DE USD) 110
    145. TABLA 145 INDIA: MERCADO DE MEZCLAS PARA HORNEAR, POR CATEGORÍA, 2024-2032 (MILLONES DE USD) 110
    146. TABLA 146 INDIA: MERCADO DE MEZCLAS PARA HORNEAR, POR FINAL USO, 2024-2032 (MILLONES DE USD) 110
    147. TABLA 147 INDIA: MERCADO DE MEZCLAS PARA PAN, POR CANAL DE DISTRIBUCIÓN, 2024-2032 (MILLONES DE USD) 111
    148. TABLA 148 INDIA: MERCADO DE MEZCLAS PARA PAN, POR TIPO DE PRODUCTO, 2024-2032 (MILES DE UNIDADES) 111
    149. TABLA 149 INDIA: MERCADO DE MEZCLAS PARA PAN, POR CATEGORÍA, 2024-2032 (MILES DE UNIDADES) 111
    150. TABLA 150 INDIA: MERCADO DE MEZCLAS PARA PAN, POR USO FINAL, 2024-2032 (MILES DE UNIDADES) 112
    151. TABLA 151 INDIA: MERCADO DE MEZCLAS PARA PAN, POR CANAL DE DISTRIBUCIÓN, 2024-2032 (MILES DE UNIDADES) 112
    152. TABLA 152 JAPÓN: MERCADO DE MEZCLAS PARA PAN, POR TIPO DE PRODUCTO, 2024-2032 (MILLONES DE USD) 113
    153. TABLA 153 JAPÓN: MERCADO DE MEZCLAS PARA HORNEAR, POR CATEGORÍA, 2024-2032 (MILLONES DE USD) 113
    154. TABLA 154 JAPÓN: MERCADO DE MEZCLAS PARA HORNEAR, POR USO FINAL, 2024-2032 (MILLONES DE USD) 113
    155. TABLA 155 JAPÓN: MERCADO DE MEZCLAS PARA PANIFICACIÓN, POR CANAL DE DISTRIBUCIÓN, 2024-2032 (MILLONES DE USD) 114
    156. TABLA 156 JAPÓN: MERCADO DE MEZCLAS PARA PANIFICACIÓN, POR TIPO DE PRODUCTO, 2024-2032 (MILES DE UNIDADES) 114
    157. TABLA 157 JAPÓN: MERCADO DE MEZCLAS PARA HORNEAR, POR CATEGORÍA, 2024-2032 (MILES DE UNIDADES) 114
    158. TABLA 158 JAPÓN: MERCADO DE MEZCLAS PARA HORNEAR, POR USO FINAL, 2024-2032 (MILES DE UNIDADES) 115
    159. TABLA 159 JAPÓN: MERCADO DE MEZCLAS PARA PANIFICACIÓN, POR CANAL DE DISTRIBUCIÓN, 2024-2032 (MILES DE UNIDADES) 115
    160. TABLA 160 AUSTRALIA & NUEVA ZELANDA: MERCADO DE MEZCLAS PARA HORNEAR, POR TIPO DE PRODUCTO, 2024-2032 (MILLONES DE USD) 115
    161. TABLA 161 AUSTRALIA & NUEVA ZELANDA: MERCADO DE MEZCLAS PARA HORNEAR, POR CATEGORÍA, 2024-2032 (MILLONES DE USD) 116
    162. TABLA 162 AUSTRALIA & NUEVA ZELANDA: MERCADO DE MEZCLAS PARA HORNEAR, POR USO FINAL, 2024-2032 (MILLONES DE USD) 116
    163. TABLA 163 AUSTRALIA & NUEVA ZELANDA: MERCADO DE MEZCLAS PARA HORNEAR, POR CANAL DE DISTRIBUCIÓN, 2024-2032 (MILLONES DE USD) 116
    164. TABLA 164 AUSTRALIA & NUEVA ZELANDA: MERCADO DE MEZCLAS PARA HORNEAR, POR TIPO DE PRODUCTO, 2024-2032 (MILES DE UNIDADES) 117
    165. TABLA 165 AUSTRALIA & NUEVA ZELANDA: MERCADO DE MEZCLAS PARA HORNEAR, POR CATEGORÍA, 2024-2032 (MILES DE UNIDADES) 117
    166. TABLA 166 AUSTRALIA & NUEVA ZELANDA: MERCADO DE MEZCLAS PARA HORNEAR, POR USO FINAL, 2024-2032 (MILES DE UNIDADES) 117
    167. TABLA 167 AUSTRALIA & NUEVA ZELANDA: MERCADO DE MEZCLAS PARA HORNEAR, POR CANAL DE DISTRIBUCIÓN, 2024-2032 (MILES DE UNIDADES) 118
    168. TABLA 168 RESTO DE ASIA Y EL PACÍFICO: MERCADO DE MEZCLAS PARA HORNEAR, POR TIPO DE PRODUCTO, 2024-2032 (MILLONES DE USD) 118
    169. TABLA 169 RESTO DE ASIA-PACÍFICO: MERCADO DE MEZCLAS PARA HORNEAR, POR CATEGORÍA, 2024-2032 (MILLONES DE USD) 119
    170. TABLA 170 RESTO DE ASIA-PACÍFICO: MERCADO DE MEZCLAS PARA HORNEAR, POR USO FINAL, 2024-2032 (MILLONES DE USD) 119
    171. TABLA 171 RESTO DE ASIA-PACÍFICO: MERCADO DE MEZCLAS PARA HORNEAR, POR CANAL DE DISTRIBUCIÓN, 2024-2032 (MILLONES DE USD) 119
    172. TABLA 172 RESTO DE ASIA-PACÍFICO: MERCADO DE MEZCLAS PARA HORNEAR, POR TIPO DE PRODUCTO, 2024-2032 (MILES DE UNIDADES) 120
    173. TABLA 173 RESTO DE ASIA-PACÍFICO: MERCADO DE MEZCLAS PARA PAN, POR CATEGORÍA, 2024-2032 (MILES DE UNIDADES) 120
    174. TABLA 174 RESTO DE ASIA-PACÍFICO: MERCADO DE MEZCLAS PARA PAN, POR USO FINAL, 2024-2032 (MILES DE UNIDADES) 120
    175. TABLA 175 RESTO DE ASIA-PACÍFICO: MERCADO DE MEZCLAS PARA PANIFICACIÓN, POR CANAL DE DISTRIBUCIÓN, 2024-2032 (MILES DE UNIDADES) 121
    176. TABLA 176 RESTO DEL MUNDO: ESTIMACIONES DEL MERCADO & PRONÓSTICO, POR REGIÓN, 2024-2032 (MILLONES DE USD) 122
    177. TABLA 177 RESTO DEL MUNDO: ESTIMACIONES Y PREVISIONES DEL MERCADO PRONÓSTICO, POR REGIÓN, 2024-2032 (MILES DE UNIDADES) 123
    178. TABLA 178 RESTO DEL MUNDO: MERCADO DE MEZCLAS PARA PANIFICACIÓN, POR TIPO DE PRODUCTO, 2024-2032 (MILLONES DE USD) 123
    179. TABLA 179 RESTO DEL MUNDO: MEZCLAS PARA PANIFICACIÓN MERCADO, POR CATEGORÍA, 2024-2032 (MILLONES DE USD) 123
    180. TABLA 180 RESTO DEL MUNDO: MEZCLAS PARA HORNEAR MERCADO, POR USO FINAL, 2024-2032 (MILLONES DE USD) 124
    181. TABLA 181 RESTO DEL MUNDO: MEZCLAS PARA HORNEAR MERCADO, POR CANAL DE DISTRIBUCIÓN, 2024-2032 (MILLONES DE USD) 124
    182. TABLA 182 RESTO DEL MUNDO: MEZCLAS PARA PANIFICACIÓN MERCADO, POR TIPO DE PRODUCTO, 2024-2032 (MILES DE UNIDADES) 124
    183. TABLA 183 RESTO DEL MUNDO: PANIFICACIÓN MERCADO DE MEZCLAS, POR CATEGORÍA, 2024-2032 (MILES DE UNIDADES) 125
    184. TABLA 184 RESTO DEL MUNDO: MERCADO DE MEZCLAS PARA PANIFICACIÓN, POR USO FINAL, 2024-2032 (MILES DE UNIDADES) 125
    185. TABLA 185 RESTO DEL MUNDO: PANIFICACIÓN MERCADO DE MEZCLAS, POR CANAL DE DISTRIBUCIÓN, 2024-2032 (MILES DE UNIDADES) 125
    186. TABLA 186 SUDAMÉRICA: MERCADO DE MEZCLAS PARA PANIFICACIÓN, POR TIPO DE PRODUCTO, 2024-2032 (MILLONES DE USD) 126
    187. TABLA 187 AMÉRICA DEL SUR: MERCADO DE MEZCLAS PARA HORNEAR, POR CATEGORÍA, 2024-2032 (MILLONES DE USD) 126
    188. TABLA 188 SUDAMÉRICA: MERCADO DE MEZCLAS PARA HORNEAR, POR USO FINAL, 2024-2032 (MILLONES DE USD) 126
    189. TABLA 189 AMÉRICA DEL SUR: MEZCLAS PARA HORNEAR MERCADO, POR CANAL DE DISTRIBUCIÓN, 2024-2032 (MILLONES DE USD) 127
    190. TABLA 190 SUDAMÉRICA: MERCADO DE MEZCLAS PARA PANIFICACIÓN, POR TIPO DE PRODUCTO, 2024-2032 (MILES DE UNIDADES) 127
    191. TABLA 191 SUDAMÉRICA: PANIFICACIÓN MERCADO DE MEZCLAS, POR CATEGORÍA, 2024-2032 (MILES DE UNIDADES) 128
    192. TABLA 192 SUDAMÉRICA: MERCADO DE MEZCLAS PARA PANIFICACIÓN, POR USO FINAL, 2024-2032 (MILES DE UNIDADES) 128
    193. TABLA 193 AMÉRICA DEL SUR: MEZCLAS PARA PANIFICACIÓN MERCADO, POR CANAL DE DISTRIBUCIÓN, 2024-2032 (MILES DE UNIDADES) 128
    194. TABLA 194 ORIENTE MEDIO: MEZCLAS PARA PANIFICACIÓN MERCADO, POR TIPO DE PRODUCTO, 2024-2032 (MILLONES DE USD) 129
    195. TABLA 195 ORIENTE MEDIO: MEZCLAS PARA PANIFICACIÓN MERCADO, POR CATEGORÍA, 2024-2032 (MILLONES DE USD) 129
    196. TABLA 196 ORIENTE MEDIO: MERCADO DE MEZCLAS PARA HORNEAR, POR USO FINAL, 2024-2032 (MILLONES DE USD) 129
    197. TABLA 197 ORIENTE MEDIO: MERCADO DE MEZCLAS PARA HORNEAR, POR CANAL DE DISTRIBUCIÓN, 2024-2032 (MILLONES DE USD) 130
    198. TABLA 198 ORIENTE MEDIO: MERCADO DE MEZCLAS PARA PAN, POR TIPO DE PRODUCTO, 2024-2032 (MILES DE UNIDADES) 130
    199. TABLA 199 ORIENTE MEDIO: MERCADO DE MEZCLAS PARA PAN, POR CATEGORÍA, 2024-2032 (MILES DE UNIDADES) 130
    200. TABLA 200 ORIENTE MEDIO: MERCADO DE MEZCLAS PARA PAN, POR USO FINAL, 2024-2032 (MILES DE UNIDADES) 131
    201. TABLA 201 ORIENTE MEDIO: MERCADO DE MEZCLAS PARA PAN, POR DISTRIBUCIÓN CANAL, 2024-2032 (MILES DE UNIDADES) 131
    202. TABLA 202 ÁFRICA: MERCADO DE MEZCLAS PARA PAN, POR TIPO DE PRODUCTO, 2024-2032 (MILLONES DE USD) 131
    203. TABLA 203 ÁFRICA: MERCADO DE MEZCLAS PARA PAN, POR CATEGORÍA, 2024-2032 (MILLONES DE USD) 132
    204. TABLA 204 ÁFRICA: MERCADO DE MEZCLAS PARA HORNEAR, POR USO FINAL, 2024-2032 (MILLONES DE USD) 132
    205. TABLA 205 ÁFRICA: MERCADO DE MEZCLAS PARA HORNEAR, POR CANAL DE DISTRIBUCIÓN, 2024-2032 (MILLONES DE USD) 132
    206. TABLA 206 ÁFRICA: MERCADO DE MEZCLAS PARA PAN, POR TIPO DE PRODUCTO, 2024-2032 (MILES DE UNIDADES) 133
    207. TABLA 207 ÁFRICA: MERCADO DE MEZCLAS PARA PAN, POR CATEGORÍA, 2024-2032 (MILES DE UNIDADES) 133
    208. TABLA 208 ÁFRICA: MERCADO DE MEZCLAS PARA PAN, POR USO FINAL, 2024-2032 (MILES DE UNIDADES) 133
    209. TABLA 209 ÁFRICA: MERCADO DE MEZCLAS PARA PAN, POR CANAL DE DISTRIBUCIÓN, 2024-2032 (MILES DE UNIDADES) 134
    210. TABLA 210 EXPANSIONES 136
    211. TABLA 211 LANZAMIENTO DE PRODUCTO 137
    212. TABLA 212 ADQUISICIÓN 137
    213. TABLA 213 GENERAL MILLS, INC.: PRODUCTOS OFRECIDOS 139
    214. TABLA 214 CONAGRA BRANDS, INC.: PRODUCTOS OFRECIDOS 143
    215. TABLA 215 CONAGRA BRANDS, INC.: DESARROLLOS CLAVE 143
    216. TABLA 216 CHELSEA MILLING COMPANY: PRODUCTOS OFRECIDOS 145
    217. TABLA 217 ASSOCIATION BRITISH FOODS PLC: PRODUCTOS OFRECIDOS 148
    218. TABLA 218 ASSOCIATION BRITISH FOODS PLC: DESARROLLOS CLAVE 148
    219. TABLA 219 MONDEL?Z INTERNATIONAL, INC.: PRODUCTOS OFRECIDOS 151
    220. TABLA 220 BOB’S RED MILL NATURAL FOODS, INC.: PRODUCTOS OFRECIDOS 153
    221. TABLA 221 HAIN CELESTIAL: PRODUCTOS OFRECIDOS 156
    222. TABLA 222 KETO AND COMPANY: PRODUCTOS OFRECIDOS 157
    223. TABLA 223 CONTINENTAL MILLS, INC.: PRODUCTOS OFRECIDOS 158
    224. TABLA 224 DAWN FOOD PRODUCTS, INC.: PRODUCTOS OFRECIDOS 160
    225. TABLA 225 DAWN FOOD PRODUCTS, INC.: DESARROLLOS CLAVE 160
  21. 16 LISTA DE CIFRAS
    1. FIGURA 1 MERCADO SINOPSIS 18
    2. FIGURA 2 ANÁLISIS DEL ATRACTIVO DEL MERCADO: MERCADO MUNDIAL DE MEZCLAS PARA HORNEAR, 2023 19
    3. FIGURA 3 ANÁLISIS DEL MERCADO MUNDIAL DE MEZCLAS PARA HORNEAR, POR TIPO DE PRODUCTO 20
    4. FIGURA 4 MERCADO MUNDIAL DE MEZCLAS PARA HORNEAR ANÁLISIS, POR CATEGORÍA 21
    5. FIGURA 5 MERCADO GLOBAL DE MEZCLAS PARA HORNEAR ANÁLISIS, POR USO FINAL 22
    6. FIGURA 6 ANÁLISIS DEL MERCADO GLOBAL DE MEZCLAS PARA HORNEAR, POR CANAL DE DISTRIBUCIÓN 23
    7. FIGURA 7 MERCADO MUNDIAL DE MEZCLAS PARA HORNEAR, POR CANAL DE DISTRIBUCIÓN ANÁLISIS, POR REGIÓN, 2023 24
    8. FIGURA 8 MERCADO MUNDIAL DE MEZCLAS PARA HORNEAR: ESTRUCTURA 25
    9. FIGURA 9 CRITERIOS CLAVE DE COMPRA PARA MEZCLAS PARA HORNEAR 26
    10. FIGURA 10 PROCESO DE INVESTIGACIÓN 27
    11. FIGURA 11 ENFOQUES DE ARRIBA ABAJO Y ARRIBA 30
    12. FIGURA 12 DESCRIPCIÓN GENERAL DE LA DINÁMICA DEL MERCADO 33
    13. FIGURA 13 ANÁLISIS DE IMPACTO DE LOS IMPULSORES: MERCADO DE MEZCLAS PARA HORNEAR 35
    14. FIGURA 14 ANÁLISIS DE IMPACTO DE LAS RESTRICCIONES: MEZCLAS PARA HORNEAR MERCADO 36
    15. FIGURA 15 MERCADO MUNDIAL DE MEZCLAS PARA HORNEAR: CADENA DE VALOR DE MEZCLAS PARA TORTAS 38
    16. FIGURA 16 MERCADO MUNDIAL DE MEZCLAS PARA HORNEAR: CADENA DE SUMINISTRO 40
    17. FIGURA 18 MERCADO MUNDIAL DE MEZCLAS PARA HORNEAR, POR TIPO DE PRODUCTO, 2023 (% DE PARTICIPACIÓN) 49
    18. GRÁFICO 19 MERCADO MUNDIAL DE MEZCLAS PARA HORNEAR, POR TIPO DE PRODUCTO, 2024-2032 (MILLONES DE USD) 49
    19. GRÁFICO 20 MERCADO MUNDIAL DE MEZCLAS PARA HORNEAR, POR CATEGORÍA, 2023 (% DE PARTICIPACIÓN) 55
    20. GRÁFICO 21 MERCADO MUNDIAL DE MEZCLAS PARA HORNEAR, POR CATEGORÍA, 2024-2032 (MILLONES DE USD) 55
    21. GRÁFICO 22 MERCADO MUNDIAL DE MEZCLAS PARA HORNEAR, POR USO FINAL, 2023 (% DE PARTICIPACIÓN) 59
    22. GRÁFICO 23 GLOBAL MERCADO DE MEZCLAS PARA PAN, POR USO FINAL, 2024-2032 (MILLONES DE USD) 59
    23. GRÁFICO 24 MERCADO MUNDIAL DE MEZCLAS PARA PAN, POR CANAL DE DISTRIBUCIÓN, 2023 (% DE PARTICIPACIÓN) 63
    24. GRÁFICO 25 MERCADO MUNDIAL DE MEZCLAS PARA PAN, POR DISTRIBUCIÓN CANAL, 2024-2032 (MILLONES DE USD) 63
    25. GRÁFICO 26 MERCADO MUNDIAL DE MEZCLAS PARA PAN, POR REGIÓN, 2024-2032 (MILLONES DE USD) 67
    26. GRÁFICO 27 MERCADO MUNDIAL DE MEZCLAS PARA PAN, POR REGIÓN, 2023 (PARTICIPACIÓN) 67
    27. GRÁFICO 28 AMÉRICA DEL NORTE: PARTICIPACIÓN DE MERCADO DE MEZCLAS PARA HORNEAR, POR PAÍS, 2023 (% DE PARTICIPACIÓN) 69
    28. GRÁFICO 29 EUROPA: PARTICIPACIÓN DE MERCADO DE MEZCLAS PARA HORNEAR, POR PAÍS, 2023 (% DE PARTICIPACIÓN) 82
    29. FIGURA 30 ASIA-PACÍFICO: PARTICIPACIÓN DE MERCADO DE MEZCLAS PARA HORNEAR, POR PAÍS, 2023 (% DE PARTICIPACIÓN) 103
    30. GRÁFICO 31 RESTO DEL MUNDO: PARTICIPACIÓN DE MERCADO DE MEZCLAS PARA HORNEAR, POR REGIÓN, 2023 (% DE PARTICIPACIÓN) 122
    31. GRÁFICO 32 GENERAL MILLS INC.: RESUMEN FINANCIERO INSTANTÁNEA 139
    32. FIGURA 33 GENERAL MILLS, INC.: ANÁLISIS FODA 140
    33. FIGURA 34 CONAGRA BRANDS, INC.: RESUMEN FINANCIERO INSTANTÁNEA 142
    34. FIGURA 35 CONAGRA BRANDS, INC.: ANÁLISIS FODA 144
    35. FIGURA 36 ASSOCIATION BRITISH FOODS PLC: RESUMEN FINANCIERO INSTANTÁNEO 147
    36. FIGURA 37 ASSOCIATION BRITISH FOODS PLC: ANÁLISIS FODA 149
    37. FIGURA 38 MONDEL?Z INTERNATIONAL, INC.: RESUMEN FINANCIERO INSTANTÁNEA 151
    38. FIGURA 39 MONDEL?Z INTERNATIONAL, INC.: ANÁLISIS FODA 152
    39. FIGURA 40 HAIN CELESTIAL: RESUMEN FINANCIERO INSTANTÁNEA 155
    40. FIGURA 41 DAWN FOOD PRODUCTS, INC.: ANÁLISIS FODA 161

Segmentación del mercado

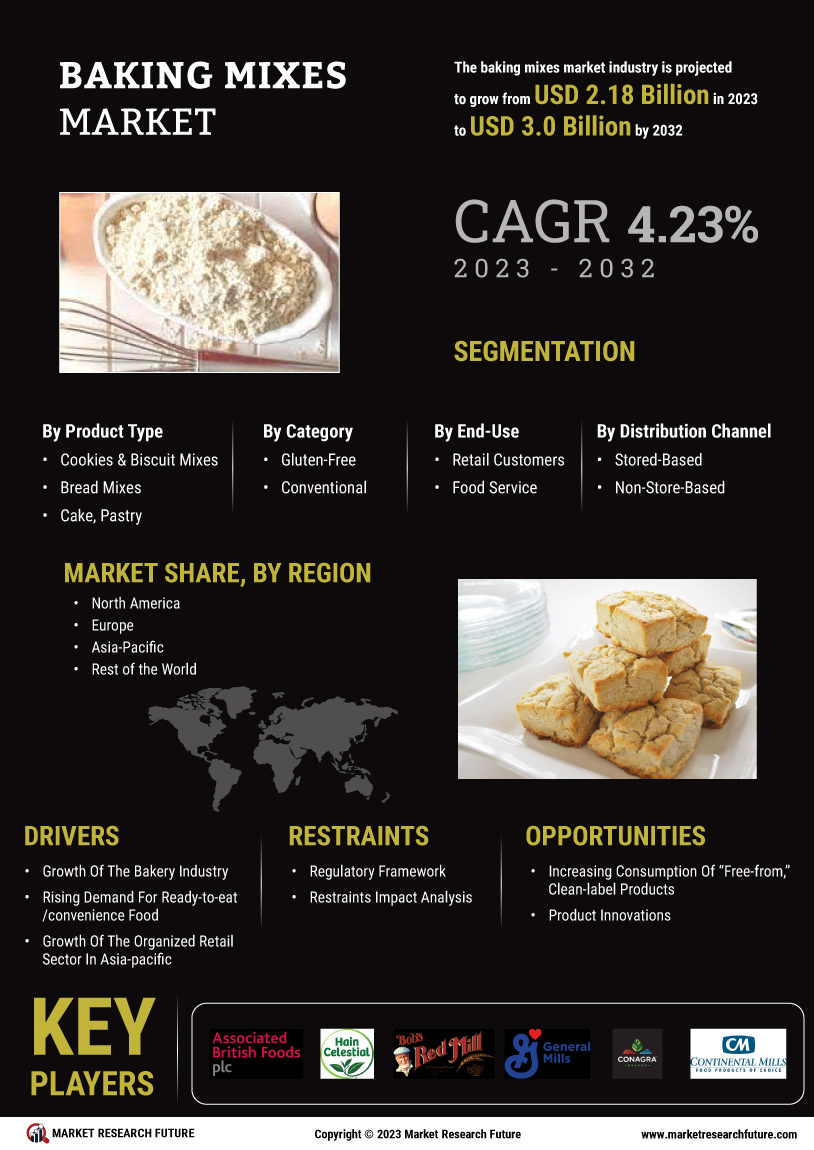
Perspectivas del mercado de mezclas para hornear por tipo de producto (miles de millones de dólares, 2018-2032)

  • Cookies y cookies Mezclas de galletas
  • Mezclas de pan
  • Tortas, pasteles y & Mezclas para muffins
  • Otros

Mercado de mezclas para hornear por categoría: perspectivas (miles de millones de dólares, 2018-2032)

  • Sin gluten
  • Convencional

 Mercado de mezclas para hornear según perspectivas de uso final (miles de millones de dólares, 2018-2032)

  • Clientes minoristas
  • Servicio de alimentación

 Mercado de mezclas para hornear por perspectiva del canal de distribución (miles de millones de dólares, 2018-2032)

  • Basado en almacenamiento
  • No basado en tienda

 Mercado de mezclas para hornear por tipo de producto (miles de millones de dólares, 2018-2032)

  • Mercado de mezclas para hornear de América del Norte por tipo de producto
  • Cookies y cookies Mezclas de galletas
  • Mezclas de pan
  • Tortas, pasteles y & Mezclas para muffins
  • Otros
  • Mercado de mezclas para hornear de América del Norte por categoría
  • Sin gluten
  • Convencional
  • Mercado de mezclas para hornear en América del Norte por uso final
  • Clientes minoristas
  • Servicio de alimentación
  • Mercado de mezclas para hornear en América del Norte por canal de distribución
  • Basado en almacenamiento
  • No basado en tienda
  • Perspectivas de EE. UU. (miles de millones de dólares, 2018-2032)
  • Mercado de mezclas para hornear de EE. UU. por tipo de producto
  • Cookies y cookies Mezclas de galletas
  • Mezclas de pan
  • Tortas, pasteles y & Mezclas para muffins
  • Otros
  • Mercado de mezclas para hornear de EE. UU. por categoría
  • Sin gluten
  • Convencional
  • Mercado de mezclas para hornear en EE. UU. por uso final
  • Clientes minoristas
  • Servicio de alimentación
  • Mercado de mezclas para hornear en EE. UU. por canal de distribución
  • Basado en almacenamiento
  • No basado en tienda
  • CANADÁ Perspectivas (miles de millones de dólares, 2018-2032)
  • Mercado de mezclas para hornear en CANADÁ por tipo de producto
  • Cookies y cookies Mezclas de galletas
  • Mezclas de pan
  • Tortas, pasteles y & Mezclas para muffins
  • Otros
  • Mercado de mezclas para hornear en CANADÁ por categoría
  • Sin gluten
  • Convencional
  • Mercado de mezclas para hornear en CANADÁ por uso final
  • Clientes minoristas
  • Servicio de alimentación
  • Mercado de mezclas para hornear en CANADÁ por canal de distribución
  • Basado en almacenamiento
  • No basado en tienda
  • Perspectivas de Europa (miles de millones de dólares, 2018-2032)
  • Mercado europeo de mezclas para hornear por tipo de producto
  • Cookies y cookies Mezclas de galletas
  • Mezclas de pan
  • Tortas, pasteles y & Mezclas para muffins
  • Otros
  • Mercado europeo de mezclas para hornear por categoría
  • Sin gluten
  • Convencional
  • Mercado europeo de mezclas para hornear por uso final
  • Clientes minoristas
  • Servicio de alimentación
  • Mercado europeo de mezclas para hornear por canal de distribución
  • Basado en almacenamiento
  • No basado en tienda
  • Alemania Perspectivas (miles de millones de dólares, 2018-2032)
  • Mercado de mezclas para hornear en Alemania por tipo de producto
  • Cookies y cookies Mezclas de galletas
  • Mezclas de pan
  • Tortas, pasteles y & Mezclas para muffins
  • Otros
  • Mercado de mezclas para hornear en Alemania por categoría
  • Sin gluten
  • Convencional
  • Mercado de mezclas para hornear en Alemania por uso final
  • Clientes minoristas
  • Servicio de alimentación
  • Mercado de mezclas para hornear en Alemania por canal de distribución
  • Basado en almacenamiento
  • No basado en tienda
  • Perspectivas de Francia (miles de millones de dólares, 2018-2032)
  • Mercado de mezclas para hornear en Francia por tipo de producto
  • Cookies y cookies Mezclas de galletas
  • Mezclas de pan
  • Tortas, pasteles y & Mezclas para muffins
  • Otros
  • Mercado de mezclas para hornear en Francia por categoría
  • Sin gluten
  • Convencional
  • Mercado francés de mezclas para hornear por uso final
  • Clientes minoristas
  • Servicio de alimentación
  • Mercado francés de mezclas para hornear por canal de distribución
  • Basado en almacenamiento
  • No basado en tienda
  • Perspectivas del Reino Unido (miles de millones de dólares, 2018-2032)
  • Mercado de mezclas para hornear en el Reino Unido por tipo de producto
  • Cookies y cookies Mezclas de galletas
  • Mezclas de pan
  • Tortas, pasteles y & Mezclas para muffins
  • Otros
  • Mercado de mezclas para hornear en el Reino Unido por categoría
  • Sin gluten
  • Convencional
  • Mercado de mezclas para hornear en el Reino Unido por uso final
  • Clientes minoristas
  • Servicio de alimentación
  • Mercado de mezclas para hornear en el Reino Unido por canal de distribución
  • Basado en almacenamiento
  • No basado en tienda
  • ITALIA Perspectivas (miles de millones de dólares, 2018-2032)
  • Mercado de mezclas para hornear en ITALIA por tipo de producto
  • Cookies y cookies Mezclas de galletas
  • Mezclas de pan
  • Tortas, pasteles y & Mezclas para muffins
  • Otros
  • Mercado de mezclas para hornear en ITALIA por categoría
  • Sin gluten
  • Convencional
  • Mercado de mezclas para hornear en ITALIA por uso final
  • Clientes minoristas
  • Servicio de alimentación
  • Mercado de mezclas para hornear en ITALIA por canal de distribución
  • Basado en almacenamiento
  • No basado en tienda
  • ESPAÑA Perspectivas (Miles de millones de dólares, 2018-2032)
  • Mercado de mezclas para hornear en España por tipo de producto
  • Cookies y cookies Mezclas de galletas
  • Mezclas de pan
  • Tortas, pasteles y & Mezclas para muffins
  • Otros
  • Mercado de mezclas para hornear en España por categoría
  • Sin gluten
  • Convencional
  • Mercado español de mezclas para hornear por uso final
  • Clientes minoristas
  • Servicio de alimentación
  • Mercado de mezclas para repostería en España por canal de distribución
  • Basado en almacenamiento
  • No basado en tienda
  • Resto de Europa Perspectivas (miles de millones de dólares, 2018-2032)
  • Mercado de mezclas para hornear en el resto de Europa por tipo de producto
  • Cookies y cookies Mezclas de galletas
  • Mezclas de pan
  • Tortas, pasteles y & Mezclas para muffins
  • Otros
  • RESTO DE EUROPA Mercado de mezclas para hornear por categoría
  • Sin gluten
  • Convencional
  • RESTO DE EUROPA Mercado de mezclas para hornear por uso final
  • Clientes minoristas
  • Servicio de alimentación
  • RESTO DE EUROPA Mercado de mezclas para hornear por canal de distribución
  • Basado en almacenamiento
  • No basado en tienda
  • Perspectivas de Asia y el Pacífico (miles de millones de dólares, 2018-2032)
  • Mercado de mezclas para hornear de Asia y el Pacífico por tipo de producto
  • Cookies y cookies Mezclas de galletas
  • Mezclas de pan
  • Tortas, pasteles y & Mezclas para muffins
  • Otros
  • Mercado de mezclas para hornear de Asia y el Pacífico por categoría
  • Sin gluten
  • Convencional
  • Mercado de mezclas para hornear en Asia y el Pacífico por uso final
  • Clientes minoristas
  • Servicio de alimentación
  • Mercado de mezclas para hornear de Asia y el Pacífico por canal de distribución
  • Basado en almacenamiento
  • No basado en tienda
  • Perspectivas de China (miles de millones de dólares, 2018-2032)
  • Mercado de mezclas para hornear de China por tipo de producto
  • Cookies y cookies Mezclas de galletas
  • Mezclas de pan
  • Tortas, pasteles y & Mezclas para muffins
  • Otros
  • Mercado de mezclas para hornear de China por categoría
  • Sin gluten
  • Convencional
  • Mercado chino de mezclas para hornear por uso final
  • Clientes minoristas
  • Servicio de alimentación
  • Mercado de mezclas para hornear en China por canal de distribución
  • Basado en almacenamiento
  • No basado en tienda
  • Japón Perspectivas (miles de millones de dólares, 2018-2032)
  • Mercado japonés de mezclas para hornear por tipo de producto
  • Cookies y cookies Mezclas de galletas
  • Mezclas de pan
  • Tortas, pasteles y & Mezclas para muffins
  • Otros
  • Mercado japonés de mezclas para hornear por categoría
  • Sin gluten
  • Convencional
  • Mercado japonés de mezclas para hornear por uso final
  • Clientes minoristas
  • Servicio de alimentación
  • Mercado japonés de mezclas para hornear por canal de distribución
  • Basado en almacenamiento
  • No basado en tienda
  • India Perspectivas (miles de millones de dólares, 2018-2032)
  • Mercado de mezclas para hornear en la India por tipo de producto
  • Cookies y cookies Mezclas de galletas
  • Mezclas de pan
  • Tortas, pasteles y & Mezclas para muffins
  • Otros
  • Mercado de mezclas para hornear en la India por categoría
  • Sin gluten
  • Convencional
  • Mercado de mezclas para hornear en India por uso final
  • Clientes minoristas
  • Servicio de alimentación
  • Mercado de mezclas para hornear en India por canal de distribución
  • Basado en almacenamiento
  • No basado en tienda
  • Australia Perspectivas (miles de millones de dólares, 2018-2032)
  • Mercado de mezclas para hornear de Australia por tipo de producto
  • Cookies y cookies Mezclas de galletas
  • Mezclas de pan
  • Tortas, pasteles y & Mezclas para muffins
  • Otros
  • Mercado de mezclas para hornear de Australia por categoría
  • Sin gluten
  • Convencional
  • Mercado australiano de mezclas para hornear por uso final
  • Clientes minoristas
  • Servicio de alimentación
  • Mercado australiano de mezclas para hornear por canal de distribución
  • Basado en almacenamiento
  • No basado en tienda
  • Resto de Perspectivas de Asia y el Pacífico (miles de millones de dólares, 2018-2032)
  • Mercado de mezclas para hornear del resto de Asia y el Pacífico por tipo de producto
  • Cobre
  • Aluminio
  • Resto del mercado de mezclas para hornear de Asia y el Pacífico por categoría
  • Sin gluten
  • Convencional
  • Resto del mercado de mezclas para hornear de Asia y el Pacífico por uso final
  • Clientes minoristas
  • Servicio de alimentación
  • Resto del mercado de mezclas para hornear de Asia y el Pacífico por canal de distribución
  • Basado en almacenamiento
  • No basado en tienda
  • Perspectivas del resto del mundo (miles de millones de dólares, 2018-2032)
  • Mercado de mezclas para hornear del resto del mundo por tipo de producto
  • Cookies y cookies Mezclas de galletas
  • Mezclas de pan
  • Tortas, pasteles y & Mezclas para muffins
  • Otros
  • Mercado de mezclas para hornear del resto del mundo por categoría
  • Sin gluten
  • Convencional
  • Mercado de mezclas para hornear en el resto del mundo por uso final
  • Clientes minoristas
  • Servicio de alimentación
  • Mercado de mezclas para hornear en el resto del mundo por canal de distribución
  • Basado en almacenamiento
  • No basado en tienda

Perspectivas de Oriente Medio (miles de millones de dólares, 2018-2032)

  • Mercado de mezclas para hornear de Oriente Medio por tipo de producto
  • Cookies y cookies Mezclas de galletas
  • Mezclas de pan
  • Tortas, pasteles y & Mezclas para muffins
  • Otros
  • Medio OrienteMercado de mezclas para hornear por categoría
  • Sin gluten
  • Convencional
  • Mercado de mezclas para hornear en Oriente Medio por uso final
  • Clientes minoristas
  • Servicio de alimentación
  • Mercado de mezclas para hornear en Oriente Medio por canal de distribución
  • Basado en almacenamiento
  • No basado en tienda
  • África Perspectivas (miles de millones de dólares, 2018-2032)
  • Mercado de mezclas para hornear en África por tipo de producto
  • Cookies y cookies Mezclas de galletas
  • Mezclas de pan
  • Tortas, pasteles y & Mezclas para muffins
  • Otros
  • Mercado de mezclas para hornear en África por categoría
  • Sin gluten
  • Convencional
  • Mercado africano de mezclas para hornear por uso final
  • Clientes minoristas
  • Servicio de alimentación
  • Mercado de mezclas para hornear en África por canal de distribución
  • Basado en almacenamiento
  • No basado en tienda
  • Perspectivas de América Latina (miles de millones de dólares, 2018-2032)
  • Mercado de mezclas para hornear en América Latina por tipo de producto
  • Cookies y cookies Mezclas de galletas
  • Mezclas de pan
  • Tortas, pasteles y & Mezclas para muffins
  • Otros
  • Mercado de mezclas para hornear en América Latina por categoría
  • Sin gluten
  • Convencional
  • Mercado latinoamericano de mezclas para hornear por uso final
  • Clientes minoristas
  • Servicio de alimentación
  • Mercado latinoamericano de mezclas para hornear por canal de distribución
  • Basado en almacenamiento
  • No basado en tienda

Compare Licence

×
Features License Type
Single User Multiuser License Enterprise User
Price $4,950 $5,950 $7,250
Maximum User Access Limit 1 User Upto 10 Users Unrestricted Access Throughout the Organization
Free Customization
Direct Access to Analyst
Deliverable Format
Platform Access
Discount on Next Purchase 10% 15% 15%
Printable Versions