• Cat-intel
  • MedIntelliX
  • Resources
  • About Us
  • Hero Background
    English
    Chinese
    French
    Japanese
    Korean
    German
    Spanish

    Viscosity Index Improvers Market Analysis

    ID: MRFR/CnM/10035-HCR
    128 Pages
    Anshula Mandaokar
    October 2025

    Viscosity Index Improvers Market Research Report Information By Type (Polymethacrylate, Olefin Copolymer, and Polyisobutylene), By End-User (Manufacturing, Food Processing, Mining, Construction, and Power generation), And By Region (North America, Europe, Asia-Pacific, And Rest Of The World) –Market Forecast Till 2035

    Share:
    Download PDF ×

    We do not share your information with anyone. However, we may send you emails based on your report interest from time to time. You may contact us at any time to opt-out.

    Viscosity Index Improvers Market Infographic
    $ 4,950.0
    $ 5,950.0
    $ 7,250.0

    Market Analysis

    In-depth Analysis of Viscosity Index Improvers Market Industry Landscape

    The viscosity index improvers (VIIs) market exists as part of a greater lubricant additives industry, offering an important functionality in the betterment process of all lubricating oil. Market behavior in the field, as one can observe, is affected by the different combinations of factors that can influence both supply and demand. Primarily, the oil-industry, a large user of lubricants especially the viscosity index improvers, drives a large consumptions to these products. Along with the industry's upsurge, mainly in the developing countries, it becomes crucial for lubricants to provide high performance and be able to guarantee this in the right engine settings.

    Besides, the global economy conditions is the factor which also effect to the market behaviour of the viscosity index improvers. Economic recession may cause a reduction in production activities including their needs for lubricants and, consequently, VIIs demands will be affected. However, the key spin off from good economic situations may be the stimulation of manufacturing and car transports that will in turn result in a boost in demand for lubricants and viscosity modifiers.

    Innovation and technology are aspects which boosr the market performance of VIIs. Remarkably, research and development strategies aim at the manufacture of more competent and strong viscosity index improvers. Producers continuously try to design products that exceed the already existing standards but also potentially solve the problems that customers have identified such as fuel efficiency and carbon emissions. All these technological innovations can enable companies to have an edge over the others in the ever-changing world of business.

    The environmental control, in another measure, ha significant influence on the mass market of the viscosity improvers. With stricter carbon emission regulations and directives on sustainability being put in place in governments globally, there is a trend towards developing lubes that offer a lower environmental footprint. The trend subsequently forces manufacturers to put their money in VFC technologies that enable energy efficiency and lower down the carbon footprint thus meeting the global call for green technology.

    Competition also plays a prime role in molding market dynamics in the sector of viscosity index improvers. A combination of well-entrenched multinational companies and budding local players results in an intensified competition which in turn encourages companies to devise their approach on how they will be able to stand-out through product differentiation, pricing strategies, and customer service. Market consolidation through mergers and acquisitions by competitors can even impact power distribution among significant players, constraining the degree of market concentration.

    Market Summary

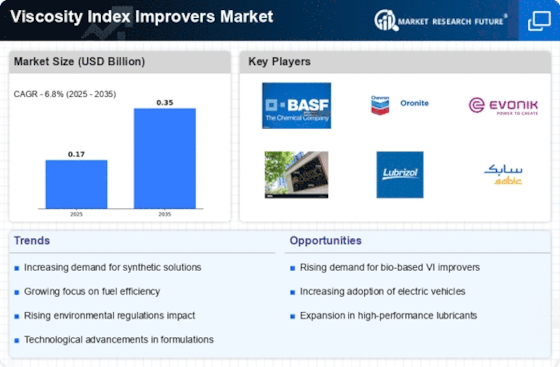
    As per Market Research Future Analysis, the Global Viscosity Index Improvers Market was valued at USD 0.17 billion in 2024 and is projected to grow to USD 0.35 billion by 2035, with a CAGR of 6.80% from 2025 to 2035. Key drivers include rising electric vehicle adoption and expanding markets in emerging economies. The automotive sector's advancements and increasing lubricant demand due to industrialization are also significant contributors to market growth.

    Key Market Trends & Highlights

    The Viscosity Index Improvers market is witnessing notable trends driven by technological advancements and increasing demand.

    • Electric vehicle manufacturing in the EU grew to 11% in 2020 from 3% in 2019.
    • Global electric car registrations increased by 41% in 2020, with China and Europe as major markets.
    • The manufacturing segment generated the most income in the viscosity index improvers market.
    • The Asia-Pacific region is projected to grow at the fastest CAGR from 2023 to 2032.

    Market Size & Forecast

    2024 Market Size USD 0.17 Billion
    2035 Market Size USD 0.35 Billion
    CAGR (2025-2035) 6.80%
    Largest Regional Market Share in 2022 North America.

    Major Players

    Key players include Evonik Industries, Lubrizol Corporation, Chevron Oronite Company LLC, Afton Chemical Corporation, and Infineum International Limited.

    Market Trends

    Growing advancements in the automotive sector to boost the market growth

    As a result of increasing environmental concerns and technological advancements, consumers have shifted their demand from gasoline-powered vehicles to electric hybrid vehicles. In numerous nations, e-vehicle manufacturing facilities are being constructed. According to the European Automobile Manufacturing Association, electric vehicle manufacturing in the EU grew to 11% in 2020 from 3% in 2019. As reported by the International Energy Agency, the number of global electric car registrations increased by 41% in 2020, with China and Europe being the largest markets for electric vehicles. Such advancements are anticipated to boost the market CAGR during the forecast period.

    Recent years have witnessed a previously unnoticed rise in lubricant demand due to rapid industrialization and urbanization. Lubricants are essential to the operation of apparatus, equipment, and engines. They reduce friction between any two moving elements to reduce power or energy loss and improve overall operational efficiency. They also prevent equipment wear and strain due to friction, reducing maintenance costs. Almost every component in an automobile, from the engine to the transmission to the differential gearbox, requires lubricants for efficient operation. These characteristics have caused a significant increase in lubricant demand.

    Increasing demand for automobiles worldwide, particularly in developing economies, propels these nations' sales. Rising disposable income, improved living standards, and simple access to financing have significantly increased the demand for automobiles in developing nations. Lubricants are essential for the correct operation of automobiles; consequently, the market for automotive viscosity index improvers is growing in tandem with the sales of automobiles. Thus, such factors are driving the Viscosity Index Improvers market revenue. January 2024: EVONIK is going to release a new phosphate methacrylate with an enhanced performance called VISIOMER® HEMA-P 100.

    The ongoing advancements in lubricant formulations are likely to drive the demand for viscosity index improvers, as industries increasingly prioritize energy efficiency and performance optimization.

    U.S. Department of Energy

    Viscosity Index Improvers Market Market Drivers

    Market Growth Projections

    The Global Viscosity Index Improvers Market Industry is poised for substantial growth, with projections indicating a market size of 0.17 USD Billion in 2024 and an anticipated increase to 0.35 USD Billion by 2035. This growth trajectory suggests a compound annual growth rate of 6.85% from 2025 to 2035, reflecting the increasing demand for high-performance lubricants across various sectors. Factors such as technological advancements, regulatory compliance, and the expansion of the automotive sector contribute to this positive outlook. The market's evolution is indicative of broader trends in sustainability and performance optimization, positioning viscosity index improvers as essential components in modern lubricant formulations.

    Expansion of Automotive Sector

    The expansion of the automotive sector plays a crucial role in shaping the Global Viscosity Index Improvers Market Industry. As the automotive industry continues to evolve, there is a growing emphasis on fuel efficiency and performance. Viscosity index improvers are vital in formulating engine oils that meet the demands of modern vehicles, particularly those with advanced engine technologies. This sector's growth is expected to propel the market, with estimates suggesting a rise to 0.35 USD Billion by 2035. The increasing production of vehicles globally, coupled with the demand for high-quality lubricants, positions viscosity index improvers as a key component in automotive applications.

    Rising Awareness of Lubricant Performance

    Rising awareness of lubricant performance among consumers and industries significantly impacts the Global Viscosity Index Improvers Market Industry. As end-users become more informed about the benefits of high-quality lubricants, the demand for products containing viscosity index improvers is likely to increase. This awareness is driven by the need for improved equipment longevity, reduced maintenance costs, and enhanced operational efficiency. Consequently, manufacturers are responding by developing advanced formulations that incorporate these additives. The market's growth trajectory is expected to reflect this trend, with a compound annual growth rate of 6.85% anticipated from 2025 to 2035, highlighting the importance of consumer education in driving industry expansion.

    Growing Demand for High-Performance Lubricants

    The Global Viscosity Index Improvers Market Industry experiences a notable surge in demand for high-performance lubricants across various sectors, including automotive and industrial applications. This demand is driven by the need for enhanced engine efficiency and reduced emissions. As consumers and manufacturers alike prioritize sustainability, the incorporation of viscosity index improvers becomes essential. In 2024, the market is projected to reach 0.17 USD Billion, reflecting a growing recognition of the role these additives play in optimizing lubricant performance. This trend is expected to continue, with the market potentially expanding to 0.35 USD Billion by 2035, indicating a robust growth trajectory.

    Regulatory Compliance and Environmental Standards

    The Global Viscosity Index Improvers Market Industry is significantly influenced by stringent regulatory compliance and environmental standards. Governments worldwide are implementing regulations aimed at reducing emissions and promoting the use of eco-friendly lubricants. This regulatory landscape compels manufacturers to adopt viscosity index improvers that meet these standards, thereby enhancing the performance and sustainability of their products. As a result, the market is expected to witness a steady increase in demand, with projections indicating a market size of 0.17 USD Billion in 2024. This trend underscores the importance of compliance in driving innovation and growth within the industry.

    Technological Advancements in Additive Formulation

    Technological advancements in the formulation of viscosity index improvers significantly influence the Global Viscosity Index Improvers Market Industry. Innovations in polymer chemistry and additive manufacturing enable the development of more effective and environmentally friendly products. These advancements not only enhance the performance of lubricants but also align with regulatory requirements for reduced environmental impact. As a result, manufacturers are increasingly investing in research and development to create superior viscosity index improvers. This focus on innovation is likely to contribute to a compound annual growth rate of 6.85% from 2025 to 2035, further solidifying the industry's position in the global market.

    Market Segment Insights

    Viscosity Index Improvers Type Insights

    Based on type, the Viscosity Index Improvers Market segmentation includes polymethacrylate, olefin copolymer, and polyisobutylene. The olefin copolymer segment dominated the market in 2022. Due to industrial and automotive applications, viscosity Index Improvers based on Olefin Copolymers are in higher demand on the international market. Over the forecast period, the global market for Olefin Copolymer-based Viscosity Index Improvers is anticipated to expand due to increased demand for lubricants from end-user industries such as the automotive and construction sectors. The Olefin Copolymer-based Viscosity Index Improvers market will be driven by technological progress and product innovation.

    Figure 1: Viscosity Index Improvers Market, by Type, 2022 & 2032 (USD billion)

    Source: Secondary Research, Primary Research, Market Research Future Database and Analyst Review

    Viscosity Index Improvers End-User Insights

    Based on End-User, the Viscosity Index Improvers Market segmentation includes manufacturing, food processing, mining, construction, and power generation. The manufacturing category generated the most income. During operation, the engine temperature of an automobile fluctuates dramatically. Automobile lubricants control engine friction and wear, shield the engine from rust, cool the pistons, and shield the engine oil in the sump from combustion vapors.

    When engine oil/lubricant included in an automobile engine is exposed to extreme temperature swings, typically between 40 and 100°C, it begins to thin, leading to engine oil/lubricant evaporation, resulting in engine damage or knocking out due to high friction between internal engine parts.x

    In March 2023, ABB completed the Marunda 2.0 oil blending plant extension project, which doubled output despite tripling it within three years during pandemic challenges.

    Get more detailed insights about Viscosity Index Improvers Market Research Report—Global Forecast till 2034

    Regional Insights

    By region, the study provides market insights into North America, Europe, Asia-Pacific, and Rest of the World. The North American Viscosity Index improvers market area will dominate this market in 2022. The automotive industry has consistently expanded. Increased sales of commercial vehicles, specifically light trucks and pick-up trucks used for short-distance trade and logistics, are anticipated to increase the demand for automotive lubricants in the country. Future growth in the automotive industry will increase the demand for viscosity index improvers over the forecast period.

    Further, the major countries studied in the market report are The U.S., Canada, German, France, the UK, Italy, Spain, China, Japan, India, Australia, South Korea, and Brazil.

    Figure 2: VISCOSITY INDEX IMPROVERS MARKET SHARE BY REGION 2022 (%)

    VISCOSITY INDEX IMPROVERS MARKET SHARE BY REGION 2022 (%)

    Source: Secondary Research, Primary Research, Market Research Future Database and Analyst Review

    Europe Viscosity Index Improvers market accounted for the second-largest market share in 2022.  REACH (Registration, Evaluation, Authorization, and Restriction of Chemicals) closely monitors and provides guidelines to maintain high environmental and human health protection against chemical hazards in the European lubricating oil market. Due to the introduction of stringent environmental regulations in the EU and the European market's rising demand for lubricants, the market will likely perform moderately in the coming years. Moreover, the German Viscosity Index Improvers market held the largest market share, and the UK Viscosity Index Improvers market was the fastest-growing market in the European region

    The Asia-Pacific Viscosity Index Improvers Market is projected to grow at the fastest CAGR from 2023 to 2032. The Asia-Pacific region is a lucrative market for the lubricating industry due to the rapid economic development in emerging nations and the increase in disposable income. The region's high consumption of lubricating oil is primarily attributable to the expansion of industrial production and commerce and the rise in the number of automobiles. Increasing investments in India's industrial sector also contribute to the region's growing demand for lubricating oil.

    In addition, government regulations and policies promoting environmental sustainability are impacting the market for lubricating oil additives, which is likely to increase demand over the forecast period. Moreover, China’s Viscosity Index Improvers market held the largest market share, and the Indian Viscosity Index Improvers market was the fastest-growing market in the Asia-Pacific region.

    Key Players and Competitive Insights

    Leading market players have shifted their focus to emerging regions to meet the rising demand for viscosity index improvers. Market players are also adopting various strategic activities to expand their global footprint, with key market developments including introducing new products, conducting research and development, and merging and acquiring.

    Players in the global Viscosity Index Improvers industry manufacture locally to cut transportation costs. Major players in the Viscosity Index Improvers market include Evonik Industries, Lubrizol Corporation, Chevron Oronite Company LLC, Afton Chemical Corporation, Infineum International Limite, Sanyo Chemical Industries, Ltd., Nanjing Runyou Chemical industry Additive Co., Ltd., Shenyang Great Wall Lubricating Oil Manufacturing Co., Ltd., Jilin Xingyun Chemical, Shanghai High-Lube Additives, Bariyan Oil & Lubricants Pvt. Ltd., BPT Chemicals Co, Ltd, Brad-Chem Ltd, Chetas Biochem, Croda Lubricants, and Innov Oil.

    The Oil Additives Team at Evonik offers an extensive selection of viscosity index improvers for affordable blending of high-performance driveline lubricants with superior thickening effectiveness. VISCOPLEX® solutions enable optimal energy efficiency, reduced torque loss, lower operating temperatures, and long-lasting component life. Functionalized variants permit the extension of fluid service life.

    Companies such as Afton provide a variety of polymer-based viscosity index improvers that are effective in various mineral oil lubricant applications. Afton offers a variety of liquid and solid Olefin Copolymer (OCP) viscosity index improvers. These OCP VIIs are oil-soluble and compatible with a variety of lubricant formulations. Additionally, the company provides numerous Polymethacrylate (PMA)-based viscosity index improvers (VII) that can be utilized in various industrial and automotive lubricant formulations. Afton's HiTEC Viscosity Index Improvers can be utilized in various non-lubricant applications.

    Evonik Oil Additives CIS partnered with ADCO to improve energy efficiency and productivity in construction, agricultural, mining and manufacturing equipment lubricants throughout Russia and neighboring countries.

    Lubrizol Advanced Materials Inc., inventor and world's largest CPVC compound manufacturer and Prince Pipes and Fittings Ltd. signed a FlowGuard® CPVC Processor agreement to manufacture and sell Prince FlowGuard® Plus CPVC (Chlorinated polyvinyl chloride) pipes & fittings in India; starting September Prince Pipes & Fittings will sell FlowGuard Plus products across India.

    Key Companies in the Viscosity Index Improvers Market market include

    Industry Developments

    November 2022 Evonik's Oil Additives business division restructured its product distribution in Greece, naming Brenntag Bulgaria EOOD as its new distribution partner.

    August 2022 Evonik's Oil Additives division restructured its products' distribution structure in CIS countries, announcing ADCO as its new distribution partner. The lubricant additives company develops formulation solutions and base oil technologies that increase energy productivity and effectiveness of industrial lubricants for construction, agricultural, mining, and manufacturing equipment.

    In February 2024, Chevron achieved record-breaking oil-equivalent production of 3.1 million barrels per day — up 14% in the United States. In July 2023, Chevron Phillips Chemical announced that it would expand its VII production capacity to meet the growing demand for VIIs in automotive and industrial applications.

    Future Outlook

    Viscosity Index Improvers Market Future Outlook

    The Global Viscosity Index Improvers Market is projected to grow at a 6.80% CAGR from 2025 to 2035, driven by increasing demand for high-performance lubricants and stringent environmental regulations.

    New opportunities lie in:

    • Develop bio-based viscosity index improvers to cater to eco-conscious consumers.
    • Invest in R&D for advanced polymer technologies to enhance product performance.
    • Expand distribution networks in emerging markets to capture new customer segments.

    By 2035, the market is expected to achieve substantial growth, reflecting evolving industry demands and technological advancements.

    Market Segmentation

    Viscosity Index Improvers Type Outlook

    • Polymethacrylate
    • Olefin Copolymer
    • Polyisobutylene

    Viscosity Index Improvers End-User Outlook

    • Manufacturing
    • Food processing
    • Mining
    • Construction
    • Power generation

    Viscosity Index Improvers Regional Outlook

    North America
    • US
    • Canada

    Report Scope

    Report Attribute/Metric Details
    Market Size 2024 USD 0.17 billion
    Market Size 2025 USD 0.18 billion
    Market Size 2035 0.35 (Value (USD Billion))
    Compound Annual Growth Rate (CAGR) 6.80% (2025 - 2035)
    Base Year 2024
    Market Forecast Period 2025 - 2035
    Historical Data 2020- 2024
    Market Forecast Units Value (USD Billion)
    Report Coverage Revenue Forecast, Market Competitive Landscape, Growth Factors, and Trends
    Segments Covered Type, End-User, and Region
    Geographies Covered North America, Europe, Asia Pacific, and the Rest of the World
    Countries Covered The U.S., Canada, German, France, UK, Italy, Spain, China, Japan, India, Australia, South Korea, and Brazil
    Key Companies Profiled  Evonik Industries, Lubrizol Corporation, Chevron Oronite Company LLC, Afton Chemical Corporation, Infineum International Limite, Sanyo Chemical Industries, Ltd., Nanjing Runyou Chemical industry Additive Co., Ltd., Shenyang Great Wall Lubricating Oil Manufacturing Co., Ltd., Jilin Xingyun Chemical, Shanghai High-Lube Additives, Bariyan Oil & Lubricants Pvt. Ltd., BPT Chemicals Co, Ltd, Brad-Chem Ltd, Chetas Biochem, Croda Lubricants, and Innov Oil
    Key Market Opportunities Growing Petroleum cost
    Key Market Dynamics Increase demand in the automotive sector Growing demand for E-vehicles Technological Advancements

    Market Highlights

    Author

    Anshula Mandaokar
    Team Lead - Research

    She holds an experience of about 6+ years in market research and business consulting, working under the spectrum of information communication technology, telecommunications and semiconductor domains. aarti conceptualizes and implements a scalable business strategy and provides strategic leadership to the clients. her expertise lies in market estimation, competitive intelligence, pipeline analysis, customer assessment, etc.

    Leave a Comment

    Latest Comments

    John Doe
    john@example.com

    This is a great article! Really helped me understand the topic better.

    Posted on July 23, 2025, 10:15 AM
    Jane Smith
    jane@domain.com

    Thanks for sharing this. I’ve bookmarked it for later reference.

    Posted on July 22, 2025, 7:45 PM

    FAQs

    How much is the Viscosity Index Improvers market?

    The Viscosity Index Improvers Market size was valued at USD 0.17 Billion in 2024.

    What is the growth rate of the Viscosity Index Improvers market?

    Viscosity Index Improvers Market is projected to register a CAGR of 6.8% from 2025-2035

    Which region held the largest market share in the Viscosity Index Improvers market?

    North America had the largest share in the global market

    Who are the key players in the Viscosity Index Improvers market?

    The key players in the market are Evonik Industries, Lubrizol Corporation, Chevron Oronite Company LLC, Afton Chemical Corporation, Infineum International Limite, Sanyo Chemical Industries, Ltd., Nanjing Runyou Chemical Industry Additive Co., Ltd., Shenyang Great Wall Lubricating Oil Manufacturing Co., Ltd., Jilin Xingyun Chemical, Shanghai High-Lube Additives, Bariyan Oil & Lubricants Pvt. Ltd., BPT Chemicals Co, Ltd, Brad-Chem Ltd, Chetas Biochem, Croda Lubricants, and Innov Oil.

    Which type led the Viscosity Index Improvers market?

    The Olefin Copolymer category dominated the market in 2022.

    Which End-User had the largest market share in the Viscosity Index Improvers market?

    Manufacturing had the largest share in the global market.

    1. . EXECUTIVE SUMMARY
    2. . MARKET INTRODUCTION
    3. . Definition
    4. . Scope of the Study
    5. . Research Objective
    6. . Assumptions
    7. . Limitations
    8. . RESEARCH METHODOLOGY
    9. . Overview
    10. . Data Mining
    11. . Secondary Research
    12. . Primary Research
    13. . Primary Interviews and Information Gathering Process
    14. . Breakdown of Primary Respondents
    15. . Forecasting Model
    16. . Market Size Estimation
    17. . Bottom-Up Approach
    18. . Top-Down Approach
    19. . Data Triangulation
    20. . Validation
    21. . MARKET DYNAMICS
    22. . Overview
    23. . Drivers
    24. . Restraints
    25. . Opportunities
    26. . MARKET FACTOR ANALYSIS
    27. . Value Chain Analysis
    28. . Porter’s Five Forces Analysis
    29. . Bargaining Power of Suppliers
    30. . Bargaining Power of Buyers
    31. . Threat of New Entrants
    32. . Threat of Substitutes
    33. . Intensity of Rivalry
    34. . COVID-19 Impact Analysis
    35. . Market Impact Analysis
    36. . Regional Impact
    37. . Opportunity and Threat Analysis
    38. . GLOBAL VISCOSITY INDEX IMPROVERS MARKET, BY TYPE
    39. . Overview
    40. . Polymethacrylate
    41. . Olefin Copolymer
    42. . Polyisobutylene
    43. . GLOBAL VISCOSITY INDEX IMPROVERS MARKET, BY END-USER
    44. . Overview
    45. . Manufacturing
    46. . Food processing
    47. . Mining
    48. . Construction
    49. . Power generation
    50. . GLOBAL VISCOSITY INDEX IMPROVERS MARKET, BY REGION
    51. . Overview
    52. . North America
    53. . US
    54. . Canada
    55. . Europe
    56. . Germany
    57. . France
    58. . UK
    59. . Italy
    60. . Spain
    61. . Rest of Europe
    62. . Asia-Pacific
    63. . China
    64. . India
    65. . Japan
    66. . South Korea
    67. . Australia
    68. . Rest of Asia-Pacific
    69. . Rest of the World
    70. . Middle East
    71. . Africa
    72. . Latin America
    73. . COMPETITIVE LANDSCAPE
    74. . Overview
    75. . Competitive Analysis
    76. . Market Share Analysis
    77. . Major Growth Strategy in the Global Viscosity Index Improvers Market,
    78. . Competitive Benchmarking
    79. . Leading Players in Terms of Number of Developments in the Global Viscosity Index Improvers Market,
    80. . Key developments and Growth Strategies
    81. . New Product Launch/Service Deployment
    82. . Merger & Acquisitions
    83. . Joint Ventures
    84. . Major Players Financial Matrix
    85. . Sales & Operating Income, 2022
    86. . Major Players R&D Expenditure. 2022
    87. . COMPANY PROFILES
    88. . Evonik Industries.
    89. . Company Overview
    90. . Financial Overview
    91. . Products Offered
    92. . Key Developments
    93. . SWOT Analysis
    94. . Key Strategies
    95. . Lubrizol Corporation
    96. . Company Overview
    97. . Financial Overview
    98. . Products Offered
    99. . Key Developments
    100. . SWOT Analysis
    101. . Key Strategies
    102. . Chevron Oronite Company LLC
    103. . Company Overview
    104. . Financial Overview
    105. . Products Offered
    106. . Key Developments
    107. . SWOT Analysis
    108. . Key Strategies
    109. . Afton Chemical Corporation
    110. . Company Overview
    111. . Financial Overview
    112. . Products Offered
    113. . Key Developments
    114. . SWOT Analysis
    115. . Key Strategies
    116. . Infineum International Limite
    117. . Company Overview
    118. . Financial Overview
    119. . Products Offered
    120. . Key Developments
    121. . SWOT Analysis
    122. . Key Strategies
    123. . Sanyo Chemical Industries, Ltd.
    124. . Company Overview
    125. . Financial Overview
    126. . Products Offered
    127. . Key Developments
    128. . SWOT Analysis
    129. . Key Strategies
    130. . Nanjing Runyou Chemical industry Additive Co., Ltd.
    131. . Company Overview
    132. . Financial Overview
    133. . Products Offered
    134. . Key Developments
    135. . SWOT Analysis
    136. . Key Strategies
    137. . SHENYANG GREAT WALL LUBRICATING OIL MANUFACTURING CO., LTD.
    138. . Company Overview
    139. . Financial Overview
    140. . Products Offered
    141. . Key Developments
    142. . SWOT Analysis
    143. . Key Strategies
    144. . Jilin Xingyun Chemical
    145. . Company Overview
    146. . Financial Overview
    147. . Products Offered
    148. . Key Developments
    149. . SWOT Analysis
    150. . Key Strategies
    151. . Shanghai High-Lube Additives.
    152. . Company Overview
    153. . Financial Overview
    154. . Products Offered
    155. . Key Developments
    156. . SWOT Analysis
    157. . Key Strategies
    158. . Bariyan Oil & Lubricants Pvt. Ltd.
    159. . Company Overview
    160. . Financial Overview
    161. . Products Offered
    162. . Key Developments
    163. . SWOT Analysis
    164. . Key Strategies
    165. . BPT Chemicals Co, Ltd.
    166. . Company Overview
    167. . Financial Overview
    168. . Products Offered
    169. . Key Developments
    170. . SWOT Analysis
    171. . Key Strategies
    172. . Brad-Chem Ltd
    173. . Company Overview
    174. . Financial Overview
    175. . Products Offered
    176. . Key Developments
    177. . SWOT Analysis
    178. . Key Strategies
    179. . Chetas Biochem
    180. . Company Overview
    181. . Financial Overview
    182. . Products Offered
    183. . Key Developments
    184. . SWOT Analysis
    185. . Key Strategies
    186. . Croda Lubricants.
    187. . Company Overview
    188. . Financial Overview
    189. . Products Offered
    190. . Key Developments
    191. . SWOT Analysis
    192. . Key Strategies
    193. . Innov Oil.
    194. . Company Overview
    195. . Financial Overview
    196. . Products Offered
    197. . Key Developments
    198. . SWOT Analysis
    199. . Key Strategies
    200. . APPENDIX
    201. . References
    202. . Related Reports   LIST OF TABLES TABLE 1 GLOBAL VISCOSITY INDEX IMPROVERS MARKET, SYNOPSIS, 2025 - 2034 TABLE 2 GLOBAL VISCOSITY INDEX IMPROVERS MARKET, ESTIMATES & FORECAST, 2025 - 2034 (USD BILLION) TABLE 3 GLOBAL VISCOSITY INDEX IMPROVERS MARKET, BY TYPE, 2025 - 2034 (USD BILLION) TABLE 4 GLOBAL VISCOSITY INDEX IMPROVERS MARKET, BY END-USER, 2025 - 2034 (USD BILLION) TABLE 5 NORTH AMERICA: VISCOSITY INDEX IMPROVERS MARKET, BY TYPE, 2025 - 2034 (USD BILLION) TABLE 6 NORTH AMERICA: VISCOSITY INDEX IMPROVERS MARKET, BY END-USER, 2025 - 2034 (USD BILLION) TABLE 7 US: VISCOSITY INDEX IMPROVERS MARKET, BY TYPE, 2025 - 2034 (USD BILLION) TABLE 8 US: VISCOSITY INDEX IMPROVERS MARKET, BY END-USER, 2025 - 2034 (USD BILLION) TABLE 9 CANADA: VISCOSITY INDEX IMPROVERS MARKET, BY TYPE, 2025 - 2034 (USD BILLION) TABLE 10 CANADA: VISCOSITY INDEX IMPROVERS MARKET, BY END-USER, 2025 - 2034 (USD BILLION) TABLE 1 EUROPE: VISCOSITY INDEX IMPROVERS MARKET, BY TYPE, 2025 - 2034 (USD BILLION) TABLE 2 EUROPE: VISCOSITY INDEX IMPROVERS MARKET, BY END-USER, 2025 - 2034 (USD BILLION) TABLE 3 GERMANY: VISCOSITY INDEX IMPROVERS MARKET, BY TYPE, 2025 - 2034 (USD BILLION) TABLE 4 GERMANY: VISCOSITY INDEX IMPROVERS MARKET, BY END-USER, 2025 - 2034 (USD BILLION) TABLE 5 FRANCE: VISCOSITY INDEX IMPROVERS MARKET, BY TYPE, 2025 - 2034 (USD BILLION) TABLE 6 FRANCE: VISCOSITY INDEX IMPROVERS MARKET, BY END-USER, 2025 - 2034 (USD BILLION) TABLE 7 ITALY: VISCOSITY INDEX IMPROVERS MARKET, BY TYPE, 2025 - 2034 (USD BILLION) TABLE 8 ITALY: VISCOSITY INDEX IMPROVERS MARKET, BY END-USER, 2025 - 2034 (USD BILLION) TABLE 9 SPAIN: VISCOSITY INDEX IMPROVERS MARKET, BY TYPE, 2025 - 2034 (USD BILLION) TABLE 10 SPAIN: VISCOSITY INDEX IMPROVERS MARKET, BY END-USER, 2025 - 2034 (USD BILLION) TABLE 11 UK: VISCOSITY INDEX IMPROVERS MARKET, BY TYPE, 2025 - 2034 (USD BILLION) TABLE 12 UK: VISCOSITY INDEX IMPROVERS MARKET, BY END-USER, 2025 - 2034 (USD BILLION) TABLE 13 REST OF EUROPE: VISCOSITY INDEX IMPROVERS MARKET, BY TYPE, 2025 - 2034 (USD BILLION) TABLE 14 REST OF EUROPE: VISCOSITY INDEX IMPROVERS MARKET, BY END-USER, 2025 - 2034 (USD BILLION) TABLE 15 ASIA-PACIFIC: VISCOSITY INDEX IMPROVERS MARKET, BY TYPE, 2025 - 2034 (USD BILLION) TABLE 16 ASIA-PACIFIC: VISCOSITY INDEX IMPROVERS MARKET, BY END-USER, 2025 - 2034 (USD BILLION) TABLE 17 JAPAN: VISCOSITY INDEX IMPROVERS MARKET, BY TYPE, 2025 - 2034 (USD BILLION) TABLE 18 JAPAN: VISCOSITY INDEX IMPROVERS MARKET, BY END-USER, 2025 - 2034 (USD BILLION) TABLE 19 CHINA: VISCOSITY INDEX IMPROVERS MARKET, BY TYPE, 2025 - 2034 (USD BILLION) TABLE 20 CHINA: VISCOSITY INDEX IMPROVERS MARKET, BY END-USER, 2025 - 2034 (USD BILLION) TABLE 21 INDIA: VISCOSITY INDEX IMPROVERS MARKET, BY TYPE, 2025 - 2034 (USD BILLION) TABLE 22 INDIA: VISCOSITY INDEX IMPROVERS MARKET, BY END-USER, 2025 - 2034 (USD BILLION) TABLE 23 AUSTRALIA: VISCOSITY INDEX IMPROVERS MARKET, BY TYPE, 2025 - 2034 (USD BILLION) TABLE 24 AUSTRALIA: VISCOSITY INDEX IMPROVERS MARKET, BY END-USER, 2025 - 2034 (USD BILLION) TABLE 25 SOUTH KOREA: VISCOSITY INDEX IMPROVERS MARKET, BY TYPE, 2025 - 2034 (USD BILLION) TABLE 26 SOUTH KOREA: VISCOSITY INDEX IMPROVERS MARKET, BY END-USER, 2025 - 2034 (USD BILLION) TABLE 27 REST OF ASIA-PACIFIC: VISCOSITY INDEX IMPROVERS MARKET, BY TYPE, 2025 - 2034 (USD BILLION) TABLE 28 REST OF ASIA-PACIFIC: VISCOSITY INDEX IMPROVERS MARKET, BY END-USER, 2025 - 2034 (USD BILLION) TABLE 29 REST OF THE WORLD: VISCOSITY INDEX IMPROVERS MARKET, BY TYPE, 2025 - 2034 (USD BILLION) TABLE 30 REST OF THE WORLD: VISCOSITY INDEX IMPROVERS MARKET, BY END-USER, 2025 - 2034 (USD BILLION) TABLE 31 MIDDLE EAST: VISCOSITY INDEX IMPROVERS MARKET, BY TYPE, 2025 - 2034 (USD BILLION) TABLE 32 MIDDLE EAST: VISCOSITY INDEX IMPROVERS MARKET, BY END-USER, 2025 - 2034 (USD BILLION) TABLE 33 AFRICA: VISCOSITY INDEX IMPROVERS MARKET, BY TYPE, 2025 - 2034 (USD BILLION) TABLE 34 AFRICA: VISCOSITY INDEX IMPROVERS MARKET, BY END-USER, 2025 - 2034 (USD BILLION) TABLE 35 LATIN AMERICA: VISCOSITY INDEX IMPROVERS MARKET, BY TYPE, 2025 - 2034 (USD BILLION) TABLE 36 LATIN AMERICA: VISCOSITY INDEX IMPROVERS MARKET, BY END-USER, 2025 - 2034 (USD BILLION) LIST OF FIGURES FIGURE 1 RESEARCH PROCESS FIGURE 2 MARKET STRUCTURE FOR THE GLOBAL VISCOSITY INDEX IMPROVERS MARKET FIGURE 3 MARKET DYNAMICS FOR THE GLOBAL VISCOSITY INDEX IMPROVERS MARKET FIGURE 4 GLOBAL VISCOSITY INDEX IMPROVERS MARKET, SHARE (%), BY TYPE, 2022 FIGURE 5 GLOBAL VISCOSITY INDEX IMPROVERS MARKET, SHARE (%), BY END-USER, 2022 FIGURE 6 GLOBAL VISCOSITY INDEX IMPROVERS MARKET, SHARE (%), BY REGION, 2022 FIGURE 7 NORTH AMERICA: VISCOSITY INDEX IMPROVERS MARKET, SHARE (%), BY REGION, 2022 FIGURE 8 EUROPE: VISCOSITY INDEX IMPROVERS MARKET, SHARE (%), BY REGION, 2022 FIGURE 9 ASIA-PACIFIC: VISCOSITY INDEX IMPROVERS MARKET, SHARE (%), BY REGION, 2022 FIGURE 10 REST OF THE WORLD: VISCOSITY INDEX IMPROVERS MARKET, SHARE (%), BY REGION, 2022 FIGURE 11 GLOBAL VISCOSITY INDEX IMPROVERS MARKET: COMPANY SHARE ANALYSIS, 2022 (%) FIGURE 12 EVONIK INDUSTRIES.: FINANCIAL OVERVIEW SNAPSHOT FIGURE 13 EVONIK INDUSTRIES.: SWOT ANALYSIS FIGURE 14 LUBRIZOL CORPORATION: FINANCIAL OVERVIEW SNAPSHOT FIGURE 15 LUBRIZOL CORPORATION: SWOT ANALYSIS FIGURE 16 CHEVRON ORONITE COMPANY LLC: FINANCIAL OVERVIEW SNAPSHOT FIGURE 17 CHEVRON ORONITE COMPANY LLC: SWOT ANALYSIS FIGURE 18 AFTON CHEMICAL CORPORATION: FINANCIAL OVERVIEW SNAPSHOT FIGURE 19 AFTON CHEMICAL CORPORATION: SWOT ANALYSIS FIGURE 20 INFINEUM INTERNATIONAL LIMITE.: FINANCIAL OVERVIEW SNAPSHOT FIGURE 21 INFINEUM INTERNATIONAL LIMITE.: SWOT ANALYSIS FIGURE 22 SANYO CHEMICAL INDUSTRIES, LTD.: FINANCIAL OVERVIEW SNAPSHOT FIGURE 23 SANYO CHEMICAL INDUSTRIES, LTD.: SWOT ANALYSIS FIGURE 24 NANJING RUNYOU CHEMICAL INDUSTRY ADDITIVE CO., LTD.: FINANCIAL OVERVIEW SNAPSHOT FIGURE 25 NANJING RUNYOU CHEMICAL INDUSTRY ADDITIVE CO., LTD.: SWOT ANALYSIS FIGURE 26 SHENYANG GREAT WALL LUBRICATING OIL MANUFACTURING CO., LTD.: FINANCIAL OVERVIEW SNAPSHOT FIGURE 27 SHENYANG GREAT WALL LUBRICATING OIL MANUFACTURING CO., LTD.: SWOT ANALYSIS FIGURE 28 JILIN XINGYUN CHEMICAL.: FINANCIAL OVERVIEW SNAPSHOT FIGURE 29 JILIN XINGYUN CHEMICAL.: SWOT ANALYSIS FIGURE 30 SHANGHAI HIGH-LUBE ADDITIVES: FINANCIAL OVERVIEW SNAPSHOT FIGURE 31 SHANGHAI HIGH-LUBE ADDITIVES: SWOT ANALYSIS FIGURE 32 BARIYAN OIL & LUBRICANTS PVT. LTD.: FINANCIAL OVERVIEW SNAPSHOT FIGURE 33 BARIYAN OIL & LUBRICANTS PVT. LTD.: SWOT ANALYSIS FIGURE 34 BPT CHEMICALS CO, LTD: FINANCIAL OVERVIEW SNAPSHOT FIGURE 35 BPT CHEMICALS CO, LTD: SWOT ANALYSIS FIGURE 36 BRAD-CHEM LTD.: FINANCIAL OVERVIEW SNAPSHOT FIGURE 37 BRAD-CHEM LTD.: SWOT ANALYSIS FIGURE 38 CHETAS BIOCHEM.: FINANCIAL OVERVIEW SNAPSHOT FIGURE 39 CHETAS BIOCHEM.: SWOT ANALYSIS FIGURE 40 CRODA LUBRICANTS.: FINANCIAL OVERVIEW SNAPSHOT FIGURE 41 CRODA LUBRICANTS: SWOT ANALYSIS FIGURE 42 INNOV OIL.: FINANCIAL OVERVIEW SNAPSHOT FIGURE 43 INNOV OIL.: SWOT ANALYSIS
    203. List of Tables and Figures
      1. Table FIGURE 1 RESEARCH PROCESS FIGURE 2 MARKET STRUCTURE FOR THE GLOBAL VISCOSITY INDEX IMPROVERS MARKET FIGURE 3 MARKET DYNAMICS FOR THE GLOBAL VISCOSITY INDEX IMPROVERS MARKET FIGURE 4 GLOBAL VISCOSITY INDEX IMPROVERS MARKET, SHARE (%), BY TYPE, 2022 FIGURE 5 GLOBAL VISCOSITY INDEX IMPROVERS MARKET, SHARE (%), BY END-USER, 2022 FIGURE 6 GLOBAL VISCOSITY INDEX IMPROVERS MARKET, SHARE (%), BY REGION, 2022 FIGURE 7 NORTH AMERICA: VISCOSITY INDEX IMPROVERS MARKET, SHARE (%), BY REGION, 2022 FIGURE 8 EUROPE: VISCOSITY INDEX IMPROVERS MARKET, SHARE (%), BY REGION, 2022 FIGURE 9 ASIA-PACIFIC: VISCOSITY INDEX IMPROVERS MARKET, SHARE (%), BY REGION, 2022 FIGURE 10 REST OF THE WORLD: VISCOSITY INDEX IMPROVERS MARKET, SHARE (%), BY REGION, 2022 FIGURE 11 GLOBAL VISCOSITY INDEX IMPROVERS MARKET: COMPANY SHARE ANALYSIS, 2022 (%) FIGURE 12 EVONIK INDUSTRIES.: FINANCIAL OVERVIEW SNAPSHOT FIGURE 13 EVONIK INDUSTRIES.: SWOT ANALYSIS FIGURE 14 LUBRIZOL CORPORATION: FINANCIAL OVERVIEW SNAPSHOT FIGURE 15 LUBRIZOL CORPORATION: SWOT ANALYSIS FIGURE 16 CHEVRON ORONITE COMPANY LLC: FINANCIAL OVERVIEW SNAPSHOT FIGURE 17 CHEVRON ORONITE COMPANY LLC: SWOT ANALYSIS FIGURE 18 AFTON CHEMICAL CORPORATION: FINANCIAL OVERVIEW SNAPSHOT FIGURE 19 AFTON CHEMICAL CORPORATION: SWOT ANALYSIS FIGURE 20 INFINEUM INTERNATIONAL LIMITE.: FINANCIAL OVERVIEW SNAPSHOT FIGURE 21 INFINEUM INTERNATIONAL LIMITE.: SWOT ANALYSIS FIGURE 22 SANYO CHEMICAL INDUSTRIES, LTD.: FINANCIAL OVERVIEW SNAPSHOT FIGURE 23 SANYO CHEMICAL INDUSTRIES, LTD.: SWOT ANALYSIS FIGURE 24 NANJING RUNYOU CHEMICAL INDUSTRY ADDITIVE CO., LTD.: FINANCIAL OVERVIEW SNAPSHOT FIGURE 25 NANJING RUNYOU CHEMICAL INDUSTRY ADDITIVE CO., LTD.: SWOT ANALYSIS FIGURE 26 SHENYANG GREAT WALL LUBRICATING OIL MANUFACTURING CO., LTD.: FINANCIAL OVERVIEW SNAPSHOT FIGURE 27 SHENYANG GREAT WALL LUBRICATING OIL MANUFACTURING CO., LTD.: SWOT ANALYSIS FIGURE 28 JILIN XINGYUN CHEMICAL.: FINANCIAL OVERVIEW SNAPSHOT FIGURE 29 JILIN XINGYUN CHEMICAL.: SWOT ANALYSIS FIGURE 30 SHANGHAI HIGH-LUBE ADDITIVES: FINANCIAL OVERVIEW SNAPSHOT FIGURE 31 SHANGHAI HIGH-LUBE ADDITIVES: SWOT ANALYSIS FIGURE 32 BARIYAN OIL & LUBRICANTS PVT. LTD.: FINANCIAL OVERVIEW SNAPSHOT FIGURE 33 BARIYAN OIL & LUBRICANTS PVT. LTD.: SWOT ANALYSIS FIGURE 34 BPT CHEMICALS CO, LTD: FINANCIAL OVERVIEW SNAPSHOT FIGURE 35 BPT CHEMICALS CO, LTD: SWOT ANALYSIS FIGURE 36 BRAD-CHEM LTD.: FINANCIAL OVERVIEW SNAPSHOT FIGURE 37 BRAD-CHEM LTD.: SWOT ANALYSIS FIGURE 38 CHETAS BIOCHEM.: FINANCIAL OVERVIEW SNAPSHOT FIGURE 39 CHETAS BIOCHEM.: SWOT ANALYSIS FIGURE 40 CRODA LUBRICANTS.: FINANCIAL OVERVIEW SNAPSHOT FIGURE 41 CRODA LUBRICANTS: SWOT ANALYSIS FIGURE 42 INNOV OIL.: FINANCIAL OVERVIEW SNAPSHOT FIGURE 43 INNOV OIL.: SWOT ANALYSIS
    204. Table FIGURE 1 RESEARCH PROCESS FIGURE 2 MARKET STRUCTURE FOR THE GLOBAL VISCOSITY INDEX IMPROVERS MARKET FIGURE 3 MARKET DYNAMICS FOR THE GLOBAL VISCOSITY INDEX IMPROVERS MARKET FIGURE 4 GLOBAL VISCOSITY INDEX IMPROVERS MARKET, SHARE (%), BY TYPE, 2022 FIGURE 5 GLOBAL VISCOSITY INDEX IMPROVERS MARKET, SHARE (%), BY END-USER, 2022 FIGURE 6 GLOBAL VISCOSITY INDEX IMPROVERS MARKET, SHARE (%), BY REGION, 2022 FIGURE 7 NORTH AMERICA: VISCOSITY INDEX IMPROVERS MARKET, SHARE (%), BY REGION, 2022 FIGURE 8 EUROPE: VISCOSITY INDEX IMPROVERS MARKET, SHARE (%), BY REGION, 2022 FIGURE 9 ASIA-PACIFIC: VISCOSITY INDEX IMPROVERS MARKET, SHARE (%), BY REGION, 2022 FIGURE 10 REST OF THE WORLD: VISCOSITY INDEX IMPROVERS MARKET, SHARE (%), BY REGION, 2022 FIGURE 11 GLOBAL VISCOSITY INDEX IMPROVERS MARKET: COMPANY SHARE ANALYSIS, 2022 (%) FIGURE 12 EVONIK INDUSTRIES.: FINANCIAL OVERVIEW SNAPSHOT FIGURE 13 EVONIK INDUSTRIES.: SWOT ANALYSIS FIGURE 14 LUBRIZOL CORPORATION: FINANCIAL OVERVIEW SNAPSHOT FIGURE 15 LUBRIZOL CORPORATION: SWOT ANALYSIS FIGURE 16 CHEVRON ORONITE COMPANY LLC: FINANCIAL OVERVIEW SNAPSHOT FIGURE 17 CHEVRON ORONITE COMPANY LLC: SWOT ANALYSIS FIGURE 18 AFTON CHEMICAL CORPORATION: FINANCIAL OVERVIEW SNAPSHOT FIGURE 19 AFTON CHEMICAL CORPORATION: SWOT ANALYSIS FIGURE 20 INFINEUM INTERNATIONAL LIMITE.: FINANCIAL OVERVIEW SNAPSHOT FIGURE 21 INFINEUM INTERNATIONAL LIMITE.: SWOT ANALYSIS FIGURE 22 SANYO CHEMICAL INDUSTRIES, LTD.: FINANCIAL OVERVIEW SNAPSHOT FIGURE 23 SANYO CHEMICAL INDUSTRIES, LTD.: SWOT ANALYSIS FIGURE 24 NANJING RUNYOU CHEMICAL INDUSTRY ADDITIVE CO., LTD.: FINANCIAL OVERVIEW SNAPSHOT FIGURE 25 NANJING RUNYOU CHEMICAL INDUSTRY ADDITIVE CO., LTD.: SWOT ANALYSIS FIGURE 26 SHENYANG GREAT WALL LUBRICATING OIL MANUFACTURING CO., LTD.: FINANCIAL OVERVIEW SNAPSHOT FIGURE 27 SHENYANG GREAT WALL LUBRICATING OIL MANUFACTURING CO., LTD.: SWOT ANALYSIS FIGURE 28 JILIN XINGYUN CHEMICAL.: FINANCIAL OVERVIEW SNAPSHOT FIGURE 29 JILIN XINGYUN CHEMICAL.: SWOT ANALYSIS FIGURE 30 SHANGHAI HIGH-LUBE ADDITIVES: FINANCIAL OVERVIEW SNAPSHOT FIGURE 31 SHANGHAI HIGH-LUBE ADDITIVES: SWOT ANALYSIS FIGURE 32 BARIYAN OIL & LUBRICANTS PVT. LTD.: FINANCIAL OVERVIEW SNAPSHOT FIGURE 33 BARIYAN OIL & LUBRICANTS PVT. LTD.: SWOT ANALYSIS FIGURE 34 BPT CHEMICALS CO, LTD: FINANCIAL OVERVIEW SNAPSHOT FIGURE 35 BPT CHEMICALS CO, LTD: SWOT ANALYSIS FIGURE 36 BRAD-CHEM LTD.: FINANCIAL OVERVIEW SNAPSHOT FIGURE 37 BRAD-CHEM LTD.: SWOT ANALYSIS FIGURE 38 CHETAS BIOCHEM.: FINANCIAL OVERVIEW SNAPSHOT FIGURE 39 CHETAS BIOCHEM.: SWOT ANALYSIS FIGURE 40 CRODA LUBRICANTS.: FINANCIAL OVERVIEW SNAPSHOT FIGURE 41 CRODA LUBRICANTS: SWOT ANALYSIS FIGURE 42 INNOV OIL.: FINANCIAL OVERVIEW SNAPSHOT FIGURE 43 INNOV OIL.: SWOT ANALYSIS


     Viscosity Index Improvers Market Segmentation

    Viscosity Index Improvers Type Outlook (USD Billion, 2018-2032)

    • Polymethacrylate
    • Olefin Copolymer
    • Polyisobutylene

    Viscosity Index Improvers End-User Outlook (USD Billion, 2018-2032)

    • Manufacturing
    • Food processing
    • Mining
    • Construction
    • Power generation

    Viscosity Index Improvers Regional Outlook (USD Billion, 2018-2032)

    • North America Outlook (USD Billion, 2018-2032)

      • North America Viscosity Index Improvers by Type
        • Polymethacrylate
        • Olefin Copolymer
        • Polyisobutylene
      • North America Viscosity Index Improvers by End-User
        • Manufacturing
        • Food processing
        • Mining
        • Construction
        • Power generation
      • US Outlook (USD Billion, 2018-2032)

      • US Viscosity Index Improvers by Type
        • Polymethacrylate
        • Olefin Copolymer
        • Polyisobutylene
      • US Viscosity Index Improvers by End-User
        • Manufacturing
        • Food processing
        • Mining
        • Construction
        • Power generation
      • CANADA Outlook (USD Billion, 2018-2032)

      • CANADA Viscosity Index Improvers by Type
        • Polymethacrylate
        • Olefin Copolymer
        • Polyisobutylene
      • CANADA Viscosity Index Improvers by End-User
        • Manufacturing
        • Food processing
        • Mining
        • Construction
        • Power generation
    • Europe Outlook (USD Billion, 2018-2032)

      • Europe Viscosity Index Improvers by Type
        • Polymethacrylate
        • Olefin Copolymer
        • Polyisobutylene
      • Europe Viscosity Index Improvers by End-User
        • Manufacturing
        • Food processing
        • Mining
        • Construction
        • Power generation
      • Germany Outlook (USD Billion, 2018-2032)

      • Germany Viscosity Index Improvers by Type
        • Polymethacrylate
        • Olefin Copolymer
        • Polyisobutylene
      • Germany Viscosity Index Improvers by End-User
        • Manufacturing
        • Food processing
        • Mining
        • Construction
        • Power generation
      • France Outlook (USD Billion, 2018-2032)

      • France Viscosity Index Improvers by Type
        • Polymethacrylate
        • Olefin Copolymer
        • Polyisobutylene
      • France Viscosity Index Improvers by End-User
        • Manufacturing
        • Food processing
        • Mining
        • Construction
        • Power generation
      • UK Outlook (USD Billion, 2018-2032)

      • UK Viscosity Index Improvers by Type
        • Polymethacrylate
        • Olefin Copolymer
        • Polyisobutylene
      • UK Viscosity Index Improvers by End-User
        • Manufacturing
        • Food processing
        • Mining
        • Construction
        • Power generation
      • ITALY Outlook (USD Billion, 2018-2032)

      • ITALY Viscosity Index Improvers by Type
        • Polymethacrylate
        • Olefin Copolymer
        • Polyisobutylene
      • ITALY Viscosity Index Improvers by End-User
        • Manufacturing
        • Food processing
        • Mining
        • Construction
        • Power generation
      • SPAIN Outlook (USD Billion, 2018-2032)

      • Spain Viscosity Index Improvers by Type
        • Polymethacrylate
        • Olefin Copolymer
        • Polyisobutylene
      • Spain Viscosity Index Improvers by End-User
        • Manufacturing
        • Food processing
        • Mining
        • Construction
        • Power generation
      • Rest Of Europe Outlook (USD Billion, 2018-2032)

      • Rest Of Europe Viscosity Index Improvers by Type
        • Polymethacrylate
        • Olefin Copolymer
        • Polyisobutylene
      • REST OF EUROPE Viscosity Index Improvers by End-User
        • Manufacturing
        • Food processing
        • Mining
        • Construction
        • Power generation
    • Asia-Pacific Outlook (USD Billion, 2018-2032)

      • Asia-Pacific Viscosity Index Improvers by Type
        • Polymethacrylate
        • Olefin Copolymer
        • Polyisobutylene
      • Asia-Pacific Viscosity Index Improvers by End-User
        • Manufacturing
        • Food processing
        • Mining
        • Construction
        • Power generation
      • China Outlook (USD Billion, 2018-2032)

      • China Viscosity Index Improvers by Type
        • Polymethacrylate
        • Olefin Copolymer
        • Polyisobutylene
      • China Viscosity Index Improvers by End-User
        • Manufacturing
        • Food processing
        • Mining
        • Construction
        • Power generation
      • Japan Outlook (USD Billion, 2018-2032)

      • Japan Viscosity Index Improvers by Type
        • Polymethacrylate
        • Olefin Copolymer
        • Polyisobutylene
      • Japan Viscosity Index Improvers by End-User
        • Manufacturing
        • Food processing
        • Mining
        • Construction
        • Power generation
      • India Outlook (USD Billion, 2018-2032)

      • India Viscosity Index Improvers by Type
        • Polymethacrylate
        • Olefin Copolymer
        • Polyisobutylene
      • India Viscosity Index Improvers by End-User
        • Manufacturing
        • Food processing
        • Mining
        • Construction
        • Power generation
      • Australia Outlook (USD Billion, 2018-2032)

      • Australia Viscosity Index Improvers by Type
        • Polymethacrylate
        • Olefin Copolymer
        • Polyisobutylene
      • Australia Viscosity Index Improvers by End-User
        • Manufacturing
        • Food processing
        • Mining
        • Construction
        • Power generation
      • Rest of Asia-Pacific Outlook (USD Billion, 2018-2032)

      • Rest of Asia-Pacific Viscosity Index Improvers by Type
        • Polymethacrylate
        • Olefin Copolymer
        • Polyisobutylene
      • Rest of Asia-Pacific Viscosity Index Improvers by End-User
        • Manufacturing
        • Food processing
        • Mining
        • Construction
        • Power generation
    • Rest of the World Outlook (USD Billion, 2018-2032)

      • Rest of the World Viscosity Index Improvers by Type
        • Polymethacrylate
        • Olefin Copolymer
        • Polyisobutylene
      • Rest of the World Viscosity Index Improvers by End-User
        • Manufacturing
        • Food processing
        • Mining
        • Construction
        • Power generation
      • Middle East Outlook (USD Billion, 2018-2032)

      • Middle East Viscosity Index Improvers by Type
        • Polymethacrylate
        • Olefin Copolymer
        • Polyisobutylene
      • Middle East Viscosity Index Improvers by End-User
        • Manufacturing
        • Food processing
        • Mining
        • Construction
        • Power generation
      • Africa Outlook (USD Billion, 2018-2032)

      • Africa Viscosity Index Improvers by Type
        • Polymethacrylate
        • Olefin Copolymer
        • Polyisobutylene
      • Africa Viscosity Index Improvers by End-User
        • Manufacturing
        • Food processing
        • Mining
        • Construction
        • Power generation
      • Latin America Outlook (USD Billion, 2018-2032)

      • Latin America Viscosity Index Improvers by Type
        • Polymethacrylate
        • Olefin Copolymer
        • Polyisobutylene
      • Latin America Viscosity Index Improvers by End-User
        • Manufacturing
        • Food processing
        • Mining
        • Construction
        • Power generation


    Infographic

    Free Sample Request

    Kindly complete the form below to receive a free sample of this Report

    Get Free Sample

    Customer Strories

    “I am very pleased with how market segments have been defined in a relevant way for my purposes (such as "Portable Freezers & refrigerators" and "last-mile"). In general the report is well structured. Thanks very much for your efforts.”

    Victoria Milne

    Founder
    Case Study
    Chemicals and Materials