• Cat-intel
  • MedIntelliX
  • Resources
  • About Us
  • Hero Background
    English
    Chinese
    French
    Japanese
    Korean
    German
    Spanish

    Virtual Kitchen Market Share

    ID: MRFR/ICT/3079-HCR
    100 Pages
    Shubham Munde
    October 2025

    Virtual Kitchen Market Research Report Information by Component Type (Hardware, Software and Service), End-user (Commercial space, Residential and Hospitality) and By Region (Asia-Pacific, North America, Europe, and Rest of the World) - Forecast till 2035

    Share:
    Download PDF ×

    We do not share your information with anyone. However, we may send you emails based on your report interest from time to time. You may contact us at any time to opt-out.

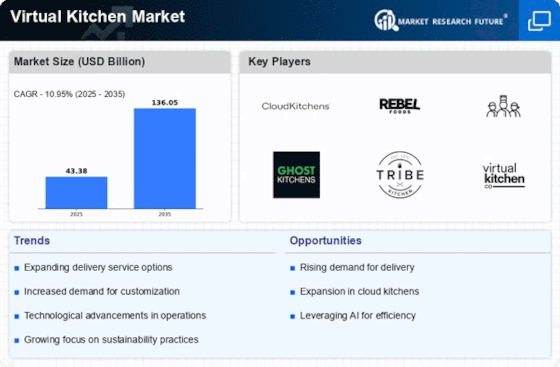
    Virtual Kitchen Market Infographic
    $ 4,950.0
    $ 5,950.0
    $ 7,250.0

    Market Share

    Virtual Kitchen Market Share Analysis

    Companies in the highly competitive Virtual Kitchen market compete based on their differentiation, each offering unique and innovative features that make them stand out from everyone else. This could include offering a variety of dishes and experiments in flavors, incorporating cutting-edge technology for the best user interface, or adopting green practices to satisfy eco-aware consumers. In addition, companies frequently pursue cost leadership strategies to capture a larger share of the market.

    This means improving efficiency in production, designing leaner supply chains and striking good deals with suppliers to reduce the total costs of making things. Setting prices competitively while maintaining quality can help companies secure a wider customer base and an important slice of the virtual kitchens pie. Partnerships and collaborations play an important role in the positioning of market share within Virtual Kitchen, too. Making use of existing customer resources: Companies can establish strategic alliances with popular food delivery platforms, and thus to widen their coverage scope.

    Furthermore, you can also collaborate with top chefs or culinary influencers to enhance your credibility and reach a wider audience. Apart from providing consumers with a fresh take on virtual kitchen offerings, such collaborations are also helpful in building consumer trust. In addition, companies actively spend on marketing and branding to secure a firm market position. Branding works Not only does this set a virtual kitchen apart, it also makes consumers more likely to remember and recognize the brand. Social media campaigns, influencer marketing and targeted advertising are essential to hit the target audience.

    Digital platforms enable virtual kitchens to interact directly with consumers, receive feedback and refine their strategies according the zeitgeist' of every market. Changing consumer preferences pose a big challenge for building up market share in the Virtual Kitchen Market. Consistent market studies keeps firms abreast of changes in tastes and dietary habits, allowing them to revise their menus. Responsiveness to consumer wants not only attracts new customers but promotes loyalty among existing ones.

    With the further development of VKMs, data analytics and technology-driven strategies assume greater importance. These companies invest in highly advanced data analysis tools to gain customer behavior, preference and ordering pattern information. The data-driven approach enables virtual kitchens to personalize the menu, optimizing offerings while improving overall customer service.

    Market Summary

    As per Market Research Future Analysis, the Virtual Kitchen Market was valued at USD 34.2 Billion in 2022 and is projected to grow to USD 80.9 Billion by 2030, with a CAGR of 10.95% from 2023 to 2030. The growth is driven by the increasing demand for food delivery services, cost-effectiveness, and flexibility of virtual kitchens. The market is segmented by component type, with hardware leading the share, while services are expected to grow at a CAGR of 24.81%. North America dominates the market with a 65.9% share in 2023, followed by Asia-Pacific, which is projected to grow at a CAGR of 18.37%.

    Key Market Trends & Highlights

    The Virtual Kitchen market is experiencing significant growth driven by evolving consumer preferences and technological advancements.

    • Market Size in 2022: USD 34.2 Billion; projected to reach USD 80.9 Billion by 2030.
    • CAGR from 2023 to 2030: 10.95%; services segment expected to grow at 24.81%.
    • North America holds 65.9% market share in 2023; Asia-Pacific projected to grow at 18.37% CAGR.
    • Food delivery market valued at USD 150 Billion in 2022; expected to reach USD 340.9 Billion by 2030.

    Market Size & Forecast

    2022 Market Size USD 34.2 Billion
    2023 Projected Market Size USD 39.1 Billion
    2030 Projected Market Size USD 80.9 Billion
    CAGR (2023-2030) 10.95%
    North America Market Share in 2023 65.9%
    Asia-Pacific CAGR (2023-2030) 18.37%

    Major Players

    Key players include Kitchen United, Rebel Foods, Keatz, Zuul Kitchens, Kitopi, CloudKitchens, Dahmakan, Swiggy Access, Foodpanda Virtual Kitchen, Taster, Cheetay, and others.

    Market Trends

    Increasing Demand Of Food Delivery Services Proliferate Demand Of Virtual Kitchen.

    The increased demand for food delivery services has created opportunities for virtual kitchens to meet the needs of both restaurants and consumers, and it is likely that the trend towards virtual kitchens will continue to grow in the coming years. As more consumers opt for food delivery, restaurants are under pressure to fulfill a higher volume of orders. Virtual kitchens can help meet this demand by operating exclusively for delivery, with no physical dining space.

    Operating a virtual kitchen can be more cost-effective than operating a traditional restaurant, as there is no need for a storefront, dining area, or front-of-house staff. This can make it easier for restaurants to expand their delivery capabilities without incurring significant expenses. Virtual kitchens can allow restaurant operators to test new concepts or menu items without the expense and risk of opening a new physical location. This can help restaurants adapt to changing consumer preferences and trends more quickly.

    By operating from a centralized kitchen, virtual kitchens can reach new delivery markets without the need for multiple physical locations. This can help restaurants expand their customer base and increase their revenue. Many food delivery platforms, such as Uber Eats and DoorDash, partner with virtual kitchens to offer a wider range of delivery options to consumers. This can help virtual kitchens reach a larger audience and increase their visibility.

    food delivery market was valued at USD 150 Billon in 2022 and is expected to reach USD 340.9 Billion by 2030, growing at a CAGR of 10% from 2023 to 2030. This growth of food delivery supports cloud kitchen concept as its cheaper option for new entrepreneurs to cater easily with low capital in food services sector.

    Virtual Kitchen Market Segment Insight

    The Global Virtual Kitchen Market appears to be evolving rapidly, driven by changing consumer preferences and the increasing demand for convenience in food delivery services.

    U.S. Department of Agriculture

    Virtual Kitchen Market Market Drivers

    Rising Demand for Delivery Services

    The Global Virtual Kitchen Market Industry experiences a notable surge in demand for food delivery services, driven by changing consumer preferences towards convenience and efficiency. As urban populations grow and lifestyles become increasingly fast-paced, more consumers opt for delivery options rather than traditional dining. This trend is reflected in the projected market size of 43.6 USD Billion in 2024, indicating a robust appetite for virtual kitchen solutions that cater to this demand. Companies are adapting by optimizing their delivery logistics and enhancing menu offerings, which further propels the growth of the Global Virtual Kitchen Market Industry.

    Market Segment Insights

    Virtual Kitchen by Component Type Insights

    Based on component type, the Virtual Kitchen market segmentation includes hardware, software, and services. The hardware segment accounted for the largest share of this market and is also anticipated to grow at a CAGR of 9.8% through the forecast period. Virtual kitchen hardware includes appliances, tools, and equipment that are used in virtual kitchen setups. This includes:

    Cooking equipment: This includes ovens, fryers, grills, and other cooking appliances used to prepare and cook food. In cloud kitchens, these appliances may be compact and designed for high-volume cooking.

    Food storage and preparation equipment: This includes refrigerators, freezers, food prep tables, and other equipment used to store and prepare food before it is cooked.

    Order fulfillment equipment: This includes packaging and labeling equipment, such as food containers, bags, and labels, used to package and prepare orders for delivery.

    Point-of-sale systems: This includes software and hardware used to process orders and manage inventory in real-time. Cloud kitchens may rely heavily on technology to manage their operations efficiently.

    Virtual Kitchen End-user Insights

    Based on end-user type, the Virtual Kitchen market is segmented into commercial space, residential and hospitality. Due to low cost and ease to reach viability in residential locations, there was a huge surge in delivery from these virtual kitchens. After Covid, with new normal there was a huge decline in dine in and on contrary a huge surge in online delivery. Due to limited food option, cloud kitchens/ virtual kitchens had shown a huge penetration among residential customers.

    Get more detailed insights about Virtual Kitchen Market Research Report - Global Forecast 2030

    Regional Insights

    By region, this market has been segmented into North America, Europe, Asia-Pacific, and the rest of the world. The North American region dominates this market with a significant share of 65.9% in 2023 and is also estimated to witness good growth with a CAGR of 9.7% during the forecast period. The virtual kitchen market in the US is growing rapidly, driven by factors such as the increasing popularity of food delivery services, rising urbanization, and changing consumer behavior.

    The virtual kitchen market in the US is becoming increasingly competitive, with a growing number of players vying for market share. Some of the major players include Kitchen United, Zuul Kitchens, and CloudKitchens. Many virtual kitchens in the US partner with food delivery platforms, such as Uber Eats, Grubhub, and DoorDash, to reach a wider audience and increase their visibility. Some virtual kitchens in the US are expanding beyond delivery to include pickup options or even physical storefronts. This can help to differentiate them from competitors and appeal to a wider range of consumers.

    The virtual kitchen market in the US presents opportunities for innovation, such as the use of robotics and automation to streamline operations and reduce costs, and the development of eco-friendly virtual kitchens.

    On the other side, the Asia-Pacific is also projected to become the second-largest region across the globe at a CAGR of 18.37% from 2023 to 2030. The Chinese government has been supportive of the virtual kitchen industry, as it can help to address food safety concerns and support the development of the country's digital economy. The virtual kitchen market in China is highly competitive, with a large number of players vying for market share.

    Some of the major players include Panda Selected, Eleme, and Meituan-Dianping. Many virtual kitchens in China partner with food delivery platforms to reach a wider audience and increase their visibility. For example, Panda Selected operates exclusively on the Eleme platform. Some virtual kitchens in China are expanding beyond delivery to include dine-in options or even physical storefronts. This can help to differentiate them from competitors and appeal to a wider range of consumers.  

    Figure 4: Virtual Kitchen Market, by Region, 2022 & 2030 (USD Billion)

    Virtual Kitchen Market, by Region, 2022 & 2030

    Source: Secondary Research, Primary Research, Market Research Future Database and Analyst Review

    The virtual kitchen market in Europe is growing, although at a slower pace than in other regions such as North America and Asia. The virtual kitchen market in Europe varies significantly by region, with the UK, Spain, and Germany among the largest markets. In the UK, for example, virtual kitchens are becoming increasingly popular due to the high cost of real estate and the increasing demand for food delivery services. In some European countries, regulations related to food safety and hygiene can be a barrier to entry for virtual kitchen operators.

    However, some governments are taking steps to address these challenges, such as the UK's Food Standards Agency's new guidelines for virtual kitchens.

    Key Players and Competitive Insights

    Major players in the Virtual Kitchen market, include, Kitchen United, Rebel Foods, Keatz, Zuul Kitchens, Kitopi, CloudKitchens, Dahmakan, Swiggy Access, Foodpanda Virtual Kitchen, Taster, Cheetay, The Local Culinary, Smart City Kitchens, Ghost Kitchen Brands, DoorDash Kitchens, Deliveroo Editions, Editions by Uber Eats, Deliverect and Deliveroo Editions.

    The market's growth is predicted to be accelerated by the rising adoption of cloud computing and Virtual Kitchen, as well as various strategic alliances and investments among regional businesses. Due primarily to the participation of many equipment suppliers, the United States controls the majority of the market in the region and generates a sizeable portion of overall income.  

    Key Companies in the Virtual Kitchen Market market include

    Industry Developments

    March 2023: - Kitchens@ Acquires Swiggy's Cloud Kitchen Arm 'Swiggy Access'. Swiggy sold its business at an undisclosed amount with all equity deal.

    February 2022 - Curefoods Pvt Ltd, a cloud kitchen startup floated by Cure.fit, which houses brands like EatFit, CakeZone, and Aligarh House, bought Accel-backed Maverix Platforms Pvt Ltd, which runs ready-to-cook food brand Fingerlix, for an undisclosed amount.

    Future Outlook

    Virtual Kitchen Market Future Outlook

    The Global Virtual Kitchen Market is poised for robust growth at a 10.89% CAGR from 2024 to 2035, driven by technological advancements and evolving consumer preferences.

    New opportunities lie in:

    • Leverage AI-driven analytics for personalized meal planning services.
    • Expand delivery partnerships to enhance market reach and customer convenience.
    • Invest in sustainable packaging solutions to attract eco-conscious consumers.

    By 2035, the market is expected to achieve substantial growth, reflecting evolving dining preferences and technological integration.

    Market Segmentation

    Virtual Kitchen Market Segmentation

    • North America
    • US
    • Canada
    • Europe
    • Germany
    • France
    • UK
    • Italy
    • Spain
    • Rest of Europe
    • Asia-Pacific
    • Rest of the World
    • Middle East
    • Africa
    • Latin America
    • China
    • Japan
    • India
    • Australia
    • Rest of Asia-Pacific

    Virtual Kitchen by Component Type Insights

    • Point-of-sale systems: This includes software and hardware used to process orders and manage inventory in real-time. Cloud kitchens may rely heavily on technology to manage their operations efficiently.
    • Order fulfillment equipment: This includes packaging and labeling equipment, such as food containers, bags, and labels, used to package and prepare orders for delivery.
    • Food storage and preparation equipment: This includes refrigerators, freezers, food prep tables, and other equipment used to store and prepare food before it is cooked.
    • Cooking equipment: This includes ovens, fryers, grills, and other cooking appliances used to prepare and cook food. In cloud kitchens, these appliances may be compact and designed for high-volume cooking.

    Key Companies in the Virtual Kitchen market includes

    • Deliveroo Editions
    • Deliverect
    • Editions by Uber Eats
    • Deliveroo Editions
    • DoorDash Kitchens
    • Ghost Kitchen Brands
    • Smart City Kitchens
    • The Local Culinary
    • Cheetay
    • Taster
    • Foodpanda Virtual Kitchen
    • Swiggy Access
    • Dahmakan
    • CloudKitchens
    • Kitopi
    • Zuul Kitchens
    • Keatz
    • Rebel Foods
    • Kitchen United

    Report Scope

    Attribute/Metric Details
    Market Size 2022 USD 34.2 Billion
    Market Size 2023 USD 39.1 Billion
    Market Size 2030 USD 80.9 Billion
    Compound Annual Growth Rate (CAGR) 10.95% (2023-2030)
    Base Year 2023
    Forecast Period 2023-2030
    Historical Data 2019 to 2022
    Forecast Units Value (USD Billion)
    Report Coverage Revenue Forecast, Competitive Landscape, Growth Factors, and Trends
    Segments Covered End-user Type, Deployment Type, Solution Type, and Region
    Geographies Covered North America, Europe, Asia Pacific, and the Rest of the World
    Countries Covered The U.S, Canada, Germany, France, the UK, Italy, Spain, China, Japan, India, Australia, South Korea, and Brazil
    Key Companies Profiled Kitchen United, Rebel Foods, Keatz, Zuul Kitchens, Kitopi, CloudKitchens, Dahmakan, Swiggy Access, Foodpanda Virtual Kitchen, Taster, Cheetay, The Local Culinary, Smart City Kitchens, Ghost Kitchen Brands, DoorDash Kitchens, Deliveroo Editions, Editions by Uber Eats, Deliverect and Deliveroo Editions
    Key Market Opportunities Targeting developing markets
    Key Market Dynamics The growth of food delivery services apps Better convenience, cost-effectiveness, and flexibility of virtual kitchens 

    Market Highlights

    Author

    Shubham Munde
    Research Analyst Level II

    She holds an experience of about 6+ years in market research and business consulting, working under the spectrum of information communication technology, telecommunications and semiconductor domains. aarti conceptualizes and implements a scalable business strategy and provides strategic leadership to the clients. her expertise lies in market estimation, competitive intelligence, pipeline analysis, customer assessment, etc.

    Leave a Comment

    Latest Comments

    John Doe
    john@example.com

    This is a great article! Really helped me understand the topic better.

    Posted on July 23, 2025, 10:15 AM
    Jane Smith
    jane@domain.com

    Thanks for sharing this. I’ve bookmarked it for later reference.

    Posted on July 22, 2025, 7:45 PM

    FAQs

    How much is the Virtual Kitchen market?

    The market for Virtual Kitchen was USD 34.2 Billion in 2022.

    What is the market size for 2030 for the Virtual Kitchen market?

    The analytics market is expected to be USD 80.9 Billion in 2030.

    What is the growth rate of the Virtual Kitchen market?

    Th growth rate for the Virtual Kitchen market is 10.95% through the forecast period.

    What are virtual kitchen market drivWhich region held the largest market share in the Virtual Kitchen market?rs?

    North America region held the largest market share in 2022.

    Who are the prominent players in the Virtual Kitchen market?

    The major players are dominating the market are Kitchen United, Rebel Foods, Keatz, Zuul Kitchens, Kitopi, CloudKitchens, Dahmakan, Swiggy Access, Foodpanda Virtual Kitchen, Taster, Cheetay, The Local Culinary, Smart City Kitchens, Ghost Kitchen Brands, DoorDash Kitchens, Deliveroo Editions, Editions by Uber Eats, Deliverect and Deliveroo Editions.

    1. |- Table of Contents
    2. 1    Market Introduction
      1.     INTRODUCTION    
      2.     SCOPE OF STUDY
        1.     RESEARCH OBJECTIVE
        2.     ASSUMPTIONS
        3.     LIMITATIONS
      3.     MARKET STRUCTURE
    3. 2    Research Methodology
      1.     RESEARCH TYPE
      2.     PRIMARY RESEARCH
      3.     SECONDARY RESEARCH
      4.     FORECAST MODEL
        1.     MARKET DATA COLLECTION, ANALYSIS & FORECAST
        2.     MARKET SIZE ESTIMATION
    4. 3    MARKET DYNAMICS 
      1.     INTRODUCTION
      2.     MARKET DRIVERS
      3.     MARKET CHALLENGES
      4.     MARKET OPPORTUNITIES 
      5.     MARKET RESTRAINTS
    5. 4    Executive Summary 
    6.     MARKET FACTOR ANALYSIS
      1.     PORTER’S FIVE FORCES ANALYSIS
      2.     SUPPLY CHAIN ANALYSIS
    7. 6    VIRTUAL KITCHEN MARKET, BY SEGMENTS
      1.     INTRODUCTION
      2.     MARKET STATISTICS
        1.     BY COMPONENT
        2.     BY TECHNOLOGY
        3.     BY END-USER
        4.     BY REGION
    8. 7    COMPETITIVE ANALYSIS
      1.     MARKET SHARE ANALYSIS
      2.     COMPANY PROFILES
        1.     MICROSOFT CORPORATION (U.S)
        2.     HTC CORPORATION (TAIWAN)
        3.     IKEA (NETHERLANDS)
        4.     SAMSUNG GROUP (SOUTH KOREA) 
        5.     LG ELECTRONICS INC. (SOUTH KOREA)
        6.     HOMER TLC, INC. (U.S.)
        7.     MICRO-STAR INTERNATIONAL (TAIWAN)
        8.     THE NATIONAL KITCHEN & BATH ASSOCIATION (U.S)
        9.     AETNA, INC. (U.S)
        10.     CAWDOR STONE GALLERY (U.K)
        11.     THE SATURN CORPORATION (U.S)
        12.     OTHERS
    9. List of Tables and Figures
      1.   LIST OF TABLES
      2. TABLE 1            VIRTUAL KITCHEN MARKET, BY COMPONENT
      3. TABLE 2            VIRTUAL KITCHEN MARKET, BY TECHNOLOGY
      4. TABLE 3            VIRTUAL KITCHEN MARKET, BY END-USER
      5. TABLE 4        VIRTUAL KITCHEN MARKET, BY REGIONS
      6. TABLE 5            NORTH AMERICA VIRTUAL KITCHEN MARKET, BY COMPONENT
      7. TABLE 6            NORTH AMERICA VIRTUAL KITCHEN MARKET, BY TECHNOLOGY
      8. TABLE 7            NORTH AMERICA VIRTUAL KITCHEN MARKET, BY END-USER
      9. TABLE 8            U.S. VIRTUAL KITCHEN MARKET, BY COMPONENT
      10. TABLE 9            U.S. VIRTUAL KITCHEN MARKET, BY TECHNOLOGY
      11. TABLE 10    U.S. VIRTUAL KITCHEN MARKET, BY END-USER
      12. TABLE 11    CANADA VIRTUAL KITCHEN MARKET, BY COMPONENT
      13. TABLE 12    CANADA VIRTUAL KITCHEN MARKET, BY TECHNOLOGY
      14. TABLE 13    CANADA VIRTUAL KITCHEN MARKET, BY END-USER
      15. TABLE 14    MEXICO VIRTUAL KITCHEN MARKET, BY COMPONENT
      16. TABLE 15    MEXICO VIRTUAL KITCHEN MARKET, BY TECHNOLOGY
      17. TABLE 16    MEXICO VIRTUAL KITCHEN MARKET, BY END-USER
      18. TABLE 17    EUROPE VIRTUAL KITCHEN MARKET, BY COMPONENT
      19. TABLE 18    EUROPE VIRTUAL KITCHEN MARKET, BY TECHNOLOGY
      20. TABLE 19    EUROPE VIRTUAL KITCHEN MARKET, BY END-USER
      21. TABLE 20    U.K. VIRTUAL KITCHEN MARKET, BY COMPONENT
      22. TABLE 21    U.K. VIRTUAL KITCHEN MARKET, BY TECHNOLOGY
      23. TABLE 22    U.K. VIRTUAL KITCHEN MARKET, BY END-USER
      24. TABLE 23    GERMANY VIRTUAL KITCHEN MARKET, BY COMPONENT
      25. TABLE 24    GERMANY VIRTUAL KITCHEN MARKET, BY TECHNOLOGY
      26. TABLE 25    GERMANY VIRTUAL KITCHEN MARKET, BY END-USER
      27. TABLE 26    FRANCE VIRTUAL KITCHEN MARKET, BY COMPONENT
      28. TABLE 27    FRANCE VIRTUAL KITCHEN MARKET, BY TECHNOLOGY
      29. TABLE 28    FRANCE VIRTUAL KITCHEN MARKET, BY END-USER
      30. TABLE 29    ITALY VIRTUAL KITCHEN MARKET, BY COMPONENT
      31. TABLE 30    ITALY VIRTUAL KITCHEN MARKET, BY TECHNOLOGY
      32. TABLE 31    ITALY VIRTUAL KITCHEN MARKET, BY END-USER
      33. TABLE 32    REST OF EUROPE VIRTUAL KITCHEN MARKET, BY COMPONENT
      34. TABLE 33    REST OF EUROPE VIRTUAL KITCHEN MARKET, BY TECHNOLOGY
      35. TABLE 34    REST OF EUROPE VIRTUAL KITCHEN MARKET, BY END-USER
      36. TABLE 35    ASIA PACIFIC VIRTUAL KITCHEN MARKET, BY COMPONENT
      37. TABLE 36    ASIA PACIFIC VIRTUAL KITCHEN MARKET, BY TECHNOLOGY
      38. TABLE 37    ASIA PACIFIC VIRTUAL KITCHEN MARKET, BY END-USER
      39. TABLE 38    CHINA VIRTUAL KITCHEN MARKET, BY COMPONENT
      40. TABLE 39    CHINA VIRTUAL KITCHEN MARKET, BY TECHNOLOGY
      41. TABLE 40    CHINA VIRTUAL KITCHEN MARKET, BY END-USER
      42. TABLE 41    JAPAN VIRTUAL KITCHEN MARKET, BY COMPONENT
      43. TABLE 42    JAPAN VIRTUAL KITCHEN MARKET, BY TECHNOLOGY
      44. TABLE 43    JAPAN VIRTUAL KITCHEN MARKET, BY END-USER
      45. TABLE 44    SOUTH KOREA VIRTUAL KITCHEN MARKET, BY COMPONENT
      46. TABLE 45    SOUTH KOREA VIRTUAL KITCHEN MARKET, BY TECHNOLOGY
      47. TABLE 46    SOUTH KOREA VIRTUAL KITCHEN MARKET, BY END-USER
      48. TABLE 47    INDIA VIRTUAL KITCHEN MARKET, BY COMPONENT
      49. TABLE 48    INDIA VIRTUAL KITCHEN MARKET, BY TECHNOLOGY
      50. TABLE 49    INDIA VIRTUAL KITCHEN MARKET, BY END-USER
      51. TABLE 50    REST OF ASIA PACIFIC VIRTUAL KITCHEN MARKET, BY COMPONENT
      52. TABLE 51    REST OF ASIA PACIFIC VIRTUAL KITCHEN MARKET, BY TECHNOLOGY
      53. TABLE 52    REST OF ASIA PACIFIC VIRTUAL KITCHEN MARKET, BY END-USER
      54. TABLE 53    REST OF THE WORLD VIRTUAL KITCHEN MARKET, BY COMPONENT
      55. TABLE 54    REST OF THE WORLD VIRTUAL KITCHEN MARKET, BY TECHNOLOGY
      56. TABLE 55    REST OF THE WORLD VIRTUAL KITCHEN MARKET, BY END-USER LIST OF FIGURES
      57. FIGURE 1    RESEARCH TYPE
      58. FIGURE 2    VIRTUAL KITCHEN MARKET, BY COMPONENT (%)
      59. FIGURE 3    VIRTUAL KITCHEN MARKET, BY TECHNOLOGY (%)
      60. FIGURE 4    VIRTUAL KITCHEN MARKET, BY ORGANIZATION SIZE (%)
      61. FIGURE 5    VIRTUAL KITCHEN MARKET, BY END-USER (%)
      62. FIGURE 6    VIRTUAL KITCHEN MARKET, BY REGIONS (%)
      63. FIGURE 7    NORTH AMERICA VIRTUAL KITCHEN MARKET, BY COMPONENT (%)
      64. FIGURE 8    NORTH AMERICA VIRTUAL KITCHEN MARKET, BY TECHNOLOGY (%)
      65. FIGURE 9    NORTH AMERICA VIRTUAL KITCHEN MARKET, BY ORGANIZATION SIZE (%)
      66. FIGURE 10    NORTH AMERICA VIRTUAL KITCHEN MARKET, BY END-USER (%)
      67. FIGURE 11    U.S. VIRTUAL KITCHEN MARKET, BY COMPONENT (%)
      68. FIGURE 12    U.S. VIRTUAL KITCHEN MARKET, BY TECHNOLOGY (%)
      69. FIGURE 13    U.S. VIRTUAL KITCHEN MARKET, BY ORGANIZATION SIZE (%)
      70. FIGURE 14    U.S. VIRTUAL KITCHEN MARKET, BY END-USER (%)
      71. FIGURE 15    CANADA VIRTUAL KITCHEN MARKET, BY COMPONENT (%)
      72. FIGURE 16    CANADA VIRTUAL KITCHEN MARKET, BY TECHNOLOGY (%)
      73. FIGURE 17    CANADA VIRTUAL KITCHEN MARKET, BY ORGANIZATION SIZE (%)
      74. FIGURE 18    CANADA VIRTUAL KITCHEN MARKET, BY END-USER (%)
      75. FIGURE 19    MEXICO VIRTUAL KITCHEN MARKET, BY COMPONENT (%)
      76. FIGURE 20    MEXICO VIRTUAL KITCHEN MARKET, BY TECHNOLOGY (%)
      77. FIGURE 21    MEXICO VIRTUAL KITCHEN MARKET, BY ORGANIZATION SIZE (%)
      78. FIGURE 22    MEXICO VIRTUAL KITCHEN MARKET, BY END-USER (%)
      79. FIGURE 23    EUROPE VIRTUAL KITCHEN MARKET, BY COMPONENT (%)
      80. FIGURE 24    EUROPE VIRTUAL KITCHEN MARKET, BY TECHNOLOGY (%)
      81. FIGURE 25    EUROPE VIRTUAL KITCHEN MARKET, BY ORGANIZATION SIZE (%)
      82. FIGURE 26    EUROPE VIRTUAL KITCHEN MARKET, BY END-USER (%)
      83. FIGURE 27    U.K. VIRTUAL KITCHEN MARKET, BY COMPONENT (%)
      84. FIGURE 28    U.K. VIRTUAL KITCHEN MARKET, BY TECHNOLOGY (%)
      85. FIGURE 29    U.K. VIRTUAL KITCHEN MARKET, BY ORGANIZATION SIZE (%)
      86. FIGURE 30    U.K. VIRTUAL KITCHEN MARKET, BY END-USER (%)
      87. FIGURE 31    GERMANY VIRTUAL KITCHEN MARKET, BY COMPONENT (%)
      88. FIGURE 32    GERMANY VIRTUAL KITCHEN MARKET, BY TECHNOLOGY (%)
      89. FIGURE 33    GERMANY VIRTUAL KITCHEN MARKET, BY ORGANIZATION SIZE (%)
      90. FIGURE 34    GERMANY VIRTUAL KITCHEN MARKET, BY END-USER (%)
      91. FIGURE 35    FRANCE VIRTUAL KITCHEN MARKET, BY COMPONENT (%)
      92. FIGURE 36    FRANCE VIRTUAL KITCHEN MARKET, BY TECHNOLOGY (%)
      93. FIGURE 37    FRANCE VIRTUAL KITCHEN MARKET, BY ORGANIZATION SIZE (%)
      94. FIGURE 38    FRANCE VIRTUAL KITCHEN MARKET, BY END-USER (%)
      95. FIGURE 39    ITALY VIRTUAL KITCHEN MARKET, BY COMPONENT (%)
      96. FIGURE 40    ITALY VIRTUAL KITCHEN MARKET, BY TECHNOLOGY (%)
      97. FIGURE 41    ITALY VIRTUAL KITCHEN MARKET, BY ORGANIZATION SIZE (%)
      98. FIGURE 42    ITALY VIRTUAL KITCHEN MARKET, BY END-USER (%)
      99. FIGURE 43    REST OF EUROPE VIRTUAL KITCHEN MARKET, BY COMPONENT (%)
      100. FIGURE 44    REST OF EUROPE VIRTUAL KITCHEN MARKET, BY TECHNOLOGY (%)
      101. FIGURE 45    REST OF EUROPE VIRTUAL KITCHEN MARKET, BY ORGANIZATION SIZE (%)
      102. FIGURE 46    REST OF EUROPE VIRTUAL KITCHEN MARKET, BY END-USER (%)
      103. FIGURE 47    ASIA PACIFIC VIRTUAL KITCHEN MARKET, BY COMPONENT (%)
      104. FIGURE 48    ASIA PACIFIC VIRTUAL KITCHEN MARKET, BY TECHNOLOGY (%)
      105. FIGURE 49    ASIA PACIFIC VIRTUAL KITCHEN MARKET, BY ORGANIZATION SIZE (%)
      106. FIGURE 50    ASIA PACIFIC VIRTUAL KITCHEN MARKET, BY END-USER (%)
      107. FIGURE 51    CHINA VIRTUAL KITCHEN MARKET, BY COMPONENT (%)
      108. FIGURE 52    CHINA VIRTUAL KITCHEN MARKET, BY TECHNOLOGY (%)
      109. FIGURE 53    CHINA VIRTUAL KITCHEN MARKET, BY ORGANIZATION SIZE (%)
      110. FIGURE 54    CHINA VIRTUAL KITCHEN MARKET, BY END-USER (%)
      111. FIGURE 55    JAPAN VIRTUAL KITCHEN MARKET, BY COMPONENT (%)
      112. FIGURE 56    JAPAN VIRTUAL KITCHEN MARKET, BY TECHNOLOGY (%)
      113. FIGURE 57    JAPAN VIRTUAL KITCHEN MARKET, BY ORGANIZATION SIZE (%)
      114. FIGURE 58    JAPAN VIRTUAL KITCHEN MARKET, BY END-USER (%)
      115. FIGURE 59    SOUTH KOREA VIRTUAL KITCHEN MARKET, BY COMPONENT (%)
      116. FIGURE 60    SOUTH KOREA VIRTUAL KITCHEN MARKET, BY TECHNOLOGY (%)
      117. FIGURE 61    SOUTH KOREA VIRTUAL KITCHEN MARKET, BY ORGANIZATION SIZE (%)
      118. FIGURE 62    SOUTH KOREA VIRTUAL KITCHEN MARKET, BY END-USER (%)
      119. FIGURE 63    INDIA VIRTUAL KITCHEN MARKET, BY COMPONENT (%)
      120. FIGURE 64    INDIA VIRTUAL KITCHEN MARKET, BY TECHNOLOGY (%)
      121. FIGURE 65    INDIA VIRTUAL KITCHEN MARKET, BY ORGANIZATION SIZE (%)
      122. FIGURE 66    INDIA VIRTUAL KITCHEN MARKET, BY END-USER (%)
      123. FIGURE 67    REST OF ASIA PACIFIC VIRTUAL KITCHEN MARKET, BY COMPONENT (%)
      124. FIGURE 68    REST OF ASIA PACIFIC VIRTUAL KITCHEN MARKET, BY TECHNOLOGY (%)
      125. FIGURE 69    REST OF ASIA PACIFIC VIRTUAL KITCHEN MARKET, BY ORGANIZATION SIZE (%)
      126. FIGURE 70    REST OF ASIA PACIFIC VIRTUAL KITCHEN MARKET, BY END-USER (%)
      127. FIGURE 71    REST OF THE WORLD VIRTUAL KITCHEN MARKET, BY COMPONENT (%)
      128. FIGURE 72    REST OF THE WORLD VIRTUAL KITCHEN MARKET, BY TECHNOLOGY (%)
      129. FIGURE 73    REST OF THE WORLD VIRTUAL KITCHEN MARKET, BY ORGANIZATION SIZE (%)
      130. FIGURE 74    REST OF THE WORLD VIRTUAL KITCHEN MARKET, BY END-USER (%)

    Virtual Kitchen Market Segmentation

    Virtual Kitchen Market by Component Type Outlook (USD Billion, 2023-2030)

    • Hardware
    • Software
    • Service

    Virtual Kitchen Market by End-User Outlook (USD Billion, 2023-2030)

    • Commercial Space
    • Residential
    • Hospitality

    Virtual Kitchen Market Regional Outlook (USD Billion, 2023-2030)

    • North America Outlook (USD Billion, 2023-2030)

      • North America Virtual Kitchen Market by Component Type
    • Hardware
    • Software
    • Service
      • North America Virtual Kitchen Market by End-User
    • Commercial Space
    • Residential
    • Hospitality
      • US Outlook (USD Billion, 2023-2030)

      • US Virtual Kitchen Market by Component Type
    • Hardware
    • Software
    • Service
      • US Virtual Kitchen Market by End-User
    • Commercial Space
    • Residential
    • Hospitality
      • CANADA Outlook (USD Billion, 2023-2030)

      • CANADA Virtual Kitchen Market by Component Type
    • Hardware
    • Software
    • Service
      • CANADA Virtual Kitchen Market by Technology Provider
    • Wi-Fi
    • 3D
    • Artificial Intelligence
      • CANADA Virtual Kitchen Market by End-User
    • Commercial Space
    • Residential
    • Hospitality
    • Europe Outlook (USD Billion, 2023-2030)

      • Europe Virtual Kitchen Market by Component Type
    • Hardware
    • Software
    • Service
      • Europe Virtual Kitchen Market by End-User
    • Commercial Space
    • Residential
    • Hospitality
      • Germany Outlook (USD Billion, 2023-2030)

      • Germany Virtual Kitchen Market by Component Type
    • Hardware
    • Software
    • Service
      • Germany Virtual Kitchen Market by End-User
    • Commercial Space
    • Residential
    • Hospitality
      • France Outlook (USD Billion, 2023-2030)

      • France Virtual Kitchen Market by Component Type
    • Hardware
    • Software
    • Service
      • France Virtual Kitchen Market by End-User
    • Commercial Space
    • Residential
    • Hospitality
      • UK Outlook (USD Billion, 2023-2030)

      • UK Virtual Kitchen Market by Component Type
    • Hardware
    • Software
    • Service
      • UK Virtual Kitchen Market by End-User
    • Commercial Space
    • Residential
    • Hospitality
      • ITALY Outlook (USD Billion, 2023-2030)

      • ITALY Virtual Kitchen Market by Component Type
    • Hardware
    • Software
    • Service
      • ITALY Virtual Kitchen Market by End-User
    • Commercial Space
    • Residential
    • Hospitality
      • SPAIN Outlook (USD Billion, 2023-2030)

      • Spain Virtual Kitchen Market by Component Type
    • Hardware
    • Software
    • Service
      • Spain Virtual Kitchen Market by End-User
    • Commercial Space
    • Residential
    • Hospitality
      • Rest Of Europe Outlook (USD Billion, 2023-2030)

      • Rest Of Europe Virtual Kitchen Market by Component Type
    • Hardware
    • Software
    • Service
      • REST OF EUROPE Virtual Kitchen Market by End-User
    • Commercial Space
    • Residential
    • Hospitality
    • Asia-Pacific Outlook (USD Billion, 2023-2030)

      • Asia-Pacific Virtual Kitchen Market by Component Type
    • Hardware
    • Software
    • Service
      • Asia-Pacific Virtual Kitchen Market by End-User
    • Commercial Space
    • Residential
    • Hospitality
      • China Outlook (USD Billion, 2023-2030)

      • China Virtual Kitchen Market by Component Type
    • Hardware
    • Software
    • Service
      • China Virtual Kitchen Market by End-User
    • Commercial Space
    • Residential
    • Hospitality
      • Japan Outlook (USD Billion, 2023-2030)

      • Japan Virtual Kitchen Market by Component Type
    • Hardware
    • Software
    • Service
      • Japan Virtual Kitchen Market by End-User
    • Commercial Space
    • Residential
    • Hospitality
      • India Outlook (USD Billion, 2023-2030)

      • India Virtual Kitchen Market by Component Type
    • Hardware
    • Software
      • India Virtual Kitchen Market by End-User
    • Commercial Space
    • Residential
    • Hospitality
      • Australia Outlook (USD Billion, 2023-2030)

      • Australia Virtual Kitchen Market by Component Type
    • Hardware
    • Software
    • Service
      • Australia Virtual Kitchen Market by End-User
    • Commercial Space
    • Residential
    • Hospitality
      • Rest of Asia-Pacific Outlook (USD Billion, 2023-2030)

      • Rest of Asia-Pacific Virtual Kitchen Market by Component Type
    • Hardware
    • Software
    • Service
      • Rest of Asia-Pacific Virtual Kitchen Market by End-User
    • Commercial Space
    • Residential
    • Hospitality
    • Rest of the World Outlook (USD Billion, 2023-2030)

      • Rest of the World Virtual Kitchen Market by Component Type
    • Hardware
    • Software
    • Service
      • Rest of the World Virtual Kitchen Market by End-User
    • Commercial Space
    • Residential
    • Hospitality
      • Middle East Outlook (USD Billion, 2023-2030)

      • Middle East Virtual Kitchen Market by Component Type
    • Hardware
    • Software
    • Service
      • Middle East Virtual Kitchen Market by End-User
    • Commercial Space
    • Residential
    • Hospitality
      • Africa Outlook (USD Billion, 2023-2030)

      • Africa Virtual Kitchen Market by Component Type
    • Hardware
    • Software
    • Service
      • Africa Virtual Kitchen Market by End-User
    • Commercial Space
    • Residential
    • Hospitality
      • Latin America Outlook (USD Billion, 2023-2030)

      • Latin America Virtual Kitchen Market by Component Type
    • Hardware
    • Software
    • Service
      • Latin America Virtual Kitchen Market by End-User
    • Commercial Space
    • Residential
    • Hospitality
    Infographic

    Free Sample Request

    Kindly complete the form below to receive a free sample of this Report

    Get Free Sample

    Customer Strories

    “I am very pleased with how market segments have been defined in a relevant way for my purposes (such as "Portable Freezers & refrigerators" and "last-mile"). In general the report is well structured. Thanks very much for your efforts.”

    Victoria Milne

    Founder
    Case Study
    Chemicals and Materials