• Cat-intel
  • MedIntelliX
  • Resources
  • About Us
  • Hero Background
    English
    Chinese
    French
    Japanese
    Korean
    German
    Spanish

    Quantum Dots Market Share

    ID: MRFR/SEM/7236-HCR
    111 Pages
    Aarti Dhapte
    October 2025

    Quantum Dots Market Research Report Information By Material (Cadmium-based and Cadmium-free), By Product (Displays, Other Products (Lasers, Solar Cells, Medical Devices, Photodetectors/Sensors, Lighting (LED) Product, Batteries and Energy Storage Systems, Transistors, and Chips & Tags)), By Vertical (Consumer, Commercial, Healthcare, Defense, Telecommunications, Others), By Production (Coll...

    Share:
    Download PDF ×

    We do not share your information with anyone. However, we may send you emails based on your report interest from time to time. You may contact us at any time to opt-out.

    Quantum Dots Market Infographic
    $ 4,950.0
    $ 5,950.0
    $ 7,250.0

    Market Share

    Quantum Dots Market Share Analysis

    The Quantum Dots Market is becoming more competitive as competitors compete for market share. In this dynamic environment, firms use numerous positioning tactics to become leaders and acquire a competitive edge. Companies often differentiate their quantum dots from competitors with unique features or greater quality. Advanced technology, exclusive production procedures, or improved performance may distinguish a product.

    Another technique is cost leadership, where organizations compete to be the cheapest Quantum Dots Market provider. Optimizing production processes, simplifying supply chains, and attaining economies of scale allow organizations to compete on price for price-sensitive customers. This strategy targets a wider client base, especially in price-driven markets, to gain market share.

    Some organizations target certain Quantum Dots Market segments or applications using a specialized market strategy. Businesses can focus on meeting the needs of a certain customer group with this technique. A company that specializes in quantum dots for medical imaging may tailor its services to the healthcare industry. Companies can gain client loyalty and a good reputation by specializing.

    Partnerships and collaboration are very popular in the Quantum Dots Market. Companies partner with research organizations, universities, and other enterprises to exploit complementary skills and resources. Firms can expedite innovation, save development costs, and gain a competitive edge by sharing expertise and resources. Collaborations can also provide new market opportunities and boost the parties' market positions.

    Companies pursuing Quantum Dots Market share also use market penetration. Marketing and sales efforts are increased to promote existing items to present clients or penetrate new geographic areas. This strategy uses aggressive pricing, promotions, and distribution growth. The goal is to increase sales and market share.

    Quantum Dots Market firms also stress customer-centric tactics. Understanding client wants and preferences is essential for creating market-relevant products. Companies use market research to understand client expectations and personalize quantum dot solutions. Customer satisfaction and loyalty fuel market share retention and growth.

    To stay competitive, Quantum Dots Market enterprises must modify their positioning strategies as technology evolves. Market share positioning requires continuous innovation, agility in responding to market developments, and a strong grasp of customer dynamics. In the ever-changing Quantum Dots Market, organizations who can balance differentiation, cost leadership, specialized targeting, collaboration, and customer-centricity will succeed.

    Market Summary

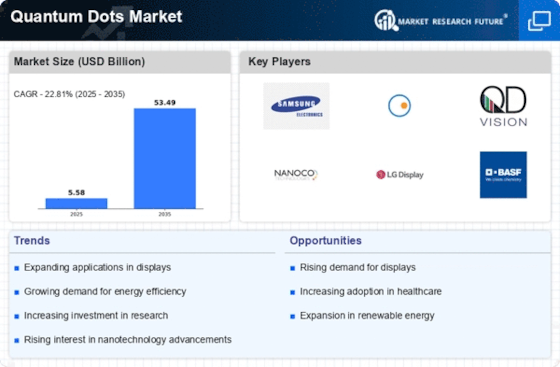
    As per Market Research Future Analysis, the global Quantum Dots Market was valued at USD 5.58 billion in 2024 and is projected to reach USD 53.49 billion by 2035, growing at a CAGR of 22.81% from 2025 to 2035. The market is driven by increased energy consumption, leading to higher demand for solar cells and the unique properties of quantum dots that enhance their application across various industries. Cadmium-based quantum dots accounted for 69% of market revenue in 2019, while the cadmium-free segment is expected to grow significantly due to environmental concerns. The Asia-Pacific region dominated the market with a 45.8% share in 2019, driven by consumer demand for advanced technology and touchscreen devices.

    Key Market Trends & Highlights

    Key trends driving the Quantum Dots Market include rising energy consumption and advancements in technology.

    • Market Size in 2024: USD 5.58 billion.
    • Projected Market Size by 2035: USD 53.49 billion.
    • CAGR from 2025 to 2035: 22.81%.
    • Cadmium-based quantum dots held 69% of market revenue in 2019.

    Market Size & Forecast

    2024 Market Size USD 5.58 billion
    2035 Market Size USD 53.49 billion
    CAGR (2024-2035) 22.81%
    Largest Regional Market Share in 2019 Asia-Pacific (45.8%).

    Major Players

    Major players include Samsung Electronics, Nanosys, Nanoco Group, Crystal US Corporation, QD Laser, and Merck Group.

    Market Trends

    Growth in energy consumption is driving the market growth.

    The market CAGR for quantum dots is being driven by the growing demand for energy consumption with the rising population. The need for solar cells is rising with the population increase, encouraging solar cell producers to incorporate these Quantum dots into their devices to increase electricity production. The long-term benefits of quantum dots, including their narrow emission ranges, higher stability even in difficult climate factors, and emission tenability, are driving their adoption in various end-user sectors in recent years.

    Market players of the display devices also prioritize the Quantum dots' lower power usage while designing their products. Particularly, the quantum dots displays are renowned for their color resolution and purity and are anticipated to provide viewers with experience. Dynamic range. The National Renewable Energy Laboratory (NREL) researched that nanotechnology can greatly enhance the amount of power produced by solar cells. Moreover, heavy investment in research and development for efficiently utilizing quantum dots contributes to the market's overall growth.

    Due to the pandemic's supply and demand imbalance, Quantum Dots' producers were also severely impacted. The medical community concentrated on implementing cutting-edge technologies during COVID-19 to make disease diagnosis easier using quantum dot nanoparticles found in medical equipment. Following the pandemic, with increased demand in the displays and advertising sectors, these factors are anticipated to boost the expansion of the quantum dot market throughout the forecast year.

    For instance, Monash University has developed an algorithm to increase the compatibility and effectiveness of sunlight sensitizers in solar panels. They found that the most effective silicon solar cells included Lead Sulphide quantum dot sensitizers with quantum diameters of about 2.2 nm, which coincide with the solar spectrum which solar cells collect while having a considerable impact on energy efficiency. As a result, it is anticipated that demand for quantum dots will increase throughout the projection period due to the rising demand for energy-efficient devices, especially solar cells. Thus, it drives the Quantum Dots Market revenue.

    The Global Quantum Dots Market is poised for transformative growth, driven by advancements in nanotechnology and increasing applications in displays and photovoltaics.

    U.S. Department of Energy

    Quantum Dots Market Market Drivers

    Market Growth Projections

    The Global Quantum Dots Market Industry is projected to experience substantial growth, with estimates indicating a market value of 53.6 USD Billion by 2035. The anticipated compound annual growth rate (CAGR) of 22.83% from 2025 to 2035 reflects the increasing adoption of quantum dot technologies across various sectors. This growth trajectory suggests that quantum dots will play a crucial role in shaping future innovations in display technologies, renewable energy, and healthcare applications. As industries continue to explore the potential of quantum dots, the market is likely to expand significantly in the coming years.

    Growth in Consumer Electronics

    The Global Quantum Dots Market Industry is significantly influenced by the growth in consumer electronics, where quantum dots are increasingly utilized in various devices. The demand for high-resolution displays in smartphones, tablets, and laptops is driving manufacturers to adopt quantum dot technology. This trend is expected to propel the market forward, with a projected compound annual growth rate (CAGR) of 22.83% from 2025 to 2035. As consumer preferences shift towards devices that offer superior visual quality, the integration of quantum dots is likely to become a standard feature in the electronics sector.

    Innovations in Medical Imaging

    The Global Quantum Dots Market Industry is benefiting from innovations in medical imaging technologies. Quantum dots are being explored for their potential in enhancing imaging techniques, such as fluorescence imaging and targeted drug delivery. These applications could lead to more accurate diagnostics and improved patient outcomes. The increasing focus on personalized medicine and advanced healthcare solutions suggests a growing market for quantum dot applications in the medical field. As research progresses, the integration of quantum dots in medical imaging may redefine standards in healthcare technology.

    Rising Demand for Display Technologies

    The Global Quantum Dots Market Industry is experiencing a surge in demand for advanced display technologies, particularly in televisions and smartphones. Quantum dots enhance color accuracy and energy efficiency, making them attractive for manufacturers. As of 2024, the market is valued at approximately 5.58 USD Billion, driven by the increasing adoption of OLED and QLED displays. Companies are investing in quantum dot technology to improve visual experiences, which is expected to contribute to the industry's growth. This trend suggests that the integration of quantum dots in display technologies could significantly influence market dynamics in the coming years.

    Advancements in Solar Energy Applications

    The Global Quantum Dots Market Industry is witnessing advancements in solar energy applications, particularly in photovoltaic cells. Quantum dots have the potential to improve the efficiency of solar panels by enabling better light absorption and conversion. This innovation aligns with global efforts to transition to renewable energy sources. The market is projected to grow substantially, with estimates indicating a value of 53.6 USD Billion by 2035. As governments and organizations prioritize sustainable energy solutions, the integration of quantum dots in solar technology may play a pivotal role in achieving energy efficiency goals.

    Environmental Regulations and Sustainability

    The Global Quantum Dots Market Industry is also shaped by increasing environmental regulations and a shift towards sustainability. Quantum dots, particularly those made from non-toxic materials, are gaining traction as industries seek eco-friendly alternatives. This trend is likely to drive innovation and investment in quantum dot technologies that align with sustainability goals. As global awareness of environmental issues rises, the demand for sustainable materials in various applications, including electronics and energy, may enhance the growth prospects of the quantum dots market.

    Market Segment Insights

    Quantum Dots Material Insights

    The global Quantum Dots Market segmentation, based on Material, includes Cadmium-based and Cadmium-free. Cadmium-based quantum dots dominated the market, accounting for 69% of market revenue (USD 2.4 billion) in 2019. Leading market players are developing cadmium-free quantum dot technology as it is a safer and more environmentally friendly choice for manufacturers; therefore cadmium-free segment is anticipated to increase significantly during the forecast period.

    Source: Secondary Research, Primary Research, MRFR Database, and Analyst Review

    Quantum Dots Product Insights

    The global Quantum Dots Market segmentation, based on Product includes Displays, and Other Products like Lasers, Solar Cells, Medical Devices, Sensors, Lighting Products, Batteries and Energy Storage Systems, Transistors, and Chips & Tags. Solar cells (other products category) have dominated the market share and will be the fastest-growing segment in 2019. The expansion of the Quantum Dot industry is driven by the rising use of solar panels in numerous nations.

    Quantum Dots Vertical Insights

    The global Quantum Dots Market segmentation, based on Vertical, includes Consumer, Commercial, Healthcare, Defense, Telecommunications, and Others. The consumer dominated the market, accounting for 60.3% of the market share in 2019. As in many regions, the commercial segment is the fastest-growing segment in the quantum dots industry. Governments are introducing a favorable policy to promote renewable technologies like solar cells.

    Get more detailed insights about Quantum Dots Market Research Report - Forecast till 2032

    Regional Insights

    By Region, the study provides market insights into North America, Europe, Asia-Pacific, and the Rest of the World. The Asia-Pacific quantum dots market area dominates this market, accounting for 45.8% of market revenue (USD 1.6 billion) in 2019. In addition, the growing consumer demand for touchscreen devices and advanced technology will boost the market growth in this Region.

    Further, the major countries studied in the market report are The U.S., Canada, German, France, the UK, Italy, Spain, China, Japan, India, Australia, South Korea, and Brazil.

    Figure 3: Global Quantum Dots Market Share by Region 2019 (%)

    Global Quantum Dots Market Share by Region 2019

    Source: Secondary Research, Primary Research, MRFR Database, and Analyst Review

    North American Quantum Dots Market accounts for the second-largest market share due to the quick adoption of quantum dots technology driving growing penetration for electronics. Moreover, US Quantum Dots Markets held the largest market share, and the Canada Quantum Dots Market was the fastest-growing market in the area.

    The Europe Quantum Dots Market is anticipated to expand at the fastest CAGR from 2023 to 2032. It is due to the increasing standard of living, improved internet connectivity, and technology that drives the demand for quantum dots in this Region. Moreover, UK and South Korean Quantum Dots Markets held the largest market share, and the GErmany Quantum Dots Market was the fastest-growing market in the region.

    For instance, consumers increased consumption of energy-based gadgets, especially solar cells in the Asia-pacific region, impacts the overall growth and revenue of the quantum dots industry. It resulted in the adoption of quantum displays in television, smartphone, and others.

    Key Players and Competitive Insights

    Leading market players are investing heavily in research and development to support various applications, including optoelectronics, biological imaging, security, and surveillance, which will help the Quantum Dots Market to expand. The market participants have chosen collaboration and strategic partnership with other organizations as major strategies to pool their knowledge and create superior Quantum Dot-based goods and solutions with important market developments. The Quantum Dots Market industry must offer significant utility cost-saving products to expand and survive in a hyper-competitive and growing market.

    Display manufacturers heavily use Quantum Dots technology for possible advantages, including improved display quality with less power usage in the global Quantum Dots Market industry to benefit consumers and capture a large market share. In recent times, the Quantum Dots Market industry has offered significant advantages to end-user industries. Major players in the Quantum Dots Market, including Samsung Electronics (South Korea), Nanosys (US), Nanoco Group (UK), Crystal US Corporation (US), QD Laser (Japan), Merck Group (Germany), and others are attempting to lower use of harmful elements in the manufacturing of Quantum dots which will significantly impact overall market demand.

    Samsung, founded by Lee Byung-Chull, is one of the biggest manufacturers of electrical products in the world. It was established on March 1, 1938. Samsung focuses on producing a wide range of consumer and commercial electronics, including system components, digital media players, semiconductors, and utilities. Samsung now ranks among the most famous names in technology and contributes to nearly one-fifth of all exports from South Korea. In October 2020, Samsung Electronics developed the leading cadmium-free blue quantum dot light-emitting diode. The innovative technology boasts a 20.2% luminous efficiency and a QLED lifetime of 16,000 hours.

    Samsung also started creating small LED screens in South Korea and debuted the QLED TV with superior energy ratings.

    Nanosys Inc., which was established and had its headquarters in California's Silicon Valley, is an innovator and market leader in creating and supplying quantum dot (QD) technology to the display industry. With the exclusive quantum dot technology, it is a market-leading consumer electronics firm that has delivered over 60 million products as of 2019, ranging from tablets to displays and TVs. It has a strong and appealing intellectual property portfolio and runs the world's biggest nanomaterials fabrication facility for quantum dots. Their acquisition of the world's top microLED display technology business was announced in May 2021.

    With the acquisition, Nanosys intends to broaden its product line, improve its development, and use microLED and nanoLED display technology.

    Key Companies in the Quantum Dots Market market include

    Industry Developments

    • Q2 2024: Samsung Display launches new QD-OLED reference monitors for film and broadcast productions Samsung Display, in collaboration with SmallHD and Flanders Scientific Inc. (FSI), launched new QD-OLED reference monitors designed for film and broadcast production, enabling professionals to check footage quality and calibrate color tones and images for content concepts.

    Future Outlook

    Quantum Dots Market Future Outlook

    The Quantum Dots Market is projected to grow at a 22.81% CAGR from 2025 to 2035, driven by advancements in display technologies, increasing demand for energy-efficient solutions, and expanding applications in healthcare.

    New opportunities lie in:

    • Develop innovative quantum dot materials for enhanced display performance in consumer electronics.
    • Explore partnerships with automotive manufacturers for integrating quantum dots in next-gen displays.
    • Invest in R&D for quantum dot applications in renewable energy technologies.

    By 2035, the Quantum Dots Market is expected to achieve substantial growth, reflecting its pivotal role in various high-tech industries.

    Market Segmentation

    Quantum Dots Regional Outlook

    • North America
    • US
    • Canada
    • Europe
    • Germany
    • France
    • UK
    • Italy
    • Spain
    • Rest of Europe
    • Asia-Pacific
    • China
    • Japan
    • India
    • Australia
    • South Korea
    • Rest of Asia-Pacific
    • Rest of the World
    • Middle East
    • Africa
    • Latin America

    Quantum Dots Product Outlook (USD Billion, 2019-2032)

    • Displays
    • Other Products
    • Lasers
    • Solar Cells
    • Medical Devices
    • Photodetectors/Sensors
    • Lighting (LED) Products
    • Batteries and Energy Storage Systems
    • Transistors
    • Chips & Tags

    Quantum Dots Material Outlook (USD Billion, 2019-2032)

    • Cadmium-based
    • Cadmium-free

    Quantum Dots Vertical Outlook (USD Billion, 2019-2032)

    • Consumer
    • Commercial
    • Healthcare
    • Defense
    • Telecommunications
    • Others

    Quantum Dots Production Outlook (USD Billion, 2019-2032)

    • Colloidal synthesis
    • Plasma synthesis

    Report Scope

    Report Attribute/Metric Details
    Market Size 2024 USD 5.58 billion
    Market Size 2035 53.49 (Value (USD Billion))
    Compound Annual Growth Rate (CAGR) 22.81% (2025 - 2035)
    Base Year 2024
    Market Forecast Period 2025 - 2035
    Historical Data 2019- 2021
    Market Forecast Units Value (USD Billion)
    Report Coverage Revenue Forecast, Market Competitive Landscape, Growth Factors, and Trends
    Segments Covered Material, Product, Vertical, Production, and Region
    Geographies Covered North America, Europe, Asia Pacific, and the Rest of the World
    Countries Covered The U.S., Canada, German, France, the UK, Italy, Spain, China, Japan, India, Australia, South Korea, and Brazil
    Key Companies Profiled Samsung Electronics (South Korea), Nanosys (US), Nanoco Group (UK), Crystal US Corporation (US), QD Laser (Japan), Merck Group (Germany), NanoPhotonica (US), OSRAM Licht (Germany), Crystallex Corporation (US), LG Electronics (South Korea), and DuPont (US).
    Key Market Opportunities Consumer demand for large and high-resolution displays is anticipated to fuel Quantum Dot’s growth.
    Key Market Dynamics The rising global population led to rising demand for energy needs.
    Market Size 2025 6.85 (Value (USD Billion))

    Market Highlights

    Author

    Aarti Dhapte
    Team Lead - Research

    She holds an experience of about 6+ years in market research and business consulting, working under the spectrum of information communication technology, telecommunications and semiconductor domains. aarti conceptualizes and implements a scalable business strategy and provides strategic leadership to the clients. her expertise lies in market estimation, competitive intelligence, pipeline analysis, customer assessment, etc.

    Leave a Comment

    Latest Comments

    John Doe
    john@example.com

    This is a great article! Really helped me understand the topic better.

    Posted on July 23, 2025, 10:15 AM
    Jane Smith
    jane@domain.com

    Thanks for sharing this. I’ve bookmarked it for later reference.

    Posted on July 22, 2025, 7:45 PM

    FAQs

    How much is the Quantum Dots Market?

    The global Quantum Dots Market size was estimated at USD 5.58 billion in 2024.

    What is the growth rate of the Quantum Dots market?

    The Quantum dot market is projected to grow at a CAGR of 22.81% during 2025 to 2035.

    Which Region holds the largest market share in the Quantum Dots Market?

    Asia-Pacific had the largest share of the global market.

    Who are the key participants in the Quantum Dots Market?

    The key players in the market are Samsung Electronics (South Korea), Nanosys (US), Crystal US Corporation (US), QD Laser (Japan), Merck Group (Germany), NanoPhotonica (US), OSRAM Licht (Germany), Crystallex Corporation (US), and DuPont (US).

    Which Material Led the Quantum Dots Market?

    Cadmium-based category dominated the market in 2019.

    Which Product had the largest market share in the Quantum Dots Market market?

    Solar cells had the largest share of the global market.

    1. Executive Summary
      1. Market Attractiveness Analysis
        1. Global Quantum Dots Market, by Product
        2. Global Quantum Dots Market, by Material
        3. Global Quantum Dots Market, by Vertical
        4. Global Quantum Dots Market, by Region
    2. Market Introduction
      1. Definition
      2. Scope of the Study
      3. Market Structure
      4. Key Buying Criteria
      5. Macro Factor Indicator Analysis
    3. Research Methodology
      1. Research Process
      2. Primary Research
      3. Secondary Research
      4. Market Size Estimation
      5. Forecast Model
      6. List of Assumptions
    4. MARKET DYNAMICS
      1. Introduction
      2. Drivers
      3. Restraints
      4. Opportunities
      5. Challenges
    5. MARKET FACTOR ANALYSIS
      1. Value Chain Analysis/Supply Chain Analysis
      2. Porter’s Five Forces Model
        1. Bargaining Power of Suppliers
        2. Bargaining Power of Buyers
        3. Threat of New Entrants
        4. Threat of Substitutes
        5. Intensity of Rivalry
    6. GLOBAL QUANTUM DOTS MARKET, BY PRODUCT
      1. Introduction
      2. Displays
        1. Market Estimates & Forecast, 2024—2032
      3. Solar Cells
        1. Market Estimates & Forecast, 2024—2032
      4. Photodetectors
        1. Market Estimates & Forecast, 2024—2032
      5. Lasers
        1. Market Estimates & Forecast, 2024—2032
      6. LED
        1. Market Estimates & Forecast, 2024—2032
      7. Transistors
        1. Market Estimates & Forecast, 2024—2032
      8. Others
        1. Market Estimates & Forecast, 2024—2032
    7. GLOBAL QUANTUM DOTS MARKET, BY MATERIAL
      1. Introduction
      2. Cadmium Selenide
        1. Market Estimates & Forecast, 2024—2032
      3. Cadmium Sulfide
        1. Market Estimates & Forecast, 2024—2032
      4. Cadmium Telluride
        1. Market Estimates & Forecast, 2024—2032
      5. Zinc sulfide
        1. Market Estimates & Forecast, 2024—2032
      6. Indium
        1. Market Estimates & Forecast, 2024—2032
      7. Silicon
        1. Market Estimates & Forecast, 2024—2032
      8. Others
        1. Market Estimates & Forecast, 2024—2032
    8. GLOBAL QUANTUM DOTS MARKET, BY VERTICAL
      1. Introduction
      2. Consumer
        1. Market Estimates & Forecast, 2024—2032
      3. Telecommunication
        1. Market Estimates & Forecast, 2024—2032
      4. Commercial
        1. Market Estimates & Forecast, 2024—2032
      5. Healthcare
        1. Market Estimates & Forecast, 2024—2032
      6. Defense
        1. Market Estimates & Forecast, 2024—2032
      7. Others
        1. Market Estimates & Forecast, 2024—2032
    9. GLOBAL QUANTUM DOTS MARKET, BY REGION
      1. Introduction
      2. North America
        1. Market Estimates & Forecast, by Product, 2024—2032
        2. Market Estimates & Forecast, by Material, 2024—2032
        3. Market Estimates & Forecast, by Vertical, 2024—2032
        4. Market Estimates & Forecast, by Country, 2024—2032
      3. Europe
        1. Market Estimates & Forecast, by Product, 2024—2032
        2. Market Estimates & Forecast, by Material, 2024—2032
        3. Market Estimates & Forecast, by Vertical, 2024—2032
        4. Market Estimates & Forecast, by Country, 2024—2032
      4. Asia-Pacific
        1. Market Estimates & Forecast, by Product, 2024—2032
        2. Market Estimates & Forecast, by Material, 2024—2032
        3. Market Estimates & Forecast, by Vertical, 2024—2032
        4. Market Estimates & Forecast, by Country, 2024—2032
        5. China
        6. India
        7. Japan
        8. South Korea
        9. Rest of Asia-Pacific
      5. Rest of the World
        1. Market Estimates & Forecast, by Product, 2024—2032
        2. Market Estimates & Forecast, by Material, 2024—2032
        3. Market Estimates & Forecast, by Vertical, 2024—2032
        4. Market Estimates & Forecast, by Region, 2024—2032
        5. Middle East & Africa
        6. Central & South America
    10. Competitive Landscape
      1. Introduction
      2. Competitive Analysis
    11. COMPANY PROFILES
      1. Nanoco Group
        1. Company Overview
        2. Financial Overview
        3. Products Offered
        4. Key Developments
        5. SWOT Analysis
        6. Key Strategies
      2. Nanosys, Inc.
        1. Company Overview
        2. Financial Overview
        3. Products Offered
        4. Key Developments
        5. SWOT Analysis
        6. Key Strategies
      3. QD Vision
        1. Company Overview
        2. Financial Overview
        3. Products Offered
        4. Key Developments
        5. SWOT Analysis
        6. Key Strategies
      4. NN-Labs
        1. Company Overview
        2. Financial Overview
        3. Products Offered
        4. Key Developments
        5. SWOT Analysis
        6. Key Strategies
      5. Samsung Electronics Co., Ltd.
        1. Company Overview
        2. Financial Overview
        3. Products Offered
        4. Key Developments
        5. SWOT Analysis
        6. Key Strategies
      6. Ocean Nanotech
        1. Company Overview
        2. Financial Overview
        3. Products Offered
        4. Key Developments
        5. SWOT Analysis
        6. Key Strategies
      7. Quantum Materials
        1. Company Overview
        2. Financial Overview
        3. Products Offered
        4. Key Developments
        5. SWOT Analysis
        6. Key Strategies
      8. ALTAIR Nanotechnologies Inc
        1. Company Overview
        2. Financial Overview
        3. Products Offered
        4. Key Developments
        5. SWOT Analysis
        6. Key Strategies
      9. OSRAM Licht AG
        1. Company Overview
        2. Financial Overview
        3. Products Offered
        4. Key Developments
        5. SWOT Analysis
        6. Key Strategies
      10. Nano Elements Source, LLC
        1. Company Overview
        2. Financial Overview
        3. Products Offered
        4. Key Developments
        5. SWOT Analysis
        6. Key Strategies
      11. UbiQD, Inc.
        1. Company Overview
        2. Financial Overview
        3. Products Offered
        4. Key Developments
        5. SWOT Analysis
        6. Key Strategies
      12. LG Display Co., Ltd
        1. Company Overview
        2. Financial Overview
        3. Products Offered
        4. Key Developments
        5. SWOT Analysis
        6. Key Strategies
      13. Navillum Nanotechnologies
        1. Company Overview
        2. Financial Overview
        3. Products Offered
        4. Key Developments
        5. SWOT Analysis
        6. Key Strategies
      14. Crystalplex Corporation
        1. Company Overview
        2. Financial Overview
        3. Products Offered
        4. Key Developments
        5. SWOT Analysis
        6. Key Strategies
      15. Pacific Light technologies
        1. Company Overview
        2. Financial Overview
        3. Products Offered
        4. Key Developments
        5. SWOT Analysis
        6. Key Strategies
    12. List of Tables and Figures
      1. List of Tables
      2. TABLE 1 MARKET SYNOPSIS
      3. TABLE 2 LIST OF ASSUMPTIONS
      4. TABLE 3 GLOBAL QUANTUM DOTS MARKET, BY PRODUCT, 2024-2032 (USD MILLION)
      5. TABLE 4 GLOBAL QUANTUM DOTS MARKET, BY MATERIAL, 2024-2032 (USD MILLION)
      6. TABLE 5 GLOBAL QUANTUM DOTS MARKET, BY VERTICAL, 2024-2032 (USD MILLION)
      7. TABLE 6 GLOBAL QUANTUM DOTS MARKET, BY REGION, 2024-2032 (USD MILLION)
      8. TABLE 7 NORTH AMERICA: QUANTUM DOTS MARKET, BY COUNTRY, 2024-2032 (USD MILLION)
      9. TABLE 8 NORTH AMERICA: QUANTUM DOTS MARKET, BY PRODUCT, 2024-2032 (USD MILLION)
      10. TABLE 9 NORTH AMERICA: QUANTUM DOTS MARKET, BY MATERIAL, 2024-2032 (USD MILLION)
      11. TABLE 10 NORTH AMERICA: QUANTUM DOTS MARKET, BY VERTICAL, 2024-2032 (USD MILLION)
      12. TABLE 11 US: QUANTUM DOTS MARKET, BY PRODUCT, 2024-2032 (USD MILLION)
      13. TABLE 12 US: QUANTUM DOTS MARKET, BY MATERIAL, 2024-2032 (USD MILLION)
      14. TABLE 13 US: QUANTUM DOTS MARKET, BY VERTICAL, 2024-2032 (USD MILLION)
      15. TABLE 14 CANADA: QUANTUM DOTS MARKET, BY PRODUCT, 2024-2032 (USD MILLION)
      16. TABLE 15 CANADA: QUANTUM DOTS MARKET, BY MATERIAL, 2024-2032 (USD MILLION)
      17. TABLE 16 CANADA: QUANTUM DOTS MARKET, BY VERTICAL, 2024-2032 (USD MILLION)
      18. TABLE 17 MEXICO: QUANTUM DOTS MARKET, BY PRODUCT, 2024-2032 (USD MILLION)
      19. TABLE 18 MEXICO: QUANTUM DOTS MARKET, BY MATERIAL, 2024-2032 (USD MILLION)
      20. TABLE 19 MEXICO: QUANTUM DOTS MARKET, BY VERTICAL, 2024-2032 (USD MILLION)
      21. TABLE 20 EUROPE: QUANTUM DOTS MARKET, BY COUNTRY, 2024-2032 (USD MILLION)
      22. TABLE 21 EUROPE: QUANTUM DOTS MARKET, BY PRODUCT, 2024-2032 (USD MILLION)
      23. TABLE 22 EUROPE: QUANTUM DOTS MARKET, BY MATERIAL, 2024-2032 (USD MILLION)
      24. TABLE 23 EUROPE: QUANTUM DOTS MARKET, BY VERTICAL, 2024-2032 (USD MILLION)
      25. TABLE 24 UK: QUANTUM DOTS MARKET, BY PRODUCT, 2024-2032 (USD MILLION)
      26. TABLE 25 UK: QUANTUM DOTS MARKET, BY MATERIAL, 2024-2032 (USD MILLION)
      27. TABLE 26 UK: QUANTUM DOTS MARKET, BY VERTICAL, 2024-2032 (USD MILLION)
      28. TABLE 27 GERMANY: QUANTUM DOTS MARKET, BY PRODUCT, 2024-2032 (USD MILLION)
      29. TABLE 28 GERMANY: QUANTUM DOTS MARKET, BY MATERIAL, 2024-2032 (USD MILLION)
      30. TABLE 29 GERMANY: QUANTUM DOTS MARKET, BY VERTICAL, 2024-2032 (USD MILLION)
      31. TABLE 30 FRANCE: QUANTUM DOTS MARKET, BY PRODUCT, 2024-2032 (USD MILLION)
      32. TABLE 31 FRANCE: QUANTUM DOTS MARKET, BY MATERIAL, 2024-2032 (USD MILLION)
      33. TABLE 32 FRANCE: QUANTUM DOTS MARKET, BY VERTICAL, 2024-2032 (USD MILLION)
      34. TABLE 33 REST OF EUROPE: QUANTUM DOTS MARKET, BY PRODUCT, 2024-2032 (USD MILLION)
      35. TABLE 34 REST OF EUROPE: QUANTUM DOTS MARKET, BY MATERIAL, 2024-2032 (USD MILLION)
      36. TABLE 35 REST OF EUROPE: QUANTUM DOTS MARKET, BY VERTICAL, 2024-2032 (USD MILLION)
      37. TABLE 36 ASIA-PACIFIC: QUANTUM DOTS MARKET, BY COUNTRY, 2024-2032 (USD MILLION)
      38. TABLE 37 ASIA-PACIFIC: QUANTUM DOTS MARKET, BY PRODUCT, 2024-2032 (USD MILLION)
      39. TABLE 38 ASIA-PACIFIC: QUANTUM DOTS MARKET, BY MATERIAL, 2024-2032 (USD MILLION)
      40. TABLE 39 ASIA-PACIFIC: QUANTUM DOTS MARKET, BY VERTICAL, 2024-2032 (USD MILLION)
      41. TABLE 40 CHINA: QUANTUM DOTS MARKET, BY PRODUCT, 2024-2032 (USD MILLION)
      42. TABLE 41 CHINA: QUANTUM DOTS MARKET, BY MATERIAL, 2024-2032 (USD MILLION)
      43. TABLE 42 CHINA: QUANTUM DOTS MARKET, BY VERTICAL, 2024-2032 (USD MILLION)
      44. TABLE 43 JAPAN: QUANTUM DOTS MARKET, BY PRODUCT, 2024-2032 (USD MILLION)
      45. TABLE 44 JAPAN: QUANTUM DOTS MARKET, BY MATERIAL, 2024-2032 (USD MILLION)
      46. TABLE 45 JAPAN: QUANTUM DOTS MARKET, BY VERTICAL, 2024-2032 (USD MILLION)
      47. TABLE 46 INDIA: QUANTUM DOTS MARKET, BY PRODUCT, 2024-2032 (USD MILLION)
      48. TABLE 47 INDIA: QUANTUM DOTS MARKET, BY MATERIAL, 2024-2032 (USD MILLION)
      49. TABLE 48 INDIA: QUANTUM DOTS MARKET, BY VERTICAL, 2024-2032 (USD MILLION)
      50. TABLE 49 SOUTH KOREA: QUANTUM DOTS MARKET, BY PRODUCT, 2024-2032 (USD MILLION)
      51. TABLE 50 SOUTH KOREA: QUANTUM DOTS MARKET, BY MATERIAL, 2024-2032 (USD MILLION)
      52. TABLE 51 SOUTH KOREA: QUANTUM DOTS MARKET, BY VERTICAL, 2024-2032 (USD MILLION)
      53. TABLE 52 REST OF ASIA-PACIFIC: QUANTUM DOTS MARKET, BY PRODUCT, 2024-2032 (USD MILLION)
      54. TABLE 53 REST OF ASIA-PACIFIC: QUANTUM DOTS MARKET, BY MATERIAL, 2024-2032 (USD MILLION)
      55. TABLE 54 REST OF ASIA-PACIFIC: QUANTUM DOTS MARKET, BY VERTICAL, 2024-2032 (USD MILLION)
      56. TABLE 55 REST OF THE WORLD: QUANTUM DOTS MARKET, BY COUNTRY, 2024-2032 (USD MILLION)
      57. TABLE 56 REST OF THE WORLD: QUANTUM DOTS MARKET, BY PRODUCT, 2024-2032 (USD MILLION)
      58. TABLE 57 REST OF THE WORLD: QUANTUM DOTS MARKET, BY MATERIAL, 2024-2032 (USD MILLION)
      59. TABLE 58 REST OF THE WORLD: QUANTUM DOTS MARKET, BY VERTICAL, 2024-2032 (USD MILLION)
      60. TABLE 59 MIDDLE EAST & AFRICA: QUANTUM DOTS MARKET, BY PRODUCT, 2024-2032 (USD MILLION)
      61. TABLE 60 MIDDLE EAST & AFRICA: QUANTUM DOTS MARKET, BY MATERIAL, 2024-2032 (USD MILLION)
      62. TABLE 61 MIDDLE EAST & AFRICA: QUANTUM DOTS MARKET, BY VERTICAL, 2024-2032 (USD MILLION)
      63. TABLE 62 CENTRAL & SOUTH AMERICA: QUANTUM DOTS MARKET, BY PRODUCT, 2024-2032 (USD MILLION)
      64. TABLE 63 CENTRAL & SOUTH AMERICA: QUANTUM DOTS MARKET, BY MATERIAL, 2024-2032 (USD MILLION)
      65. TABLE 64 CENTRAL & SOUTH AMERICA: QUANTUM DOTS MARKET, BY VERTICAL, 2024-2032 (USD MILLION)   List of Figures
      66. FIGURE 1 GLOBAL QUANTUM DOTS MARKET: MARKET STRUCTURE
      67. FIGURE 2 TOP-DOWN & Bottom-up ApproachES
      68. FIGURE 3 MARKET DYNAMICS ANALYSIS OF THE GLOBAL QUANTUM DOTS MARKET
      69. FIGURE 4 VALUE CHAIN ANALYSIS OF THE GLOBAL QUANTUM DOTS MARKET
      70. FIGURE 5 Porter's Five Forces Analysis OF THE GLOBAL QUANTUM DOTS MARKET
      71. FIGURE 6 GLOBAL QUANTUM DOTS MARKET, BY MATERIAL, 2024 VS 2032 (USD MILLION)
      72. FIGURE 7 GLOBAL QUANTUM DOTS MARKET, BY VERTICAL, 2024 VS 2032 (USD MILLION)
      73. FIGURE 8 GLOBAL QUANTUM DOTS MARKET, BY REGION, 2024 VS 2032 (USD MILLION)
      74. FIGURE 9 NORTH AMERICA: QUANTUM DOTS MARKET, BY COUNTRY, 2024 VS 2032 (USD MILLION)
      75. FIGURE 10 NORTH AMERICA: QUANTUM DOTS MARKET, BY MATERIAL, 2024 VS 2032 (USD MILLION)
      76. FIGURE 11 NORTH AMERICA: QUANTUM DOTS MARKET, BY VERTICAL, 2024 VS 2032 (USD MILLION)
      77. FIGURE 12 EUROPE: QUANTUM DOTS MARKET, BY COUNTRY, 2024 VS 2032 (USD MILLION)
      78. FIGURE 13 EUROPE: QUANTUM DOTS MARKET, BY MATERIAL, 2024 VS 2032 (USD MILLION)
      79. FIGURE 14 EUROPE: QUANTUM DOTS MARKET, BY VERTICAL, 2024 VS 2032 (USD MILLION)
      80. FIGURE 15 ASIA-PACIFIC: QUANTUM DOTS MARKET, BY COUNTRY, 2024 VS 2032 (USD MILLION)
      81. FIGURE 16 ASIA-PACIFIC: QUANTUM DOTS MARKET, BY MATERIAL, 2024 VS 2032 (USD MILLION)
      82. FIGURE 17 ASIA-PACIFIC: QUANTUM DOTS MARKET, BY VERTICAL, 2024 VS 2032 (USD MILLION)
      83. FIGURE 18 REST OF THE WORLD: QUANTUM DOTS MARKET, BY COUNTRY, 2024 VS 2032 (USD MILLION)
      84. FIGURE 19 REST OF THE WORLD: QUANTUM DOTS MARKET, BY MATERIAL, 2024 VS 2032 (USD MILLION)
      85. FIGURE 20 REST OF THE WORLD: QUANTUM DOTS MARKET, BY VERTICAL, 2024 VS 2032 (USD MILLION)
      86. FIGURE 21 TOP 10 PLAYERS MARKET SHARE ANALYSIS, BY REVENUE 2020 (%)
      87. FIGURE 25 COMPETITIVE BENCHMARKING

    Quantum Dots Market Segmentation

    Quantum Dots Market Material Outlook (USD Billion, 2019-2032)

    • Cadmium-based
    • Cadmium-free

    Quantum Dots Market Product Outlook (USD Billion, 2019-2032)

    • Displays
    • Other Products
      • Lasers
      • Solar Cells
      • Medical Devices
      • Photodetectors/Sensors
      • Lighting (LED) Products
      • Batteries and Energy Storage Systems
      • Transistors
      • Chips & Tags

    Quantum Dots Market Vertical Outlook (USD Billion, 2019-2032)

    • Consumer
    • Commercial
    • Healthcare
    • Defense
    • Telecommunications
    • Others

    Quantum Dots Market Production Outlook (USD Billion, 2019-2032)

    • Colloidal synthesis
    • Plasma synthesis

    Quantum Dots Market Regional Outlook (USD Billion, 2019-2032)

    • North America Outlook (USD Billion, 2019-2032)

      • North America Quantum Dots Market by Material
        • Cadmium-based
        • Cadmium-free
      • North America Quantum Dots Market by Product
        • Displays
        • Other Products
          • Lasers
          • Solar Cells
          • Medical Devices
          • Photodetectors/Sensors
          • Lighting (LED) Products
          • Batteries and Energy Storage Systems
          • Transistors
          • Chips & Tags
      • North America Quantum Dots Market by Vertical
        • Consumer
        • Commercial
        • Healthcare
        • Defense
        • Telecommunications
        • Others
      • North America Quantum Dots Market by Production
        • Colloidal synthesis
        • Plasma synthesis
      • US Outlook (USD Billion, 2019-2032)

      • US Quantum Dots Market by Material
        • Cadmium-based
        • Cadmium-free
      • US Quantum Dots Market by Product
        • Displays
        • Other Products
          • Lasers
          • Solar Cells
          • Medical Devices
          • Photodetectors/Sensors
          • Lighting (LED) Products
          • Batteries and Energy Storage Systems
          • Transistors
          • Chips & Tags
      • US Quantum Dots Market by Vertical
        • Consumer
        • Commercial
        • Healthcare
        • Defense
        • Telecommunications
        • Others
      • US Quantum Dots Market by Production
        • Colloidal synthesis
        • Plasma synthesis
      • Canada Outlook (USD Billion, 2019-2032)

      • Canada Quantum Dots Market by Material
        • Cadmium-based
        • Cadmium-free
      • Canada Quantum Dots Market by Product
        • Displays
        • Other Products
          • Lasers
          • Solar Cells
          • Medical Devices
          • Photodetectors/Sensors
          • Lighting (LED) Products
          • Batteries and Energy Storage Systems
          • Transistors
          • Chips & Tags
      • Canada Quantum Dots Market by Vertical
        • Consumer
        • Commercial
        • Healthcare
        • Defense
        • Telecommunications
        • Others
      • Canada Quantum Dots Market by Production
        • Colloidal synthesis
        • Plasma synthesis
    • Europe Outlook (USD Billion, 2019-2032)

      • Europe Quantum Dots Market by Material
        • Cadmium-based
        • Cadmium-free
      • Europe Quantum Dots Market by Product
        • Displays
        • Other Products
          • Lasers
          • Solar Cells
          • Medical Devices
          • Photodetectors/Sensors
          • Lighting (LED) Products
          • Batteries and Energy Storage Systems
          • Transistors
          • Chips & Tags
      • Europe Quantum Dots Market by Vertical
        • Consumer
        • Commercial
        • Healthcare
        • Defense
        • Telecommunications
        • Others
      • Europe Quantum Dots Market by Production
        • Colloidal synthesis
        • Plasma synthesis
      • Germany Outlook (USD Billion, 2019-2032)

      • Germany Quantum Dots Market by Material
        • Cadmium-based
        • Cadmium-free
      • Germany Quantum Dots Market by Product
        • Displays
        • Other Products
          • Lasers
          • Solar Cells
          • Medical Devices
          • Photodetectors/Sensors
          • Lighting (LED) Products
          • Batteries and Energy Storage Systems
          • Transistors
          • Chips & Tags
      • Germany Quantum Dots Market by Vertical
        • Consumer
        • Commercial
        • Healthcare
        • Defense
        • Telecommunications
        • Others
      • Germany Quantum Dots Market by Production
        • Colloidal synthesis
        • Plasma synthesis
      • France Outlook (USD Billion, 2019-2032)

      • France Quantum Dots Market by Material
        • Cadmium-based
        • Cadmium-free
      • France Quantum Dots Market by Product
        • Displays
        • Other Products
          • Lasers
          • Solar Cells
          • Medical Devices
          • Photodetectors/Sensors
          • Lighting (LED) Products
          • Batteries and Energy Storage Systems
          • Transistors
          • Chips & Tags
      • France Quantum Dots Market by Vertical
        • Consumer
        • Commercial
        • Healthcare
        • Defense
        • Telecommunications
        • Others
      • France Quantum Dots Market by Production
        • Colloidal synthesis
        • Plasma synthesis
      • UK Outlook (USD Billion, 2019-2032)

      • UK Quantum Dots Market by Material
        • Cadmium-based
        • Cadmium-free
      • UK Quantum Dots Market by Product
        • Displays
        • Other Products
          • Lasers
          • Solar Cells
          • Medical Devices
          • Photodetectors/Sensors
          • Lighting (LED) Products
          • Batteries and Energy Storage Systems
          • Transistors
          • Chips & Tags
      • UK Quantum Dots Market by Vertical
        • Consumer
        • Commercial
        • Healthcare
        • Defense
        • Telecommunications
        • Others
      • UK Quantum Dots Market by Production
        • Colloidal synthesis
        • Plasma synthesis
      • Italy Outlook (USD Billion, 2019-2032)

      • Italy Quantum Dots Market by Material
        • Cadmium-based
        • Cadmium-free
      • Italy Quantum Dots Market by Product
        • Displays
        • Other Products
          • Lasers
          • Solar Cells
          • Medical Devices
          • Photodetectors/Sensors
          • Lighting (LED) Products
          • Batteries and Energy Storage Systems
          • Transistors
          • Chips & Tags
      • Italy Quantum Dots Market by Vertical
        • Consumer
        • Commercial
        • Healthcare
        • Defense
        • Telecommunications
        • Others
      • Italy Quantum Dots Market by Production
        • Colloidal synthesis
        • Plasma synthesis
      • Spain Outlook (USD Billion, 2019-2032)

      • Spain Quantum Dots Market by Material
        • Cadmium-based
        • Cadmium-free
      • Spain Quantum Dots Market by Product
        • Displays
        • Other Products
          • Lasers
          • Solar Cells
          • Medical Devices
          • Photodetectors/Sensors
          • Lighting (LED) Products
          • Batteries and Energy Storage Systems
          • Transistors
          • Chips & Tags
      • Spain Quantum Dots Market by Vertical
        • Consumer
        • Commercial
        • Healthcare
        • Defense
        • Telecommunications
        • Others
      • Spain Quantum Dots Market by Production
        • Colloidal synthesis
        • Plasma synthesis
      • Rest of Europe Outlook (USD Billion, 2019-2032)

      • Rest of Europe Quantum Dots Market by Material
        • Cadmium-based
        • Cadmium-free
      • Rest of Europe Quantum Dots Market by Product
        • Displays
        • Other Products
          • Lasers
          • Solar Cells
          • Medical Devices
          • Photodetectors/Sensors
          • Lighting (LED) Products
          • Batteries and Energy Storage Systems
          • Transistors
          • Chips & Tags
      • Rest of Europe Quantum Dots Market by Vertical
        • Consumer
        • Commercial
        • Healthcare
        • Defense
        • Telecommunications
        • Others
      • Rest of Europe Quantum Dots Market by Production
        • Colloidal synthesis
        • Plasma synthesis
    • Asia-Pacific Outlook (USD Billion, 2019-2032)

      • Asia-Pacific Quantum Dots Market by Material
        • Cadmium-based
        • Cadmium-free
      • Asia-Pacific Quantum Dots Market by Product
        • Displays
        • Other Products
          • Lasers
          • Solar Cells
          • Medical Devices
          • Photodetectors/Sensors
          • Lighting (LED) Products
          • Batteries and Energy Storage Systems
          • Transistors
          • Chips & Tags
      • Asia-Pacific Quantum Dots Market by Vertical
        • Consumer
        • Commercial
        • Healthcare
        • Defense
        • Telecommunications
        • Others
      • Asia-Pacific Quantum Dots Market by Production
        • Colloidal synthesis
        • Plasma synthesis
      • China Outlook (USD Billion, 2019-2032)

      • China Quantum Dots Market by Material
        • Cadmium-based
        • Cadmium-free
      • China Quantum Dots Market by Product
        • Displays
        • Other Products
          • Lasers
          • Solar Cells
          • Medical Devices
          • Photodetectors/Sensors
          • Lighting (LED) Products
          • Batteries and Energy Storage Systems
          • Transistors
          • Chips & Tags
      • China Quantum Dots Market by Vertical
        • Consumer
        • Commercial
        • Healthcare
        • Defense
        • Telecommunications
        • Others
      • China Quantum Dots Market by Production
        • Colloidal synthesis
        • Plasma synthesis
      • Japan Outlook (USD Billion, 2019-2032)

      • Japan Quantum Dots Market by Material
        • Cadmium-based
        • Cadmium-free
      • Japan Quantum Dots Market by Product
        • Displays
        • Other Products
          • Lasers
          • Solar Cells
          • Medical Devices
          • Photodetectors/Sensors
          • Lighting (LED) Products
          • Batteries and Energy Storage Systems
          • Transistors
          • Chips & Tags
    • Japan Quantum Dots Market by Vertical
        • Consumer
        • Commercial
        • Healthcare
        • Defense
        • Telecommunications
        • Others
      • Japan Quantum Dots Market by Production
        • Colloidal synthesis
        • Plasma synthesis
      • India Outlook (USD Billion, 2019-2032)

      • India Quantum Dots Market by Material
        • Cadmium-based
        • Cadmium-free
      • India Quantum Dots Market by Product
        • Displays
        • Other Products
          • Lasers
          • Solar Cells
          • Medical Devices
          • Photodetectors/Sensors
          • Lighting (LED) Products
          • Batteries and Energy Storage Systems
          • Transistors
          • Chips & Tags
      • India Quantum Dots Market by Vertical
        • Consumer
        • Commercial
        • Healthcare
        • Defense
        • Telecommunications
        • Others
      • India Quantum Dots Market by Production
        • Colloidal synthesis
        • Plasma synthesis
      • Australia Outlook (USD Billion, 2019-2032)

      • Australia Quantum Dots Market by Material
        • Cadmium-based
        • Cadmium-free
      • Australia Quantum Dots Market by Product
        • Displays
        • Other Products
          • Lasers
          • Solar Cells
          • Medical Devices
          • Photodetectors/Sensors
          • Lighting (LED) Products
          • Batteries and Energy Storage Systems
          • Transistors
          • Chips & Tags
      • Australia Quantum Dots Market by Vertical
        • Consumer
        • Commercial
        • Healthcare
        • Defense
        • Telecommunications
        • Others
      • Australia Quantum Dots Market by Production
        • Colloidal synthesis
        • Plasma synthesis
      • Rest of Asia-Pacific Outlook (USD Billion, 2019-2032)

      • Rest of Asia-Pacific Quantum Dots Market by Material
        • Cadmium-based
        • Cadmium-free
      • Rest of Asia-Pacific Quantum Dots Market by Product
        • Displays
        • Other Products
          • Lasers
          • Solar Cells
          • Medical Devices
          • Photodetectors/Sensors
          • Lighting (LED) Products
          • Batteries and Energy Storage Systems
          • Transistors
          • Chips & Tags
      • Rest of Asia-Pacific Quantum Dots Market by Vertical
        • Consumer
        • Commercial
        • Healthcare
        • Defense
        • Telecommunications
        • Others
      • Rest of Asia-Pacific Quantum Dots Market by Production
        • Colloidal synthesis
        • Plasma synthesis
    • Rest of the World Outlook (USD Billion, 2019-2032)

      • Rest of the World Quantum Dots Market by Material
        • Cadmium-based
        • Cadmium-free
      • Rest of the World Quantum Dots Market by Product
        • Displays
        • Other Products
          • Lasers
          • Solar Cells
          • Medical Devices
          • Photodetectors/Sensors
          • Lighting (LED) Products
          • Batteries and Energy Storage Systems
          • Transistors
          • Chips & Tags
      • Rest of the World Quantum Dots Market by Vertical
        • Consumer
        • Commercial
        • Healthcare
        • Defense
        • Telecommunications
        • Others
      • Rest of the World Quantum Dots Market by Production
        • Colloidal synthesis
        • Plasma synthesis
      • Middle East Outlook (USD Billion, 2019-2032)

      • Middle East Quantum Dots Market by Material
        • Cadmium-based
        • Cadmium-free
      • Middle East Quantum Dots Market by Product
        • Displays
        • Other Products
          • Lasers
          • Solar Cells
          • Medical Devices
          • Photodetectors/Sensors
          • Lighting (LED) Products
          • Batteries and Energy Storage Systems
          • Transistors
          • Chips & Tags
      • Middle East Quantum Dots Market by Vertical
        • Consumer
        • Commercial
        • Healthcare
        • Defense
        • Telecommunications
        • Others
      • Middle East Quantum Dots Market by Production
        • Colloidal synthesis
        • Plasma synthesis
        • Non-Store-Based
      • Africa Outlook (USD Billion, 2019-2032)

      • Africa Quantum Dots Market by Material
        • Cadmium-based
        • Cadmium-free
      • Africa Quantum Dots Market by Product
        • Displays
        • Other Products
          • Lasers
          • Solar Cells
          • Medical Devices
          • Photodetectors/Sensors
          • Lighting (LED) Products
          • Batteries and Energy Storage Systems
          • Transistors
          • Chips & Tags
      • Africa Quantum Dots Market by Vertical
        • Consumer
        • Commercial
        • Healthcare
        • Defense
        • Telecommunications
        • Others
      • Africa Quantum Dots Market by Production
        • Colloidal synthesis
        • Plasma synthesis
      • Latin America Outlook (USD Billion, 2019-2032)

      • Latin America Quantum Dots Market by Material
        • Cadmium-based
        • Cadmium-free
      • Latin America Quantum Dots Market by Product
        • Displays
        • Other Products
          • Lasers
          • Solar Cells
          • Medical Devices
          • Photodetectors/Sensors
          • Lighting (LED) Products
          • Batteries and Energy Storage Systems
          • Transistors
          • Chips & Tags
      • Latin America Quantum Dots Market by Vertical
        • Consumer
        • Commercial
        • Healthcare
        • Defense
        • Telecommunications
        • Others
      • Latin America Quantum Dots Market by Production
        • Colloidal synthesis
        • Plasma synthesis
    Infographic

    Free Sample Request

    Kindly complete the form below to receive a free sample of this Report

    Get Free Sample

    Customer Strories

    “I am very pleased with how market segments have been defined in a relevant way for my purposes (such as "Portable Freezers & refrigerators" and "last-mile"). In general the report is well structured. Thanks very much for your efforts.”

    Victoria Milne

    Founder
    Case Study
    Chemicals and Materials