Certified Global Research Member
Isomar fd.webp Wcrc 57.webp
Key Questions Answered
  • Global Market Outlook
  • In-depth analysis of global and regional trends
  • Analyze and identify the major players in the market, their market share, key developments, etc.
  • To understand the capability of the major players based on products offered, financials, and strategies.
  • Identify disrupting products, companies, and trends.
  • To identify opportunities in the market.
  • Analyze the key challenges in the market.
  • Analyze the regional penetration of players, products, and services in the market.
  • Comparison of major playersโ€™ financial performance.
  • Evaluate strategies adopted by major players.
  • Recommendations
Why Choose Market Research Future?
  • Vigorous research methodologies for specific market.
  • Knowledge partners across the globe
  • Large network of partner consultants.
  • Ever-increasing/ Escalating data base with quarterly monitoring of various markets
  • Trusted by fortune 500 companies/startups/ universities/organizations
  • Large database of 5000+ markets reports.
  • Effective and prompt pre- and post-sales support.

Quantum Dots Market Research Report Information By Material (Cadmium-based and Cadmium-free), By Product (Displays, Other Products (Lasers, Solar Cells, Medical Devices, Photodetectors/Sensors, Lighting (LED) Product, Batteries and Energy Storage Systems, Transistors, and Chips & Tags)), By Vertical (Consumer, Commercial, Healthcare, Defense, Telecommunications, Others), By Production (Colloidal Synthesis, & Plasma Synthesis), and By Region (North America, Europe, Asia-Pacific & Rest Of The World)โ€“ Industry Size, Share and Forecast 2032


ID: MRFR/SEM/7236-HCR | 111 Pages | Author: Aarti Dhapte| April 2024

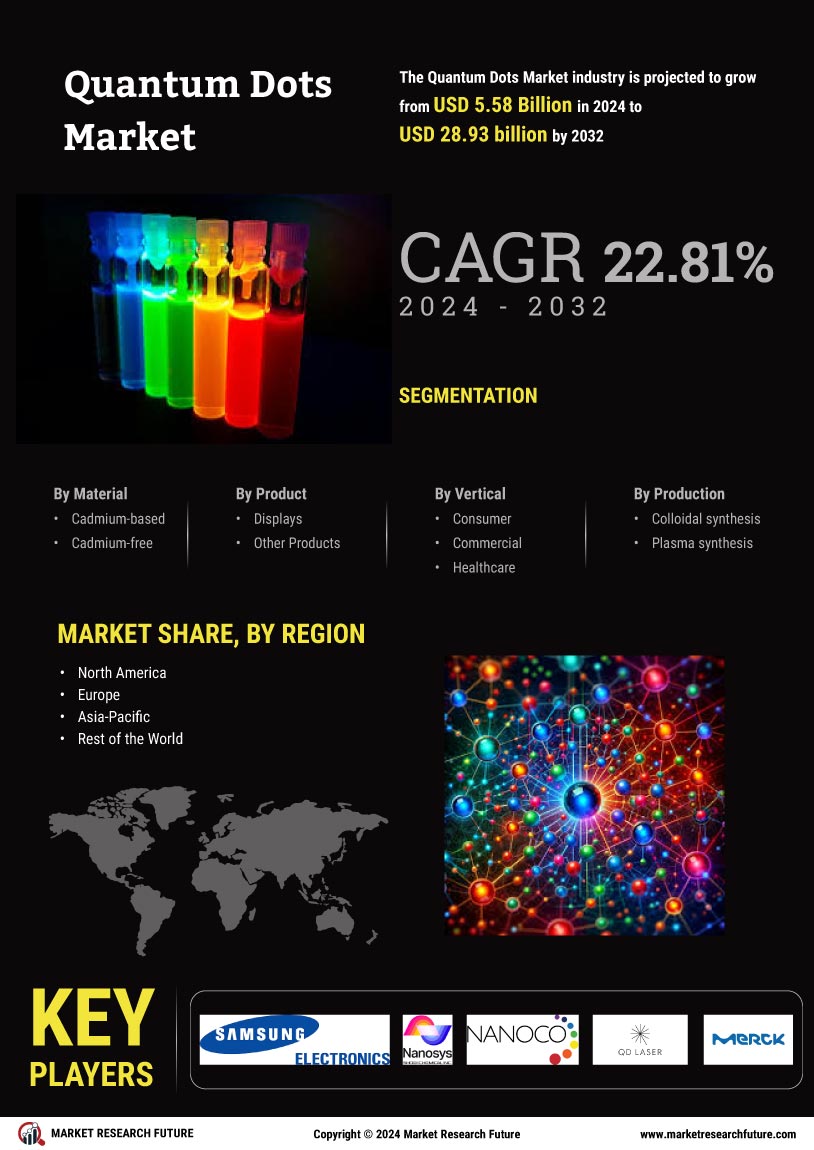
Quantum Dots Market Segmentation


Quantum Dots Market Material Outlook (USD Billion, 2019-2032)


  • Cadmium-based


  • Cadmium-free


Quantum Dots Market Product Outlook (USD Billion, 2019-2032)


  • Displays


  • Other Products


    • Lasers


    • Solar Cells


    • Medical Devices


    • Photodetectors/Sensors


    • Lighting (LED) Products


    • Batteries and Energy Storage Systems


    • Transistors


    • Chips & Tags


Quantum Dots Market Vertical Outlook (USD Billion, 2019-2032)


  • Consumer


  • Commercial


  • Healthcare


  • Defense


  • Telecommunications


  • Others


Quantum Dots Market Production Outlook (USD Billion, 2019-2032)


  • Colloidal synthesis


  • Plasma synthesis


Quantum Dots Market Regional Outlook (USD Billion, 2019-2032)


  • North America Outlook (USD Billion, 2019-2032)


    • North America Quantum Dots Market by Material


      • Cadmium-based


      • Cadmium-free


    • North America Quantum Dots Market by Product


      • Displays


      • Other Products


        • Lasers


        • Solar Cells


        • Medical Devices


        • Photodetectors/Sensors


        • Lighting (LED) Products


        • Batteries and Energy Storage Systems


        • Transistors


        • Chips & Tags


    • North America Quantum Dots Market by Vertical


      • Consumer


      • Commercial


      • Healthcare


      • Defense


      • Telecommunications


      • Others


    • North America Quantum Dots Market by Production


      • Colloidal synthesis


      • Plasma synthesis


    • US Outlook (USD Billion, 2019-2032)


    • US Quantum Dots Market by Material


      • Cadmium-based


      • Cadmium-free


    • US Quantum Dots Market by Product


      • Displays


      • Other Products


        • Lasers


        • Solar Cells


        • Medical Devices


        • Photodetectors/Sensors


        • Lighting (LED) Products


        • Batteries and Energy Storage Systems


        • Transistors


        • Chips & Tags


    • US Quantum Dots Market by Vertical


      • Consumer


      • Commercial


      • Healthcare


      • Defense


      • Telecommunications


      • Others


    • US Quantum Dots Market by Production


      • Colloidal synthesis


      • Plasma synthesis


    • Canada Outlook (USD Billion, 2019-2032)


    • Canada Quantum Dots Market by Material


      • Cadmium-based


      • Cadmium-free


    • Canada Quantum Dots Market by Product


      • Displays


      • Other Products


        • Lasers


        • Solar Cells


        • Medical Devices


        • Photodetectors/Sensors


        • Lighting (LED) Products


        • Batteries and Energy Storage Systems


        • Transistors


        • Chips & Tags


    • Canada Quantum Dots Market by Vertical


      • Consumer


      • Commercial


      • Healthcare


      • Defense


      • Telecommunications


      • Others


    • Canada Quantum Dots Market by Production


      • Colloidal synthesis


      • Plasma synthesis


  • Europe Outlook (USD Billion, 2019-2032)


    • Europe Quantum Dots Market by Material


      • Cadmium-based


      • Cadmium-free


    • Europe Quantum Dots Market by Product


      • Displays


      • Other Products


        • Lasers


        • Solar Cells


        • Medical Devices


        • Photodetectors/Sensors


        • Lighting (LED) Products


        • Batteries and Energy Storage Systems


        • Transistors


        • Chips & Tags


    • Europe Quantum Dots Market by Vertical


      • Consumer


      • Commercial


      • Healthcare


      • Defense


      • Telecommunications


      • Others


    • Europe Quantum Dots Market by Production


      • Colloidal synthesis


      • Plasma synthesis


    • Germany Outlook (USD Billion, 2019-2032)


    • Germany Quantum Dots Market by Material


      • Cadmium-based


      • Cadmium-free


    • Germany Quantum Dots Market by Product


      • Displays


      • Other Products


        • Lasers


        • Solar Cells


        • Medical Devices


        • Photodetectors/Sensors


        • Lighting (LED) Products


        • Batteries and Energy Storage Systems


        • Transistors


        • Chips & Tags


    • Germany Quantum Dots Market by Vertical


      • Consumer


      • Commercial


      • Healthcare


      • Defense


      • Telecommunications


      • Others


    • Germany Quantum Dots Market by Production


      • Colloidal synthesis


      • Plasma synthesis


    • France Outlook (USD Billion, 2019-2032)


    • France Quantum Dots Market by Material


      • Cadmium-based


      • Cadmium-free


    • France Quantum Dots Market by Product


      • Displays


      • Other Products


        • Lasers


        • Solar Cells


        • Medical Devices


        • Photodetectors/Sensors


        • Lighting (LED) Products


        • Batteries and Energy Storage Systems


        • Transistors


        • Chips & Tags


    • France Quantum Dots Market by Vertical


      • Consumer


      • Commercial


      • Healthcare


      • Defense


      • Telecommunications


      • Others


    • France Quantum Dots Market by Production


      • Colloidal synthesis


      • Plasma synthesis


    • UK Outlook (USD Billion, 2019-2032)


    • UK Quantum Dots Market by Material


      • Cadmium-based


      • Cadmium-free


    • UK Quantum Dots Market by Product


      • Displays


      • Other Products


        • Lasers


        • Solar Cells


        • Medical Devices


        • Photodetectors/Sensors


        • Lighting (LED) Products


        • Batteries and Energy Storage Systems


        • Transistors


        • Chips & Tags


    • UK Quantum Dots Market by Vertical


      • Consumer


      • Commercial


      • Healthcare


      • Defense


      • Telecommunications


      • Others


    • UK Quantum Dots Market by Production


      • Colloidal synthesis


      • Plasma synthesis


    • Italy Outlook (USD Billion, 2019-2032)


    • Italy Quantum Dots Market by Material


      • Cadmium-based


      • Cadmium-free


    • Italy Quantum Dots Market by Product


      • Displays


      • Other Products


        • Lasers


        • Solar Cells


        • Medical Devices


        • Photodetectors/Sensors


        • Lighting (LED) Products


        • Batteries and Energy Storage Systems


        • Transistors


        • Chips & Tags


    • Italy Quantum Dots Market by Vertical


      • Consumer


      • Commercial


      • Healthcare


      • Defense


      • Telecommunications


      • Others


    • Italy Quantum Dots Market by Production


      • Colloidal synthesis


      • Plasma synthesis


    • Spain Outlook (USD Billion, 2019-2032)


    • Spain Quantum Dots Market by Material


      • Cadmium-based


      • Cadmium-free


    • Spain Quantum Dots Market by Product


      • Displays


      • Other Products


        • Lasers


        • Solar Cells


        • Medical Devices


        • Photodetectors/Sensors


        • Lighting (LED) Products


        • Batteries and Energy Storage Systems


        • Transistors


        • Chips & Tags


    • Spain Quantum Dots Market by Vertical


      • Consumer


      • Commercial


      • Healthcare


      • Defense


      • Telecommunications


      • Others


    • Spain Quantum Dots Market by Production


      • Colloidal synthesis


      • Plasma synthesis


    • Rest of Europe Outlook (USD Billion, 2019-2032)


    • Rest of Europe Quantum Dots Market by Material


      • Cadmium-based


      • Cadmium-free


    • Rest of Europe Quantum Dots Market by Product


      • Displays


      • Other Products


        • Lasers


        • Solar Cells


        • Medical Devices


        • Photodetectors/Sensors


        • Lighting (LED) Products


        • Batteries and Energy Storage Systems


        • Transistors


        • Chips & Tags


    • Rest of Europe Quantum Dots Market by Vertical


      • Consumer


      • Commercial


      • Healthcare


      • Defense


      • Telecommunications


      • Others


    • Rest of Europe Quantum Dots Market by Production


      • Colloidal synthesis


      • Plasma synthesis


  • Asia-Pacific Outlook (USD Billion, 2019-2032)


    • Asia-Pacific Quantum Dots Market by Material


      • Cadmium-based


      • Cadmium-free


    • Asia-Pacific Quantum Dots Market by Product


      • Displays


      • Other Products


        • Lasers


        • Solar Cells


        • Medical Devices


        • Photodetectors/Sensors


        • Lighting (LED) Products


        • Batteries and Energy Storage Systems


        • Transistors


        • Chips & Tags


    • Asia-Pacific Quantum Dots Market by Vertical


      • Consumer


      • Commercial


      • Healthcare


      • Defense


      • Telecommunications


      • Others


    • Asia-Pacific Quantum Dots Market by Production


      • Colloidal synthesis


      • Plasma synthesis


    • China Outlook (USD Billion, 2019-2032)


    • China Quantum Dots Market by Material


      • Cadmium-based


      • Cadmium-free


    • China Quantum Dots Market by Product


      • Displays


      • Other Products


        • Lasers


        • Solar Cells


        • Medical Devices


        • Photodetectors/Sensors


        • Lighting (LED) Products


        • Batteries and Energy Storage Systems


        • Transistors


        • Chips & Tags


    • China Quantum Dots Market by Vertical


      • Consumer


      • Commercial


      • Healthcare


      • Defense


      • Telecommunications


      • Others


    • China Quantum Dots Market by Production


      • Colloidal synthesis


      • Plasma synthesis


    • Japan Outlook (USD Billion, 2019-2032)


    • Japan Quantum Dots Market by Material


      • Cadmium-based


      • Cadmium-free


    • Japan Quantum Dots Market by Product


      • Displays


      • Other Products


        • Lasers


        • Solar Cells


        • Medical Devices


        • Photodetectors/Sensors


        • Lighting (LED) Products


        • Batteries and Energy Storage Systems


        • Transistors


        • Chips & Tags


  • Japan Quantum Dots Market by Vertical


      • Consumer


      • Commercial


      • Healthcare


      • Defense


      • Telecommunications


      • Others


    • Japan Quantum Dots Market by Production


      • Colloidal synthesis


      • Plasma synthesis


    • India Outlook (USD Billion, 2019-2032)


    • India Quantum Dots Market by Material


      • Cadmium-based


      • Cadmium-free


    • India Quantum Dots Market by Product


      • Displays


      • Other Products


        • Lasers


        • Solar Cells


        • Medical Devices


        • Photodetectors/Sensors


        • Lighting (LED) Products


        • Batteries and Energy Storage Systems


        • Transistors


        • Chips & Tags


    • India Quantum Dots Market by Vertical


      • Consumer


      • Commercial


      • Healthcare


      • Defense


      • Telecommunications


      • Others


    • India Quantum Dots Market by Production


      • Colloidal synthesis


      • Plasma synthesis


    • Australia Outlook (USD Billion, 2019-2032)


    • Australia Quantum Dots Market by Material


      • Cadmium-based


      • Cadmium-free


    • Australia Quantum Dots Market by Product


      • Displays


      • Other Products


        • Lasers


        • Solar Cells


        • Medical Devices


        • Photodetectors/Sensors


        • Lighting (LED) Products


        • Batteries and Energy Storage Systems


        • Transistors


        • Chips & Tags


    • Australia Quantum Dots Market by Vertical


      • Consumer


      • Commercial


      • Healthcare


      • Defense


      • Telecommunications


      • Others


    • Australia Quantum Dots Market by Production


      • Colloidal synthesis


      • Plasma synthesis


    • Rest of Asia-Pacific Outlook (USD Billion, 2019-2032)


    • Rest of Asia-Pacific Quantum Dots Market by Material


      • Cadmium-based


      • Cadmium-free


    • Rest of Asia-Pacific Quantum Dots Market by Product


      • Displays


      • Other Products


        • Lasers


        • Solar Cells


        • Medical Devices


        • Photodetectors/Sensors


        • Lighting (LED) Products


        • Batteries and Energy Storage Systems


        • Transistors


        • Chips & Tags


    • Rest of Asia-Pacific Quantum Dots Market by Vertical


      • Consumer


      • Commercial


      • Healthcare


      • Defense


      • Telecommunications


      • Others


    • Rest of Asia-Pacific Quantum Dots Market by Production


      • Colloidal synthesis


      • Plasma synthesis


  • Rest of the World Outlook (USD Billion, 2019-2032)


    • Rest of the World Quantum Dots Market by Material


      • Cadmium-based


      • Cadmium-free


    • Rest of the World Quantum Dots Market by Product


      • Displays


      • Other Products


        • Lasers


        • Solar Cells


        • Medical Devices


        • Photodetectors/Sensors


        • Lighting (LED) Products


        • Batteries and Energy Storage Systems


        • Transistors


        • Chips & Tags


    • Rest of the World Quantum Dots Market by Vertical


      • Consumer


      • Commercial


      • Healthcare


      • Defense


      • Telecommunications


      • Others


    • Rest of the World Quantum Dots Market by Production


      • Colloidal synthesis


      • Plasma synthesis


    • Middle East Outlook (USD Billion, 2019-2032)


    • Middle East Quantum Dots Market by Material


      • Cadmium-based


      • Cadmium-free


    • Middle East Quantum Dots Market by Product


      • Displays


      • Other Products


        • Lasers


        • Solar Cells


        • Medical Devices


        • Photodetectors/Sensors


        • Lighting (LED) Products


        • Batteries and Energy Storage Systems


        • Transistors


        • Chips & Tags


    • Middle East Quantum Dots Market by Vertical


      • Consumer


      • Commercial


      • Healthcare


      • Defense


      • Telecommunications


      • Others


    • Middle East Quantum Dots Market by Production


      • Colloidal synthesis


      • Plasma synthesis


      • Non-Store-Based


    • Africa Outlook (USD Billion, 2019-2032)


    • Africa Quantum Dots Market by Material


      • Cadmium-based


      • Cadmium-free


    • Africa Quantum Dots Market by Product


      • Displays


      • Other Products


        • Lasers


        • Solar Cells


        • Medical Devices


        • Photodetectors/Sensors


        • Lighting (LED) Products


        • Batteries and Energy Storage Systems


        • Transistors


        • Chips & Tags


    • Africa Quantum Dots Market by Vertical


      • Consumer


      • Commercial


      • Healthcare


      • Defense


      • Telecommunications


      • Others


    • Africa Quantum Dots Market by Production


      • Colloidal synthesis


      • Plasma synthesis


    • Latin America Outlook (USD Billion, 2019-2032)


    • Latin America Quantum Dots Market by Material


      • Cadmium-based


      • Cadmium-free


    • Latin America Quantum Dots Market by Product


      • Displays


      • Other Products


        • Lasers


        • Solar Cells


        • Medical Devices


        • Photodetectors/Sensors


        • Lighting (LED) Products


        • Batteries and Energy Storage Systems


        • Transistors


        • Chips & Tags


    • Latin America Quantum Dots Market by Vertical


      • Consumer


      • Commercial


      • Healthcare


      • Defense


      • Telecommunications


      • Others


    • Latin America Quantum Dots Market by Production


      • Colloidal synthesis


      • Plasma synthesis


Research Methodology on Quantum Dots Market


Introduction


Quantum dots (QD) are semiconductors that are made up of nanometer-scale particles. QD can be used in a variety of fields like displays, biomedicine, materials science and photovoltaic devices. The purpose of this research is to investigate the current and future trends of the QD market. Specifically, the study will be focusing on the size, market share, raw materials pricing, and global partnerships associated with the QD market. To provide comprehensive (useful) data for the study, a comprehensive research methodology will be adopted.


Research Design


The research will be conducted through a qualitative and quantitative approach which will involve both primary and secondary methods. The qualitative approach will focus on the identification of barriers, obstacles and trends related to QD development. The quantitative approach involves the collection of statistics and data from the QD market to evaluate the overall market performance and the effect of different segments.


Sampling


The target sample for the research consists of manufacturers, suppliers, investors, research scholars, and government representatives. This sample is selected using a reputed market survey software, Qualtrics. The questionnaire is sent out to a list of targeted respondents and completion of the survey will be considered voluntary.


Data Collection Methods


To obtain the economic and pricing trends of the QD market, secondary data from publicly available resources such as trade journals, magazines, industry reports, and online databases are utilized. For the qualitative component, primary data are collected through online surveys, interviews and focus group discussions with experts in the QD industry. Furthermore, observation of the current industry trends and analysis of literature related to QD technology is conducted.


Data Analysis


The collected data is analysed both quantitatively and qualitatively. The quantitative data analysis involves descriptive analysis of the collected statistics, while the qualitative data will be analysed by applying thematic analysis. The analysis is centred on exploring market segments, customers, trends and technology advancements to gain better insights into the QD market.


Research Validity


Validity is the process of ensuring that research results are accurate and meaningful for decision-making. As such, the data gathered from the research will be validated by conducting cross-checking with other sources and by analyzing whether the results generated from the research coincide with reality.


Conclusion


In conclusion, this research aims to identify the current and future trends of the quantum dots market and forecast from 2023 to 2030. To achieve this objective, a comprehensive research methodology has been outlined, which involves the use of both primary and secondary approaches and the application of quantitative and qualitative techniques. Nevertheless, it is important to take into consideration the practical limitations of the research, including resource, budget and time constraints to maximize the accuracy of the results.

Leading companies partner with us for data-driven Insights
client_1 client_2 client_3 client_4 client_5 client_6 client_7 client_8 client_9 client_10
Please fill in Business Email for Quick Response

1. EXECUTIVE SUMMARY

1.1. Market Attractiveness Analysis

1.1.1. Global Quantum Dots Market, by Product

1.1.2. Global Quantum Dots Market, by Material

1.1.3. Global Quantum Dots Market, by Vertical

1.1.4. Global Quantum Dots Market, by Region

2. MARKET INTRODUCTION

2.1. Definition

2.2. Scope of the Study

2.3. Market Structure

2.4. Key Buying Criteria

2.5. Macro Factor Indicator Analysis

3. RESEARCH METHODOLOGY

3.1. Research Process

3.2. Primary Research

3.3. Secondary Research

3.4. Market Size Estimation

3.5. Forecast Model

3.6. List of Assumptions

4. MARKET DYNAMICS

4.1. Introduction

4.2. Drivers

4.3. Restraints

4.4. Opportunities

4.5. Challenges

5. MARKET FACTOR ANALYSIS

5.1. Value Chain Analysis/Supply Chain Analysis

5.2. Porterโ€™s Five Forces Model

5.2.1. Bargaining Power of Suppliers

5.2.2. Bargaining Power of Buyers

5.2.3. Threat of New Entrants

5.2.4. Threat of Substitutes

5.2.5. Intensity of Rivalry

6. GLOBAL QUANTUM DOTS MARKET, BY PRODUCT

6.1. Introduction

6.2. Displays

6.2.1. Market Estimates & Forecast, 2020โ€”2027

6.3. Solar Cells

6.3.1. Market Estimates & Forecast, 2020โ€”2027

6.4. Photodetectors

6.4.1. Market Estimates & Forecast, 2020โ€”2027

6.5. Lasers

6.5.1. Market Estimates & Forecast, 2020โ€”2027

6.6. LED

6.6.1. Market Estimates & Forecast, 2020โ€”2027

6.7. Transistors

6.7.1. Market Estimates & Forecast, 2020โ€”2027

6.8. Others

6.8.1. Market Estimates & Forecast, 2020โ€”2027

7. GLOBAL QUANTUM DOTS MARKET, BY MATERIAL

7.1. Introduction

7.2. Cadmium Selenide

7.2.1. Market Estimates & Forecast, 2020โ€”2027

7.3. Cadmium Sulfide

7.3.1. Market Estimates & Forecast, 2020โ€”2027

7.4. Cadmium Telluride

7.4.1. Market Estimates & Forecast, 2020โ€”2027

7.5. Zinc sulfide

7.5.1. Market Estimates & Forecast, 2020โ€”2027

7.6. Indium

7.6.1. Market Estimates & Forecast, 2020โ€”2027

7.7. Silicon

7.7.1. Market Estimates & Forecast, 2020โ€”2027

7.8. Others

7.8.1. Market Estimates & Forecast, 2020โ€”2027

8. GLOBAL QUANTUM DOTS MARKET, BY VERTICAL

8.1. Introduction

8.2. Consumer

8.2.1. Market Estimates & Forecast, 2020โ€”2027

8.3. Telecommunication

8.3.1. Market Estimates & Forecast, 2020โ€”2027

8.4. Commercial

8.4.1. Market Estimates & Forecast, 2020โ€”2027

8.5. Healthcare

8.5.1. Market Estimates & Forecast, 2020โ€”2027

8.6. Defense

8.6.1. Market Estimates & Forecast, 2020โ€”2027

8.7. Others

8.7.1. Market Estimates & Forecast, 2020โ€”2027

9. GLOBAL QUANTUM DOTS MARKET, BY REGION

9.1. Introduction

9.2. North America

9.2.1. Market Estimates & Forecast, by Product, 2020โ€”2027

9.2.2. Market Estimates & Forecast, by Material, 2020โ€”2027

9.2.3. Market Estimates & Forecast, by Vertical, 2020โ€”2027

9.2.4. Market Estimates & Forecast, by Country, 2020โ€”2027

9.2.4.1. US

9.2.4.1.1. Market Estimates & Forecast, by Product, 2020โ€”2027

9.2.4.1.2. Market Estimates & Forecast, by Material, 2020โ€”2027

9.2.4.1.3. Market Estimates & Forecast, by Vertical, 2020โ€”2027

9.2.4.2. Canada

9.2.4.2.1. Market Estimates & Forecast, by Product, 2020โ€”2027

9.2.4.2.2. Market Estimates & Forecast, by Material, 2020โ€”2027

9.2.4.2.3. Market Estimates & Forecast, by Vertical, 2020โ€”2027

9.2.4.3. Mexico

9.2.4.3.1. Market Estimates & Forecast, by Product, 2020โ€”2027

9.2.4.3.2. Market Estimates & Forecast, by Material, 2020โ€”2027

9.2.4.3.3. Market Estimates & Forecast, by Vertical, 2020โ€”2027

9.3. Europe

9.3.1. Market Estimates & Forecast, by Product, 2020โ€”2027

9.3.2. Market Estimates & Forecast, by Material, 2020โ€”2027

9.3.3. Market Estimates & Forecast, by Vertical, 2020โ€”2027

9.3.4. Market Estimates & Forecast, by Country, 2020โ€”2027

9.3.4.1. Germany

9.3.4.1.1. Market Estimates & Forecast, by Product, 2020โ€”2027

9.3.4.1.2. Market Estimates & Forecast, by Material, 2020โ€”2027

9.3.4.1.3. Market Estimates & Forecast, by Vertical, 2020โ€”2027

9.3.4.2. France

9.3.4.2.1. Market Estimates & Forecast, by Product, 2020โ€”2027

9.3.4.2.2. Market Estimates & Forecast, by Material, 2020โ€”2027

9.3.4.2.3. Market Estimates & Forecast, by Vertical, 2020โ€”2027

9.3.4.3. UK

9.3.4.3.1. Market Estimates & Forecast, by Product, 2020โ€”2027

9.3.4.3.2. Market Estimates & Forecast, by Material, 2020โ€”2027

9.3.4.3.3. Market Estimates & Forecast, by Vertical, 2020โ€”2027

9.3.4.4. Netherland

9.3.4.4.1. Market Estimates & Forecast, by Product, 2020โ€”2027

9.3.4.4.2. Market Estimates & Forecast, by Material, 2020โ€”2027

9.3.4.4.3. Market Estimates & Forecast, by Vertical, 2020โ€”2027

9.3.4.5. Rest of Europe

9.3.4.5.1. Market Estimates & Forecast, by Product, 2020โ€”2027

9.3.4.5.2. Market Estimates & Forecast, by Material, 2020โ€”2027

9.3.4.5.3. Market Estimates & Forecast, by Vertical, 2020โ€”2027

9.4. Asia-Pacific

9.4.1. Market Estimates & Forecast, by Product, 2020โ€”2027

9.4.2. Market Estimates & Forecast, by Material, 2020โ€”2027

9.4.3. Market Estimates & Forecast, by Vertical, 2020โ€”2027

9.4.4. Market Estimates & Forecast, by Country, 2020โ€”2027

9.4.5. China

9.4.5.1. Market Estimates & Forecast, by Product, 2020โ€”2027

9.4.5.2. Market Estimates & Forecast, by Material, 2020โ€”2027

9.4.5.3. Market Estimates & Forecast, by Vertical, 2020โ€”2027

9.4.6. India

9.4.6.1. Market Estimates & Forecast, by Product, 2020โ€”2027

9.4.6.2. Market Estimates & Forecast, by Material, 2020โ€”2027

9.4.6.3. Market Estimates & Forecast, by Vertical, 2020โ€”2027

9.4.7. Japan

9.4.7.1. Market Estimates & Forecast, by Product, 2020โ€”2027

9.4.7.2. Market Estimates & Forecast, by Material, 2020โ€”2027

9.4.7.3. Market Estimates & Forecast, by Vertical, 2020โ€”2027

9.4.8. South Korea

9.4.8.1. Market Estimates & Forecast, by Product, 2020โ€”2027

9.4.8.2. Market Estimates & Forecast, by Material, 2020โ€”2027

9.4.8.3. Market Estimates & Forecast, by Vertical, 2020โ€”2027

9.4.9. Rest of Asia-Pacific

9.4.9.1. Market Estimates & Forecast, by Product, 2020โ€”2027

9.4.9.2. Market Estimates & Forecast, by Material, 2020โ€”2027

9.4.9.3. Market Estimates & Forecast, by Vertical, 2020โ€”2027

9.5. Rest of the World

9.5.1. Market Estimates & Forecast, by Product, 2020โ€”2027

9.5.2. Market Estimates & Forecast, by Material, 2020โ€”2027

9.5.3. Market Estimates & Forecast, by Vertical, 2020โ€”2027

9.5.4. Market Estimates & Forecast, by Region, 2020โ€”2027

9.5.5. Middle East & Africa

9.5.5.1. Market Estimates & Forecast, by Product, 2020โ€”2027

9.5.5.2. Market Estimates & Forecast, by Material, 2020โ€”2027

9.5.5.3. Market Estimates & Forecast, by Vertical, 2020โ€”2027

9.5.6. Central & South America

9.5.6.1. Market Estimates & Forecast, by Product, 2020โ€”2027

9.5.6.2. Market Estimates & Forecast, by Material, 2020โ€”2027

9.5.6.3. Market Estimates & Forecast, by Vertical, 2020โ€”2027

10. COMPETITIVE LANDSCAPE

10.1. Introduction

10.2. Competitive Analysis

11. COMPANY PROFILES

11.1. Nanoco Group

11.1.1. Company Overview

11.1.2. Financial Overview

11.1.3. Products Offered

11.1.4. Key Developments

11.1.5. SWOT Analysis

11.1.6. Key Strategies

11.2. Nanosys, Inc.

11.2.1. Company Overview

11.2.2. Financial Overview

11.2.3. Products Offered

11.2.4. Key Developments

11.2.5. SWOT Analysis

11.2.6. Key Strategies

11.3. QD Vision

11.3.1. Company Overview

11.3.2. Financial Overview

11.3.3. Products Offered

11.3.4. Key Developments

11.3.5. SWOT Analysis

11.3.6. Key Strategies

11.4. NN-Labs

11.4.1. Company Overview

11.4.2. Financial Overview

11.4.3. Products Offered

11.4.4. Key Developments

11.4.5. SWOT Analysis

11.4.6. Key Strategies

11.5. Samsung Electronics Co., Ltd.

11.5.1. Company Overview

11.5.2. Financial Overview

11.5.3. Products Offered

11.5.4. Key Developments

11.5.5. SWOT Analysis

11.5.6. Key Strategies

11.6. Ocean Nanotech

11.6.1. Company Overview

11.6.2. Financial Overview

11.6.3. Products Offered

11.6.4. Key Developments

11.6.5. SWOT Analysis

11.6.6. Key Strategies

11.7. Quantum Materials

11.7.1. Company Overview

11.7.2. Financial Overview

11.7.3. Products Offered

11.7.4. Key Developments

11.7.5. SWOT Analysis

11.7.6. Key Strategies

11.8. ALTAIR Nanotechnologies Inc

11.8.1. Company Overview

11.8.2. Financial Overview

11.8.3. Products Offered

11.8.4. Key Developments

11.8.5. SWOT Analysis

11.8.6. Key Strategies

11.9. OSRAM Licht AG

11.9.1. Company Overview

11.9.2. Financial Overview

11.9.3. Products Offered

11.9.4. Key Developments

11.9.5. SWOT Analysis

11.9.6. Key Strategies

11.10. Nano Elements Source, LLC

11.10.1. Company Overview

11.10.2. Financial Overview

11.10.3. Products Offered

11.10.4. Key Developments

11.10.5. SWOT Analysis

11.10.6. Key Strategies

11.11. UbiQD, Inc.

11.11.1. Company Overview

11.11.2. Financial Overview

11.11.3. Products Offered

11.11.4. Key Developments

11.11.5. SWOT Analysis

11.11.6. Key Strategies

11.12. LG Display Co., Ltd

11.12.1. Company Overview

11.12.2. Financial Overview

11.12.3. Products Offered

11.12.4. Key Developments

11.12.5. SWOT Analysis

11.12.6. Key Strategies

11.13. Navillum Nanotechnologies

11.13.1. Company Overview

11.13.2. Financial Overview

11.13.3. Products Offered

11.13.4. Key Developments

11.13.5. SWOT Analysis

11.13.6. Key Strategies

11.14. Crystalplex Corporation

11.14.1. Company Overview

11.14.2. Financial Overview

11.14.3. Products Offered

11.14.4. Key Developments

11.14.5. SWOT Analysis

11.14.6. Key Strategies

11.15. Pacific Light technologies

11.15.1. Company Overview

11.15.2. Financial Overview

11.15.3. Products Offered

11.15.4. Key Developments

11.15.5. SWOT Analysis

11.15.6. Key Strategies

List of Tables

TABLE 1 MARKET SYNOPSIS

TABLE 2 LIST OF ASSUMPTIONS

TABLE 3 GLOBAL QUANTUM DOTS MARKET, BY PRODUCT, 2023-2032 (USD MILLION)

TABLE 4 GLOBAL QUANTUM DOTS MARKET, BY MATERIAL, 2023-2032 (USD MILLION)

TABLE 5 GLOBAL QUANTUM DOTS MARKET, BY VERTICAL, 2023-2032 (USD MILLION)

TABLE 6 GLOBAL QUANTUM DOTS MARKET, BY REGION, 2023-2032 (USD MILLION)

TABLE 7 NORTH AMERICA: QUANTUM DOTS MARKET, BY COUNTRY, 2023-2032 (USD MILLION)

TABLE 8 NORTH AMERICA: QUANTUM DOTS MARKET, BY PRODUCT, 2023-2032 (USD MILLION)

TABLE 9 NORTH AMERICA: QUANTUM DOTS MARKET, BY MATERIAL, 2023-2032 (USD MILLION)

TABLE 10 NORTH AMERICA: QUANTUM DOTS MARKET, BY VERTICAL, 2023-2032 (USD MILLION)

TABLE 11 US: QUANTUM DOTS MARKET, BY PRODUCT, 2023-2032 (USD MILLION)

TABLE 12 US: QUANTUM DOTS MARKET, BY MATERIAL, 2023-2032 (USD MILLION)

TABLE 13 US: QUANTUM DOTS MARKET, BY VERTICAL, 2023-2032 (USD MILLION)

TABLE 14 CANADA: QUANTUM DOTS MARKET, BY PRODUCT, 2023-2032 (USD MILLION)

TABLE 15 CANADA: QUANTUM DOTS MARKET, BY MATERIAL, 2023-2032 (USD MILLION)

TABLE 16 CANADA: QUANTUM DOTS MARKET, BY VERTICAL, 2023-2032 (USD MILLION)

TABLE 17 MEXICO: QUANTUM DOTS MARKET, BY PRODUCT, 2023-2032 (USD MILLION)

TABLE 18 MEXICO: QUANTUM DOTS MARKET, BY MATERIAL, 2023-2032 (USD MILLION)

TABLE 19 MEXICO: QUANTUM DOTS MARKET, BY VERTICAL, 2023-2032 (USD MILLION)

TABLE 20 EUROPE: QUANTUM DOTS MARKET, BY COUNTRY, 2023-2032 (USD MILLION)

TABLE 21 EUROPE: QUANTUM DOTS MARKET, BY PRODUCT, 2023-2032 (USD MILLION)

TABLE 22 EUROPE: QUANTUM DOTS MARKET, BY MATERIAL, 2023-2032 (USD MILLION)

TABLE 23 EUROPE: QUANTUM DOTS MARKET, BY VERTICAL, 2023-2032 (USD MILLION)

TABLE 24 UK: QUANTUM DOTS MARKET, BY PRODUCT, 2023-2032 (USD MILLION)

TABLE 25 UK: QUANTUM DOTS MARKET, BY MATERIAL, 2023-2032 (USD MILLION)

TABLE 26 UK: QUANTUM DOTS MARKET, BY VERTICAL, 2023-2032 (USD MILLION)

TABLE 27 GERMANY: QUANTUM DOTS MARKET, BY PRODUCT, 2023-2032 (USD MILLION)

TABLE 28 GERMANY: QUANTUM DOTS MARKET, BY MATERIAL, 2023-2032 (USD MILLION)

TABLE 29 GERMANY: QUANTUM DOTS MARKET, BY VERTICAL, 2023-2032 (USD MILLION)

TABLE 30 FRANCE: QUANTUM DOTS MARKET, BY PRODUCT, 2023-2032 (USD MILLION)

TABLE 31 FRANCE: QUANTUM DOTS MARKET, BY MATERIAL, 2023-2032 (USD MILLION)

TABLE 32 FRANCE: QUANTUM DOTS MARKET, BY VERTICAL, 2023-2032 (USD MILLION)

TABLE 33 REST OF EUROPE: QUANTUM DOTS MARKET, BY PRODUCT, 2023-2032 (USD MILLION)

TABLE 34 REST OF EUROPE: QUANTUM DOTS MARKET, BY MATERIAL, 2023-2032 (USD MILLION)

TABLE 35 REST OF EUROPE: QUANTUM DOTS MARKET, BY VERTICAL, 2023-2032 (USD MILLION)

TABLE 36 ASIA-PACIFIC: QUANTUM DOTS MARKET, BY COUNTRY, 2023-2032 (USD MILLION)

TABLE 37 ASIA-PACIFIC: QUANTUM DOTS MARKET, BY PRODUCT, 2023-2032 (USD MILLION)

TABLE 38 ASIA-PACIFIC: QUANTUM DOTS MARKET, BY MATERIAL, 2023-2032 (USD MILLION)

TABLE 39 ASIA-PACIFIC: QUANTUM DOTS MARKET, BY VERTICAL, 2023-2032 (USD MILLION)

TABLE 40 CHINA: QUANTUM DOTS MARKET, BY PRODUCT, 2023-2032 (USD MILLION)

TABLE 41 CHINA: QUANTUM DOTS MARKET, BY MATERIAL, 2023-2032 (USD MILLION)

TABLE 42 CHINA: QUANTUM DOTS MARKET, BY VERTICAL, 2023-2032 (USD MILLION)

TABLE 43 JAPAN: QUANTUM DOTS MARKET, BY PRODUCT, 2023-2032 (USD MILLION)

TABLE 44 JAPAN: QUANTUM DOTS MARKET, BY MATERIAL, 2023-2032 (USD MILLION)

TABLE 45 JAPAN: QUANTUM DOTS MARKET, BY VERTICAL, 2023-2032 (USD MILLION)

TABLE 46 INDIA: QUANTUM DOTS MARKET, BY PRODUCT, 2023-2032 (USD MILLION)

TABLE 47 INDIA: QUANTUM DOTS MARKET, BY MATERIAL, 2023-2032 (USD MILLION)

TABLE 48 INDIA: QUANTUM DOTS MARKET, BY VERTICAL, 2023-2032 (USD MILLION)

TABLE 49 SOUTH KOREA: QUANTUM DOTS MARKET, BY PRODUCT, 2023-2032 (USD MILLION)

TABLE 50 SOUTH KOREA: QUANTUM DOTS MARKET, BY MATERIAL, 2023-2032 (USD MILLION)

TABLE 51 SOUTH KOREA: QUANTUM DOTS MARKET, BY VERTICAL, 2023-2032 (USD MILLION)

TABLE 52 REST OF ASIA-PACIFIC: QUANTUM DOTS MARKET, BY PRODUCT, 2023-2032 (USD MILLION)

TABLE 53 REST OF ASIA-PACIFIC: QUANTUM DOTS MARKET, BY MATERIAL, 2023-2032 (USD MILLION)

TABLE 54 REST OF ASIA-PACIFIC: QUANTUM DOTS MARKET, BY VERTICAL, 2023-2032 (USD MILLION)

TABLE 55 REST OF THE WORLD: QUANTUM DOTS MARKET, BY COUNTRY, 2023-2032 (USD MILLION)

TABLE 56 REST OF THE WORLD: QUANTUM DOTS MARKET, BY PRODUCT, 2023-2032 (USD MILLION)

TABLE 57 REST OF THE WORLD: QUANTUM DOTS MARKET, BY MATERIAL, 2023-2032 (USD MILLION)

TABLE 58 REST OF THE WORLD: QUANTUM DOTS MARKET, BY VERTICAL, 2023-2032 (USD MILLION)

TABLE 59 MIDDLE EAST & AFRICA: QUANTUM DOTS MARKET, BY PRODUCT, 2023-2032 (USD MILLION)

TABLE 60 MIDDLE EAST & AFRICA: QUANTUM DOTS MARKET, BY MATERIAL, 2023-2032 (USD MILLION)

TABLE 61 MIDDLE EAST & AFRICA: QUANTUM DOTS MARKET, BY VERTICAL, 2023-2032 (USD MILLION)

TABLE 62 CENTRAL & SOUTH AMERICA: QUANTUM DOTS MARKET, BY PRODUCT, 2023-2032 (USD MILLION)

TABLE 63 CENTRAL & SOUTH AMERICA: QUANTUM DOTS MARKET, BY MATERIAL, 2023-2032 (USD MILLION)

TABLE 64 CENTRAL & SOUTH AMERICA: QUANTUM DOTS MARKET, BY VERTICAL, 2023-2032 (USD MILLION)

List of Figures

FIGURE 1 GLOBAL QUANTUM DOTS MARKET: MARKET STRUCTURE

FIGURE 2 TOP-DOWN & BOTTOM-UP APPROACHES

FIGURE 3 MARKET DYNAMICS ANALYSIS OF THE GLOBAL QUANTUM DOTS MARKET

FIGURE 4 VALUE CHAIN ANALYSIS OF THE GLOBAL QUANTUM DOTS MARKET

FIGURE 5 PORTER'S FIVE FORCES ANALYSIS OF THE GLOBAL QUANTUM DOTS MARKET

FIGURE 6 GLOBAL QUANTUM DOTS MARKET, BY MATERIAL, 2023 VS 2032 (USD MILLION)

FIGURE 7 GLOBAL QUANTUM DOTS MARKET, BY VERTICAL, 2023 VS 2032 (USD MILLION)

FIGURE 8 GLOBAL QUANTUM DOTS MARKET, BY REGION, 2023 VS 2032 (USD MILLION)

FIGURE 9 NORTH AMERICA: QUANTUM DOTS MARKET, BY COUNTRY, 2023 VS 2032 (USD MILLION)

FIGURE 10 NORTH AMERICA: QUANTUM DOTS MARKET, BY MATERIAL, 2023 VS 2032 (USD MILLION)

FIGURE 11 NORTH AMERICA: QUANTUM DOTS MARKET, BY VERTICAL, 2023 VS 2032 (USD MILLION)

FIGURE 12 EUROPE: QUANTUM DOTS MARKET, BY COUNTRY, 2023 VS 2032 (USD MILLION)

FIGURE 13 EUROPE: QUANTUM DOTS MARKET, BY MATERIAL, 2023 VS 2032 (USD MILLION)

FIGURE 14 EUROPE: QUANTUM DOTS MARKET, BY VERTICAL, 2023 VS 2032 (USD MILLION)

FIGURE 15 ASIA-PACIFIC: QUANTUM DOTS MARKET, BY COUNTRY, 2023 VS 2032 (USD MILLION)

FIGURE 16 ASIA-PACIFIC: QUANTUM DOTS MARKET, BY MATERIAL, 2023 VS 2032 (USD MILLION)

FIGURE 17 ASIA-PACIFIC: QUANTUM DOTS MARKET, BY VERTICAL, 2023 VS 2032 (USD MILLION)

FIGURE 18 REST OF THE WORLD: QUANTUM DOTS MARKET, BY COUNTRY, 2023 VS 2032 (USD MILLION)

FIGURE 19 REST OF THE WORLD: QUANTUM DOTS MARKET, BY MATERIAL, 2023 VS 2032 (USD MILLION)

FIGURE 20 REST OF THE WORLD: QUANTUM DOTS MARKET, BY VERTICAL, 2023 VS 2032 (USD MILLION)

FIGURE 21 TOP 10 PLAYERS MARKET SHARE ANALYSIS, BY REVENUE 2020 (%)

FIGURE 25 COMPETITIVE BENCHMARKING

Purchase Option
Single User $ 4,950
Multiuser License $ 5,950
Enterprise User $ 7,250
Compare Licenses
Tailored for You
  • Dedicated Research on any specifics segment or region.
  • Focused Research on specific players in the market.
  • Custom Report based only on your requirements.
  • Flexibility to add or subtract any chapter in the study.
  • Historic data from 2014 and forecasts outlook till 2040.
  • Flexibility of providing data/insights in formats (PDF, PPT, Excel).
  • Provide cross segmentation in applicable scenario/markets.