• Cat-intel
  • MedIntelliX
  • Resources
  • About Us
  • Hero Background
    English
    Chinese
    French
    Japanese
    Korean
    German
    Spanish

    FPGA Security Market Analysis

    ID: MRFR/SEM/6293-CR
    153 Pages
    Shubham Munde
    April 2019

    FPGA Security Market Research Report Information By Configuration (Low-end FPGA, Mid-Range FPGA, and High-End FPGA), By Node Size (Less than 28nm, 28-90 nm, and More than 90nm), By Technology (SRAM, Flash, and Antifuse), By Application (FPGA Synthesis Flow, Applied Cryptography, Algorithmic Cryptographic Security, and Others), And By Region (North America, Europe, Asia-Pacific, And Rest Of The ...

    Share:
    Download PDF ×

    We do not share your information with anyone. However, we may send you emails based on your report interest from time to time. You may contact us at any time to opt-out.

    FPGA Security Market Infographic
    $ 4,950.0
    $ 5,950.0
    $ 7,250.0

    Market Analysis

    In-depth Analysis of FPGA Security Market Industry Landscape

    The market dynamics of FPGA (Field-Programmable Gate Array) security are influenced by several key factors that shape supply, demand, and overall industry trends. One significant driver of this market is the increasing adoption of FPGAs in critical applications such as telecommunications, aerospace, defense, automotive, and IoT (Internet of Things). FPGAs offer flexibility, performance, and reconfigurability, making them ideal for implementing complex algorithms and processing tasks in a wide range of applications. However, the growing reliance on FPGAs in mission-critical systems has raised concerns about security vulnerabilities, driving the demand for FPGA security solutions to protect against threats such as IP theft, data breaches, tampering, and malicious attacks.

    Technological advancements play a crucial role in driving the market dynamics of FPGA security. As FPGA technology evolves, manufacturers are continually innovating to enhance the security features and capabilities of their products. This includes the development of secure boot mechanisms, encryption algorithms, hardware-based security modules, and secure communication protocols to protect FPGA designs, configurations, and sensitive data from unauthorized access and manipulation. Additionally, advancements in hardware security assurance methodologies, such as side-channel analysis, fault injection, and security verification tools, are helping to improve the robustness and reliability of FPGA security solutions.

    Another factor influencing market dynamics is the increasing regulatory scrutiny and compliance requirements for security-critical applications. Industries such as aerospace, defense, healthcare, and finance are subject to strict regulations and standards governing data protection, privacy, and cybersecurity. Compliance with regulations such as GDPR (General Data Protection Regulation), HIPAA (Health Insurance Portability and Accountability Act), NIST (National Institute of Standards and Technology) guidelines, and ISO (International Organization for Standardization) standards is essential for organizations to ensure the security and integrity of their FPGA-based systems and applications. As a result, there is a growing demand for FPGA security solutions that enable compliance with regulatory requirements and industry best practices.

    The competitive landscape also plays a significant role in shaping market dynamics. Major players in the industry, including semiconductor companies such as Xilinx, Intel (formerly Altera), Lattice Semiconductor, and Microchip Technology, compete for market share by offering a wide range of FPGA security solutions with different features, performance levels, and price points. Competition among manufacturers drives continuous innovation in product design, security features, and integration capabilities, benefiting customers with a variety of options to choose from.

    Additionally, market dynamics are influenced by changing customer perceptions and awareness of security risks. High-profile data breaches, cyberattacks, and intellectual property theft incidents have raised awareness of the importance of cybersecurity and the need for robust security measures to protect sensitive information and critical infrastructure. As a result, organizations are increasingly prioritizing security investments and seeking comprehensive solutions to safeguard their FPGA-based systems and applications against evolving threats.

    Economic factors also impact the market dynamics of FPGA security. Budget constraints, cost considerations, and return on investment (ROI) calculations may influence purchasing decisions among customers, especially in industries facing financial challenges or market uncertainties. Manufacturers may adjust pricing strategies and offer competitive pricing to attract customers and gain market share. Economic conditions also affect investment in R&D activities, which can impact the development and adoption of new FPGA security technologies and solutions.

    Furthermore, market dynamics are shaped by emerging trends and technologies in the FPGA security market. Trends such as the adoption of hardware-based security solutions, secure enclave architectures, and hardware/software co-design approaches are reshaping the landscape of FPGA security. Other trends, such as the rise of AI (Artificial Intelligence) and ML (Machine Learning) technologies for threat detection and anomaly detection, are driving innovation and expanding the capabilities of FPGA security solutions.

    Market Summary

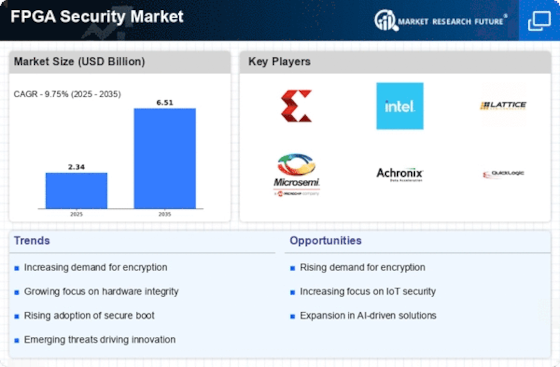
    As per Market Research Future Analysis, the FPGA Security Market was valued at USD 2.34 Billion in 2024 and is projected to reach USD 6.51 Billion by 2035, growing at a CAGR of 9.75% from 2025 to 2035. Key drivers include the rising number of data centers and the increasing demand for security protocols. The market is significantly influenced by the telecommunications sector, with FPGAs providing enhanced security and performance for various applications, including IoT and AI. The low-end FPGA segment led the market in 2022, while the 28-90 nm node size is expected to dominate due to its flexibility and low power consumption. Major players are focusing on R&D to innovate and expand their product offerings.

    Key Market Trends & Highlights

    The FPGA Security Market is witnessing significant growth driven by technological advancements and increasing security needs.

    • Market Size in 2024: USD 2.34 Billion; Projected to reach USD 6.51 Billion by 2035.
    • CAGR from 2025 to 2035: 9.75%; driven by data center growth and security protocol demand.
    • Low-end FPGA segment led the market in 2022; used extensively in automotive and consumer electronics.
    • 28-90 nm node size expected to grow at a CAGR of 11.20%; favored for its performance and low power use.

    Market Size & Forecast

    2024 Market Size USD 2.34 Billion
    2035 Market Size USD 6.51 Billion
    CAGR (2024-2035) 9.75%
    Largest Regional Market Share in 2024 North America.

    Major Players

    Key players include Xilinx Inc., Microchip Technology Inc., Achronix Semiconductor Corporation, Cypress Semiconductor Corporation, Texas Instruments Incorporated, Lattice Semiconductor, Intel Corporation, Quicklogics Corp., and Teledyne Technologies Inc.

    Market Trends

    Growing of data centers and the use of the cloud is driving the market growth

    Market CAGR for FPGA security is driven by the increased use of data centers, and cloud services have made it necessary to find ways to keep data safe. Hardware solutions for programmable electronics can improve storage solutions already in place. Cloud security engineers can improve data center authentication by using bitstream authentication. In businesses, the endpoints of data transmission must be safe from harmful data. FPGAs can give industrial controls better security than libraries of antivirus software that are always being updated. Cyberattacks often go after networks with different layouts, low encryption, and security standards.

    FPGAs can be used to speed up the processing of loops and parallelization by adding reprogrammed algorithms and cryptographic protocols. Industry 4.0 and its many uses could lead to the development of FPGA security options. Demand for FPGA security is expected to rise due to the issues mentioned above in the future.

    Additionally, FPGAs are used a lot in the telecommunications business, which is one of the most promising. The global telecom business is growing because developed and developing countries are investing more and changing their communication systems. IoT, AI, and edge computing technologies are causing customers' wants and preferences to change in a big way, both good and bad for telecom companies. Because the telecommunications industry is so complicated and customer demand is growing, the working needs of the equipment and hardware used in the industry and the need for secure communications are quickly increasing.

    In the next few years, the size of the FPGA security market for the telecommunications sector is expected to grow because of its easy configurability, flexibility, low latency operations, effective hardware acceleration, and low costs. Therefore, the increasing prevalence of FPGA security is fueling the expansion of the international market.

    For instance, Lattice Semiconductor Corporation invests in the Lattice Mach-NX FPGA, the second generation of secure control FPGAs. It can be used in future server platforms, high computing, wireless communications, industrial, and car systems to make working faster and safer while using less power. As a result, the demand for FPGA security is predicted to grow throughout the forecasted time due to the rising demand for the automotive industry. Thus, the driving factor is the FPGA security market revenue.

    The increasing complexity of cyber threats necessitates enhanced security measures for FPGA devices, as they are increasingly integrated into critical infrastructure and sensitive applications.

    U.S. Department of Homeland Security

    FPGA Security Market Market Drivers

    Expansion of IoT Devices

    The proliferation of Internet of Things (IoT) devices significantly influences the Global FPGA Security Market Industry. With billions of connected devices anticipated by 2024, the need for secure processing and data handling becomes paramount. FPGAs offer customizable security features that can be tailored to specific IoT applications, enhancing their appeal. As industries such as healthcare and manufacturing increasingly adopt IoT solutions, the demand for FPGA-based security solutions is likely to rise. This trend suggests that the market could experience substantial growth, potentially reaching 6.53 USD Billion by 2035, driven by the need for secure IoT infrastructures.

    Market Growth Projections

    The Global FPGA Security Market Industry is projected to experience robust growth, with estimates indicating a market value of 2.34 USD Billion in 2024 and a potential rise to 6.53 USD Billion by 2035. This growth trajectory reflects a compound annual growth rate (CAGR) of 9.78% from 2025 to 2035. Such projections highlight the increasing importance of FPGA security solutions across various sectors, driven by the need for enhanced data protection and compliance with regulatory standards. The anticipated growth in market size suggests a burgeoning demand for innovative FPGA technologies that can address evolving security challenges.

    Advancements in FPGA Technology

    Technological advancements in FPGA design and architecture are significantly impacting the Global FPGA Security Market Industry. Innovations such as improved processing capabilities, lower power consumption, and enhanced security features are making FPGAs more attractive for various applications. For instance, the introduction of 5G technology necessitates advanced security measures, and FPGAs are being utilized to meet these demands. As these technologies evolve, they are expected to drive further adoption of FPGA solutions, contributing to the market's growth trajectory. The continuous evolution of FPGA technology suggests a promising future for the industry, with substantial opportunities for development.

    Increased Cybersecurity Threats

    The rising frequency and sophistication of cyber threats are catalyzing growth in the Global FPGA Security Market Industry. Organizations are increasingly aware of the vulnerabilities associated with traditional security measures, prompting a shift towards more resilient solutions. FPGAs, with their reconfigurable nature, offer a unique advantage in developing adaptive security protocols that can respond to emerging threats. As cyberattacks become more prevalent, the demand for FPGA-based security solutions is expected to escalate, further driving market expansion. This trend underscores the critical role of FPGA technology in safeguarding sensitive information and infrastructure.

    Government Regulations and Compliance

    Stringent government regulations regarding data protection and cybersecurity are propelling the Global FPGA Security Market Industry. Regulatory bodies across the globe are implementing frameworks that necessitate enhanced security measures for electronic devices. For example, the Federal Information Processing Standards (FIPS) in the United States mandates specific security requirements for federal agencies. As organizations strive to comply with these regulations, the adoption of FPGA technology for secure applications is likely to increase. This regulatory environment not only fosters market growth but also encourages innovation in FPGA security solutions, aligning with the projected CAGR of 9.78% for the period from 2025 to 2035.

    Rising Demand for Secure Communication

    The increasing reliance on secure communication channels across various sectors drives the Global FPGA Security Market Industry. As organizations prioritize data integrity and confidentiality, the demand for FPGAs that can provide robust encryption and security features is surging. For instance, the telecommunications sector is adopting FPGAs to enhance the security of data transmission. This trend is reflected in the projected market value of 2.34 USD Billion in 2024, indicating a growing recognition of the need for secure communication solutions. The integration of FPGA technology into secure communication systems is expected to bolster the overall market growth.

    Market Segment Insights

    FPGA Security Configuration Insights

    The FPGA Security Market segmentation, based on configuration, includes low-end FPGA, mid-range FPGA, and high-end FPGA. In 2022, the low-end FPGA segment led the FPGA security market in revenue. Low-end FPGAs are used in more automotive, consumer electronics, and industrial uses because they use less energy and are easier to use.

    Figure 1: FPGA Security Market by Configuration, 2022 & 2032 (USD Billion)

    Source: Secondary Research, Primary Research, MRFR Database, and Analyst Review

    FPGA Security Node Size Insights

    The FPGA Security Market segmentation, based on node size, includes less than 28nm, 28-90 nm, and more than 90nm. The 28-90 nm category is anticipated to grow at a CAGR of 11.20% over the projected period, making up the largest market share due to the 20–90 nm FPGAs' good performance, flexibility in programming, and low power use, among other things. The telecommunications industry's demand for 20–90 nm FPGAs in wired and wireless transmission is increasing.

    FPGA Security Technology Insights

    The FPGA Security Market segmentation, based on the technology, includes SRAM, flash, and anti-fuse. The SRAM category is expected to grow fastest at a CAGR of 11.20% in the future because Increasing use of these FPGAs in telecommunication systems, consumer gadgets, military and aerospace, and data center network acceleration, among other things. The complementary metal oxide semiconductor (CMOS) process builds FPGAs on SRAM technology.

    FPGA Security Application Insights

    The FPGA Security Market segmentation, based on application, includes FPGA synthesis flow, applied cryptography, algorithmic cryptographic security, and others. The applied cryptography category is anticipated to grow at a CAGR of 11.20% over the projected period because, with FPGA-based implementations of cryptography and key storage, the system can be set up so that the software can never access cryptographic keys or other security-critical values. Even if the program is broken, the FPGA will keep the keys safe.

    Get more detailed insights about FPGA Security Market Research Report- Global Forecast till 2032

    Regional Insights

    By region, the study provides market insights into North America, Europe, Asia-Pacific, and the Rest of the World. The North American FPGA security market will dominate because of technological improvements and customer demand for FPGAs rising in these countries, and more and more companies are entering the FPGA market. IT and telecommunications are growing, and there are more and more data centers.

    Further, the major countries studied in the market report are The US, Canada, German, France, the UK, Italy, Spain, China, Japan, India, Australia, South Korea, and Brazil.

    Figure 2: FPGA Security Market SHARE BY REGION 2022 (USD Billion)

    FPGA Security Market SHARE BY REGION 2022

    Source: Secondary Research, Primary Research, MRFR Database, and Analyst Review

    Europe’s FPGA security market accounts for the second-largest market share because 5G networks are increasingly used. Further, the German FPGA security market held the largest market share, and the UK FPGA security market was the rapidly-growing market in the European region.

    The Asia-Pacific FPGA security market is expected to grow at the fastest CAGR from 2023 to 2032 because of things like the growing demand for consumer electronics, the increasing trend of automation in the automotive and industrial sectors, and the growing use of technologies like AI, IoT, and cloud computing. Moreover, China’s FPGA security market held the largest market share, and the Indian FPGA security market was the fastest-rising market in the Asia-Pacific region.

    Key Players and Competitive Insights

    Leading market players are investing heavily in research and development to expand their product lines, which will help the FPGA security market grow even more. There are some strategies for action that market participants are implementing to increase their presence around the world's global footprint, with important market developments including new product launches, contractual agreements and acquisitions, higher investments, and collaboration with other organizations. To expand and survive in a more competitive and rising market climate, the FPGA security industry must offer cost-effective items.

    Manufacturing locally to minimize operational costs is one of the key business tactics manufacturer use in the global FPGA security industry to benefit clients and increase the market sector. In recent years, the FPGA security industry has offered some of the most significant technological advancements. Major players in the FPGA security market, including Xilinx Inc., Microchip Technology Inc., Achronix Semiconductor Corporation, Cypress Semiconductor Corporation, Texas Instruments Incorporated, Lattice Semiconductor, Intel Corporation, Financial Overview, Quicklogics Corp., and Teledyne Technologies Inc., and others are attempting to grow market demand by investing in research and development operations.

    AMD has significantly accelerated innovation in graphics, visualization, and high-performance computing. Billions of people worldwide utilize AMD technology daily to improve their lives, careers, and leisure activities. Top Fortune 500 businesses and leading-edge institutions for scientific research are included in this. AMD staff members focus primarily on developing flexible, high-performance solutions that stretch the bounds of what is possible. When AMD was established as a Silicon Valley start-up in 1969, hundreds of employees were enthusiastic about creating cutting-edge semiconductor devices at the company's inception.

    AMD has become a worldwide company defining the standard for modern computing thanks to several key industry firsts and substantial technological advancements. In June 2023, AMD announced the addition of two new, workload-optimized processors to its array of 4th Gen EPYCTM CPUs. By leveraging the new "Zen 4c" core architecture, the AMD EPYC 97X4 cloud native-optimized data center CPUs advance the EPYC 9004 Series of processors by offering the thread density and scale necessary for leading-edge cloud native computing.

    Microchip Technology, Inc. is an industry-recognized pioneer in embedded control systems that are intelligent, networked, and secure. With its user-friendly development tools and a broad choice of products, customers can create the finest designs possible, lowering risk while reducing total system cost and time to market. In the industrial, automotive, consumer, aerospace and defense, communications, and computer industries, the company's products are used by more than 125,000 clients. Microchip's headquarters in Chandler, Arizona, offers superb technical support, dependable shipping, and premium goods.

    In January 2023, Microchip Technology Inc. announced its first radiation-tolerant commercial off-the-shelf (COTS) power device, the MIC69303RT 3A Low-Dropout (LDO) Voltage Regulator. The MIC69303RT, a revolutionary high current and low voltage power management solution targeted at LEO and other space applications, is an example.

    Key Companies in the FPGA Security Market market include

    Industry Developments

    March 2023: Texas Instruments (TI) announced that LITEON Technology had chosen TI's highly integrated C2000TM real-time microcontrollers (MCUs) and Gallium Nitride (GaN) field effect transistor (FET) for their newest high-performance server PSU for the North American market. A TMS320F28003x C2000 real-time MCU and TI's LMG3522R030 GaN FET are used in the recently commercialized PSU, which offers a power density of over 95 W/in3 and satisfies 80 Plus Titanium criteria.

    March 2023: Microchip Technology created its flight-ready RT PolarFire® FPGA with the development kit and interfaces to enable the evaluation of design concepts based on actual in-flight electrical and mechanical properties.

    Future Outlook

    FPGA Security Market Future Outlook

    The FPGA Security Market is projected to grow at a 9.75% CAGR from 2025 to 2035, driven by increasing cybersecurity threats and demand for secure hardware solutions.

    New opportunities lie in:

    • Develop advanced encryption techniques tailored for FPGA applications.
    • Invest in AI-driven security solutions for real-time threat detection.
    • Expand partnerships with IoT manufacturers to enhance device security.

    By 2035, the FPGA Security Market is expected to be robust, reflecting substantial growth and innovation.

    Market Segmentation

    FPGA Security Regional Outlook

    • North America
    • US
    • Canada
    • Europe
    • Germany
    • France
    • UK
    • Italy
    • Spain
    • Rest of Europe
    • Asia-Pacific
    • China
    • Japan
    • India
    • Australia
    • South Korea
    • Rest of Asia-Pacific
    • Rest of the World
    • Middle East
    • Africa
    • Latin America

    FPGA Security Node Size Outlook

    • Less than 28nm
    • 28-90 nm
    • More than 90nm

    FPGA Security Technology Outlook

    • SRAM
    • Flash
    • Antifuse

    FPGA Security Application Outlook

    • FPGA synthesis Flow
    • Applied cryptography
    • Algorithmic cryptographic security
    • Others

    FPGA Security Configuration Outlook

    • Low-end FPGA
    • Mid-Range FPGA
    • High-End FPGA

    Report Scope

    Report Attribute/Metric Details
    Market Size 2024 USD 2.34 Billion
    Market Size 2035 6.51 (Value (USD Billion))
    Compound Annual Growth Rate (CAGR) 9.75% (2025 - 2035)
    Base Year 2024
    Market Forecast Period 2025 - 2035
    Historical Data 2018- 2022
    Market Forecast Units Value (USD Billion)
    Report Coverage Revenue Forecast, Market Competitive Landscape, Growth Factors, and Trends
    Segments Covered Configuration, Node Size, Technology, Application, and Region
    Geographies Covered North America, Europe, Asia Pacific, Aircraft Type, and the Rest of the World
    Countries Covered The US, Canada, German, France, UK, Italy, Spain, China, Japan, India, Australia, South Korea, and Brazil
    Key Companies Profiled Xilinx Inc., Microchip Technology Inc., Achronix Semiconductor Corporation, Cypress Semiconductor Corporation, Texas Instruments Incorporated, Lattice Semiconductor, Intel Corporation, Financial Overview, Quicklogics Corp., and Teledyne Technologies Inc.
    Key Market Opportunities Increase in the use of technology like the Internet, smartphones, and cloud storage
    Key Market Dynamics Increasing need for consumer devices Increased mechanization in production facilities and vehicles
    Market Size 2025 2.57 (Value (USD Billion))

    Market Highlights

    Author

    Shubham Munde
    Research Analyst Level II

    She holds an experience of about 6+ years in market research and business consulting, working under the spectrum of information communication technology, telecommunications and semiconductor domains. aarti conceptualizes and implements a scalable business strategy and provides strategic leadership to the clients. her expertise lies in market estimation, competitive intelligence, pipeline analysis, customer assessment, etc.

    Leave a Comment

    Latest Comments

    John Doe
    john@example.com

    This is a great article! Really helped me understand the topic better.

    Posted on July 23, 2025, 10:15 AM
    Jane Smith
    jane@domain.com

    Thanks for sharing this. I’ve bookmarked it for later reference.

    Posted on July 22, 2025, 7:45 PM

    FAQs

    How much is the FPGA security market?

    The FPGA Security Market size was valued at USD 2.11 Billion in 2023.

    What is the growth rate of the FPGA security market?

    The global market is projected to grow at a CAGR of 9.75% during the forecast period, 2024-2032.

    Which region held the largest market share in the FPGA security market?

    North America had the largest share of the global market.

    Who are the key players in the FPGA security market?

    The key players in the market are Xilinx Inc., Microchip Technology Inc., Achronix Semiconductor Corporation, Cypress Semiconductor Corporation, Texas Instruments Incorporated, Lattice Semiconductor, Intel Corporation, Financial Overview, Quicklogics Corp., Teledyne Technologies Inc.

    Which technology type led the FPGA security market?

    The SRAM category dominated the market in 2022.

    Which application had the largest market share in the FPGA security market?

    Applied cryptography had the largest share of the global market.

    1. Executive Summary
      1. Summary 13
    2. Industry Overview
      1. Field Programmable Gate Array (FPGA) Market Overview 20
        1. Field Programmable Gate Array (FPGA) Market 20
        2. Market Status and Outlook 20
      2. Global FIELD PROGRAMMABLE GATE ARRAY (FPGA) Market Size and Analysis by Regions (2024-2032) 20
        1. USA Field Programmable Gate Array (FPGA) Market Status and Outlook 22
        2. Europe Field Programmable Gate Array (FPGA) Market Status and Outlook 22
        3. China Field Programmable Gate Array (FPGA) Market Status and Outlook 23
        4. Japan Field Programmable Gate Array (FPGA) Market Status and Outlook 23
        5. India Field Programmable Gate Array (FPGA) Market Status and Outlook 24
        6. Southeast Asia Field Programmable Gate Array (FPGA) Market Status and Outlook 24
        7. Rest of the World Field Programmable Gate Array (FPGA) Market Status and Outlook 25
      3. Classification of Field Programmable Gate Array (FPGA) by Technology 25
        1. Global Field Programmable Gate Array (FPGA) Revenue (Million USD) and Growth (%) Comparison by Technology (2024-2032) 25
        2. Global Field Programmable Gate Array (FPGA) Market Share (%) by Technology in 2017 26
      4. Classification of Field Programmable Gate Array (FPGA) by Application 27
        1. Global Field Programmable Gate Array (FPGA) Revenue (Million USD) and Growth (%) Comparison by Application (2024-2032) 27
        2. Global Field Programmable Gate Array (FPGA) Market Share (%) by Application in 2017 28
    3. Research Methodology
      1. Research Process 30
      2. Scope of the Study 34
      3. Market Structure 34
      4. List of Assumptions 35
      5. Forecast Model 36
    4. Field Programmable Gate Array (FPGA) Market Dynamics
      1. Introduction 38
      2. Drivers 38
        1. FPGA’s deployment across telecommunication sector for increasing the network bandwidth 38
        2. Efficiency of FPGAs over ASICs 39
      3. Market Restraint 39
        1. Security concerns with FPGAs 39
      4. Opportunities 40
        1. Adoption of FPGA in smartphones and mobile devices and wearable 40
        2. Rising usage of FPGA in the automobile sector 40
      5. Challenge 41
        1. Designing Complexities 41
      6. Globalization & Trade 41
        1. Business Locations 41
        2. Supply Channels 41
        3. Barriers to Entry 41
      7. Supply Chain Analysis 42
        1. Raw Material Suppliers 42
        2. Component Manufacturers 42
        3. Designers and Programmers 42
        4. System Integrators 43
        5. End–Users 43
      8. Production Process 43
      9. End -User Market Analysis 43
    5. Global Field Programmable Gate Array (FPGA) Market Size, By Technology (2024-2032)
      1. Global Field Programmable Gate Array (FPGA) Market Size by Technology (2024-2032) 45
        1. SRAM Programmed FPGA 46
        2. Antifuse Programmed FPGA 47
        3. EEPROM Programmed FPGA 47
    6. Global Field Programmable Gate Array (FPGA) Market Size, By Application (2024-2032)
      1. Global Field Programmable Gate Array (FPGA) Market Size by Application (2024-2032) 49
        1. Telecommunication 50
        2. Consumer Electronics 51
        3. Automotive 51
        4. Data Center 51
        5. Industrial 51
    7. Global Field Programmable Gate Array (FPGA) Market, By Region
      1. Global Field Programmable Gate Array (FPGA) Development Status and Outlook 53
      2. North America Field Programmable Gate Array (FPGA) Development Status and Outlook 54
        1. North America Field Programmable Gate Array (FPGA) Market 54
      3. Europe Field Programmable Gate Array (FPGA) Development Status and Outlook 62
        1. Europe Field Programmable Gate Array (FPGA) Market 62
      4. Asia-Pacific Field Programmable Gate Array (FPGA) Development Status and Outlook 72
        1. Asia-Pacific Field Programmable Gate Array (FPGA) Market 72
      5. Rest of the world (ROW) Field Programmable Gate Array (FPGA) Development Status and Outlook 83
        1. Rest of the world Field Programmable Gate Array (FPGA) Market 83
    8. Global Field Programmable Gate Array (FPGA) Shipments, Supply (Production), Consumption, Export, Import (2024-2032)
      1. Global Field Programmable Gate Array (FPGA) Shipments, by Region (2024-2032) K Units 88
        1. USA Field Programmable Gate Array (FPGA)Production, Consumption, Export, Import (2024-2032) 89
    9. Global Field Programmable Gate Array (FPGA) Consumption by Technology (2024-2032)
      1. USA FPGA Market Consumption, by Technology (K Units) 94
      2. Europe FPGA Market Consumption, by Technology (K Units) 94
      3. China FPGA Market Consumption, by Technology (K Units) 95
      4. Japan FPGA Market Consumption, by Technology (K Units) 95
      5. India FPGA Market Consumption, by Technology (K Units) 96
      6. Southeast Asia FPGA Market Consumption, by Technology (K Units) 96
      7. ROW FPGA Market Consumption, by Technology (K Units) 97
      8. Global Field Programmable Gate Array (FPGA) Consumption by Application (2024-2032) 97
    10. Company Profiles
      1. Xilinx Inc. 99
        1. Company Overview 99
        2. Financial Overview 99
        3. Products/Solution Offered 100
      2. Microchip Technology Inc. 101
        1. Company Overview 101
        2. Financial Overview 101
        3. Products/Solution Offered 102
      3. Achronix Semiconductor Corporation 103
        1. Company Overview 103
        2. Products/Solution Offered 103
      4. Cypress Semiconductor Corporation 104
        1. Company Overview 104
        2. Financial Overview 104
        3. Products/Solution Offered 105
      5. Texas Instruments Incorporated 106
        1. Company Overview 106
        2. Financial Overview 106
        3. Products/Solution Offered 107
      6. Lattice Semiconductor 108
        1. Company Overview 108
        2. Financial Overview 108
        3. Products/Solution Offered 109
      7. Intel Corporation 110
        1. Company Overview 110
        2. Financial Overview 110
        3. Products/Solution Offered 111
      8. QuickLogic Corp. 112
        1. Company Overview 112
        2. Financial Overview 112
        3. Products/Solution Offered 113
      9. Teledyne Technologies Incorporated 114
        1. Company Overview 114
        2. Financial Overview 114
        3. Products/Solution Offered 115
    11. List of Tables and Figures
      1. 11 List of Tables
      2. TABLE 1 GLOBAL FIELD PROGRAMMABLE GATE ARRAY (FPGA) MAJOR DISTRIBUTORS 14
      3. TABLE 2 GLOBAL FIELD PROGRAMMABLE GATE ARRAY (FPGA) MARKET REVENUE (MILLION USD) COMPARISON BY REGION (2024-2032) 17
      4. TABLE 3 NORTH AMERICA FIELD PROGRAMMABLE GATE ARRAY (FPGA) MARKET REVENUE (MILLION USD) COMPARISON BY REGIONS (2024-2032) 17
      5. TABLE 4 GLOBAL FIELD PROGRAMMABLE GATE ARRAY (FPGA) MARKET SIZE (MILLION USD) SPLIT BY TECHNOLOGY, 2024-203217
      6. TABLE 5 GLOBAL FIELD PROGRAMMABLE GATE ARRAY (FPGA) MARKET SIZE (MILLION USD) BY APPLICATION, 2024-203218
      7. TABLE 6 GLOBAL FIELD PROGRAMMABLE GATE ARRAY (FPGA) MARKET REVENUE (MILLION USD) COMPARISON BY REGIONS (2024-2032) 20
      8. TABLE 7 NORTH AMERICA FIELD PROGRAMMABLE GATE ARRAY (FPGA) MARKET REVENUE (MILLION USD) COMPARISON BY REGIONS (2024-2032) 21
      9. TABLE 8 REST OF THE WORLD FIELD PROGRAMMABLE GATE ARRAY (FPGA) MARKET SIZE (MILLION USD) AND GROWTH RATE (2024-2032) % 25
      10. TABLE 9 GLOBAL FIELD PROGRAMMABLE GATE ARRAY (FPGA) REVENUE (MILLION USD) AND GROWTH RATE (%) COMPARISON BY TECHNOLOGY (2024-2032) 25
      11. TABLE 10 GLOBAL FIELD PROGRAMMABLE GATE ARRAY (FPGA) REVENUE (MILLION USD) AND GROWTH RATE (%) COMPARISON BY APPLICATION (2024-2032) 27
      12. TABLE 11 LIST OF ASSUMPTIONS 35
      13. TABLE 12 GLOBAL FIELD PROGRAMMABLE GATE ARRAY (FPGA) MARKET SIZE BY TECHNOLOGY (2024-2032) 45
      14. TABLE 13 GLOBAL FIELD PROGRAMMABLE GATE ARRAY (FPGA) MARKET SIZE BY TECHNOLOGY (2024-2032) 46
      15. TABLE 14 GLOBAL FIELD PROGRAMMABLE GATE ARRAY (FPGA) MARKET SIZE BY APPLICATION (2024-2032) 49
      16. TABLE 15 GLOBAL FIELD PROGRAMMABLE GATE ARRAY (FPGA) MARKET SIZE BY APPLICATION (2024-2032) 50
      17. TABLE 16 GLOBAL FIELD PROGRAMMABLE GATE ARRAY (FPGA) MARKET SIZE, BY REGION, 2024-2032(USD MILLION) 53
      18. TABLE 17 GLOBAL FIELD PROGRAMMABLE GATE ARRAY (FPGA) MARKET SIZE, BY REGION, 2024-2032(USD MILLION) 53
      19. TABLE 18 NORTH AMERICA FIELD PROGRAMMABLE GATE ARRAY (FPGA) MARKET SIZE, BY COUNTRY, 2024-2032(USD MILLION) 55
      20. TABLE 19 NORTH AMERICA FIELD PROGRAMMABLE GATE ARRAY (FPGA) MARKET SIZE, BY COUNTRY, 2024-2032(USD MILLION) 55
      21. TABLE 20 NORTH AMERICA FIELD PROGRAMMABLE GATE ARRAY (FPGA) MARKET, BY TECHNOLOGY, 2024-2032(USD MILLION) 56
      22. TABLE 21 NORTH AMERICA FIELD PROGRAMMABLE GATE ARRAY (FPGA) MARKET, BY TECHNOLOGY, 2024-2032(USD MILLION) 56
      23. TABLE 22 NORTH AMERICA FIELD PROGRAMMABLE GATE ARRAY (FPGA) MARKET, BY APPLICATION, 2024-2032(USD MILLION) 57
      24. TABLE 23 NORTH AMERICA FIELD PROGRAMMABLE GATE ARRAY (FPGA) MARKET, BY APPLICATION, 2024-2032(USD MILLION) 57
      25. TABLE 24 US FIELD PROGRAMMABLE GATE ARRAY (FPGA) MARKET, BY TECHNOLOGY, 2024-2032(USD MILLION) 58
      26. TABLE 25 US FIELD PROGRAMMABLE GATE ARRAY (FPGA) MARKET, BY TECHNOLOGY, 2024-2032(USD MILLION) 58
      27. TABLE 26 US FIELD PROGRAMMABLE GATE ARRAY (FPGA) MARKET, BY APPLICATION, 2024-2032(USD MILLION) 58
      28. TABLE 27 US FIELD PROGRAMMABLE GATE ARRAY (FPGA) MARKET, BY APPLICATION, 2024-2032(USD MILLION) 59
      29. TABLE 28 CANADA FIELD PROGRAMMABLE GATE ARRAY (FPGA) MARKET, BY TECHNOLOGY, 2024-2032(USD MILLION) 59
      30. TABLE 29 CANADA FIELD PROGRAMMABLE GATE ARRAY (FPGA) MARKET, BY TECHNOLOGY, 2024-2032(USD MILLION) 59
      31. TABLE 30 CANADA FIELD PROGRAMMABLE GATE ARRAY (FPGA) MARKET, BY APPLICATION, 2024-2032(USD MILLION) 60
      32. TABLE 31 CANADA FIELD PROGRAMMABLE GATE ARRAY (FPGA) MARKET, BY APPLICATION, 2024-2032(USD MILLION) 60
      33. TABLE 32 MEXICO FIELD PROGRAMMABLE GATE ARRAY (FPGA) MARKET, BY TECHNOLOGY, 2024-2032(USD MILLION) 60
      34. TABLE 33 MEXICO FIELD PROGRAMMABLE GATE ARRAY (FPGA) MARKET, BY TECHNOLOGY, 2024-2032(USD MILLION) 61
      35. TABLE 34 MEXICO FIELD PROGRAMMABLE GATE ARRAY (FPGA) MARKET, BY APPLICATION, 2024-2032(USD MILLION) 61
      36. TABLE 35 MEXICO FIELD PROGRAMMABLE GATE ARRAY (FPGA) MARKET, BY APPLICATION, 2024-2032(USD MILLION) 61
      37. TABLE 36 EUROPE FIELD PROGRAMMABLE GATE ARRAY (FPGA) MARKET SIZE, BY COUNTRY, 2024-2032(USD MILLION) 63
      38. TABLE 37 EUROPE FIELD PROGRAMMABLE GATE ARRAY (FPGA) MARKET SIZE, BY COUNTRY, 2024-2032(USD MILLION) 63
      39. TABLE 38 EUROPE FIELD PROGRAMMABLE GATE ARRAY (FPGA) MARKET, BY TECHNOLOGY, 2024-2032(USD MILLION) 64
      40. TABLE 39 EUROPE FIELD PROGRAMMABLE GATE ARRAY (FPGA) MARKET, BY TECHNOLOGY, 2024-2032(USD MILLION) 64
      41. TABLE 40 EUROPE FIELD PROGRAMMABLE GATE ARRAY (FPGA) MARKET, BY APPLICATION, 2024-2032(USD MILLION) 65
      42. TABLE 41 EUROPE FIELD PROGRAMMABLE GATE ARRAY (FPGA) MARKET, BY APPLICATION, 2024-2032(USD MILLION) 65
      43. TABLE 42 UK FIELD PROGRAMMABLE GATE ARRAY (FPGA) MARKET, BY TECHNOLOGY, 2024-2032(USD MILLION) 66
      44. TABLE 43 UK FIELD PROGRAMMABLE GATE ARRAY (FPGA) MARKET, BY TECHNOLOGY, 2024-2032(USD MILLION) 66
      45. TABLE 44 UK FIELD PROGRAMMABLE GATE ARRAY (FPGA) MARKET, BY END-UKER, 2024-2032(USD MILLION) 66
      46. TABLE 45 UK FIELD PROGRAMMABLE GATE ARRAY (FPGA) MARKET, BY END-UKER, 2024-2032(USD MILLION) 67
      47. TABLE 46 GERMANY FIELD PROGRAMMABLE GATE ARRAY (FPGA) MARKET, BY TECHNOLOGY, 2024-2032(USD MILLION) 67
      48. TABLE 47 GERMANY FIELD PROGRAMMABLE GATE ARRAY (FPGA) MARKET, BY TECHNOLOGY, 2024-2032(USD MILLION) 67
      49. TABLE 48 GERMANY FIELD PROGRAMMABLE GATE ARRAY (FPGA) MARKET, BY APPLICATION, 2024-2032(USD MILLION) 68
      50. TABLE 49 GERMANY FIELD PROGRAMMABLE GATE ARRAY (FPGA) MARKET, BY APPLICATION, 2024-2032(USD MILLION) 68
      51. TABLE 50 FRANCE FIELD PROGRAMMABLE GATE ARRAY (FPGA) MARKET, BY TECHNOLOGY, 2024-2032(USD MILLION) 69
      52. TABLE 51 FRANCE FIELD PROGRAMMABLE GATE ARRAY (FPGA) MARKET, BY TECHNOLOGY, 2024-2032(USD MILLION) 69
      53. TABLE 52 FRANCE FIELD PROGRAMMABLE GATE ARRAY (FPGA) MARKET, BY APPLICATION, 2024-2032(USD MILLION) 69
      54. TABLE 53 FRANCE FIELD PROGRAMMABLE GATE ARRAY (FPGA) MARKET, BY APPLICATION, 2024-2032(USD MILLION) 70
      55. TABLE 54 REST OF EUROPE FIELD PROGRAMMABLE GATE ARRAY (FPGA) MARKET, BY TECHNOLOGY, 2024-2032(USD MILLION) 70
      56. TABLE 55 REST OF EUROPE FIELD PROGRAMMABLE GATE ARRAY (FPGA) MARKET, BY TECHNOLOGY, 2024-2032(USD MILLION) 70
      57. TABLE 56 REST OF EUROPE FIELD PROGRAMMABLE GATE ARRAY (FPGA) MARKET, BY APPLICATION, 2024-2032(USD MILLION) 71
      58. TABLE 57 REST OF EUROPE FIELD PROGRAMMABLE GATE ARRAY (FPGA) MARKET, BY APPLICATION, 2024-2032(USD MILLION) 71
      59. TABLE 58 ASIA-PACIFIC FIELD PROGRAMMABLE GATE ARRAY (FPGA) MARKET SIZE, BY COUNTRY, 2024-2032(USD MILLION) 73
      60. TABLE 59 ASIA-PACIFIC FIELD PROGRAMMABLE GATE ARRAY (FPGA) MARKET SIZE, BY COUNTRY, 2024-2032(USD MILLION) 73
      61. TABLE 60 ASIA-PACIFIC FIELD PROGRAMMABLE GATE ARRAY (FPGA) MARKET, BY TECHNOLOGY, 2024-2032(USD MILLION) 74
      62. TABLE 61 ASIA-PACIFIC FIELD PROGRAMMABLE GATE ARRAY (FPGA) MARKET, BY TECHNOLOGY, 2024-2032(USD MILLION) 74
      63. TABLE 62 ASIA-PACIFIC FIELD PROGRAMMABLE GATE ARRAY (FPGA) MARKET, BY APPLICATION, 2024-2032(USD MILLION) 75
      64. TABLE 63 ASIA-PACIFIC FIELD PROGRAMMABLE GATE ARRAY (FPGA) MARKET, BY APPLICATION, 2024-2032(USD MILLION) 75
      65. TABLE 64 CHINA FIELD PROGRAMMABLE GATE ARRAY (FPGA) MARKET, BY TECHNOLOGY, 2024-2032(USD MILLION) 76
      66. TABLE 65 CHINA FIELD PROGRAMMABLE GATE ARRAY (FPGA) MARKET, BY TECHNOLOGY, 2024-2032(USD MILLION) 76
      67. TABLE 66 CHINA FIELD PROGRAMMABLE GATE ARRAY (FPGA) MARKET, BY APPLICATION, 2024-2032(USD MILLION) 76
      68. TABLE 67 CHINA FIELD PROGRAMMABLE GATE ARRAY (FPGA) MARKET, BY APPLICATION, 2024-2032(USD MILLION) 77
      69. TABLE 68 JAPAN FIELD PROGRAMMABLE GATE ARRAY (FPGA) MARKET, BY TECHNOLOGY, 2024-2032(USD MILLION) 77
      70. TABLE 69 JAPAN FIELD PROGRAMMABLE GATE ARRAY (FPGA) MARKET, BY TECHNOLOGY, 2024-2032(USD MILLION) 77
      71. TABLE 70 JAPAN FIELD PROGRAMMABLE GATE ARRAY (FPGA) MARKET, BY APPLICATION, 2024-2032(USD MILLION) 78
      72. TABLE 71 JAPAN FIELD PROGRAMMABLE GATE ARRAY (FPGA) MARKET, BY APPLICATION, 2024-2032(USD MILLION) 78
      73. TABLE 72 INDIA FIELD PROGRAMMABLE GATE ARRAY (FPGA) MARKET, BY TECHNOLOGY, 2024-2032(USD MILLION) 78
      74. TABLE 73 INDIA FIELD PROGRAMMABLE GATE ARRAY (FPGA) MARKET, BY TECHNOLOGY, 2024-2032(USD MILLION) 78
      75. TABLE 74 INDIA FIELD PROGRAMMABLE GATE ARRAY (FPGA) MARKET, BY APPLICATION, 2024-2032(USD MILLION) 79
      76. TABLE 75 INDIA FIELD PROGRAMMABLE GATE ARRAY (FPGA) MARKET, BY APPLICATION, 2024-2032(USD MILLION) 79
      77. TABLE 76 SOUTHEAST ASIA FIELD PROGRAMMABLE GATE ARRAY (FPGA) MARKET, BY TECHNOLOGY, 2024-2032(USD MILLION) 79
      78. TABLE 77 SOUTHEAST ASIA FIELD PROGRAMMABLE GATE ARRAY (FPGA) MARKET, BY TECHNOLOGY, 2024-2032(USD MILLION) 80
      79. TABLE 78 SOUTHEAST ASIA FIELD PROGRAMMABLE GATE ARRAY (FPGA) MARKET, BY APPLICATION, 2024-2032(USD MILLION) 80
      80. TABLE 79 SOUTHEAST ASIA FIELD PROGRAMMABLE GATE ARRAY (FPGA) MARKET, BY APPLICATION, 2024-2032(USD MILLION) 80
      81. TABLE 80 REST OF ASIA-PACIFIC FIELD PROGRAMMABLE GATE ARRAY (FPGA) MARKET, BY TECHNOLOGY, 2024-2032(USD MILLION) 81
      82. TABLE 81 REST OF ASIA-PACIFIC FIELD PROGRAMMABLE GATE ARRAY (FPGA) MARKET, BY TECHNOLOGY, 2024-2032(USD MILLION) 81
      83. TABLE 82 REST OF ASIA-PACIFIC FIELD PROGRAMMABLE GATE ARRAY (FPGA) MARKET, BY APPLICATION, 2024-2032(USD MILLION) 81
      84. TABLE 83 REST OF ASIA-PACIFIC FIELD PROGRAMMABLE GATE ARRAY (FPGA) MARKET, BY APPLICATION, 2024-2032(USD MILLION) 82
      85. TABLE 84 REST OF THE WORLD (ROW) FIELD PROGRAMMABLE GATE ARRAY (FPGA) MARKET SIZE, BY COUNTRY, 2024-2032(USD MILLION) 84
      86. TABLE 85 REST OF THE WORLD (ROW) FIELD PROGRAMMABLE GATE ARRAY (FPGA) MARKET SIZE, BY COUNTRY, 2024-2032(USD MILLION) 84
      87. TABLE 86 REST OF THE WORLD (ROW) FIELD PROGRAMMABLE GATE ARRAY (FPGA) MARKET, BY TECHNOLOGY, 2024-2032(USD MILLION) 85
      88. TABLE 87 REST OF THE WORLD (ROW) FIELD PROGRAMMABLE GATE ARRAY (FPGA) MARKET, BY TECHNOLOGY, 2024-2032(USD MILLION) 85
      89. TABLE 88 REST OF THE WORLD (ROW) FIELD PROGRAMMABLE GATE ARRAY (FPGA) MARKET, BY APPLICATION, 2024-2032(USD MILLION) 86
      90. TABLE 89 REST OF THE WORLD (ROW) FIELD PROGRAMMABLE GATE ARRAY (FPGA) MARKET, BY APPLICATION, 2024-2032(USD MILLION) 86
      91. TABLE 90 GLOBAL FIELD PROGRAMMABLE GATE ARRAY (FPGA) SHIPMENTS, BY REGION (2024-2032) K UNITS 88
      92. TABLE 91 GLOBAL FIELD PROGRAMMABLE GATE ARRAY (FPGA) SHIPMENTS, BY REGION (2024-2032) K UNITS 88
      93. TABLE 92 USA FIBER OPTIC CABLE PRODUCTION, CONSUMPTION, EXPORT, IMPORT (2024-2032) 89
      94. TABLE 93 USA FIBER OPTIC CABLE PRODUCTION, CONSUMPTION, EXPORT, IMPORT (2024-2032) 89
      95. TABLE 94 EUROPE FIBER OPTIC CABLE PRODUCTION, CONSUMPTION, EXPORT, IMPORT (2024-2032) 89
      96. TABLE 95 EUROPE FIBER OPTIC CABLE PRODUCTION, CONSUMPTION, EXPORT, IMPORT (2024-2032) 89
      97. TABLE 96 CHINA FIBER OPTIC CABLE PRODUCTION, CONSUMPTION, EXPORT, IMPORT (2024-2032) 90
      98. TABLE 97 CHINA FIBER OPTIC CABLE PRODUCTION, CONSUMPTION, EXPORT, IMPORT (2024-2032) 90
      99. TABLE 98 JAPAN FIBER OPTIC CABLE PRODUCTION, CONSUMPTION, EXPORT, IMPORT (2024-2032) 90
      100. TABLE 99 JAPAN FIBER OPTIC CABLE PRODUCTION, CONSUMPTION, EXPORT, IMPORT (2024-2032) 90
      101. TABLE 100 INDIA FIBER OPTIC CABLE PRODUCTION, CONSUMPTION, EXPORT, IMPORT (2024-2032) 91
      102. TABLE 101 INDIA FIBER OPTIC CABLE PRODUCTION, CONSUMPTION, EXPORT, IMPORT (2024-2032) 91
      103. TABLE 102 SOUTHEAST ASIA FIBER OPTIC CABLE PRODUCTION, CONSUMPTION, EXPORT, IMPORT (2024-2032) 91
      104. TABLE 103 SOUTHEAST ASIA FIBER OPTIC CABLE PRODUCTION, CONSUMPTION, EXPORT, IMPORT (2024-2032) 91
      105. TABLE 104 REST OF THE WORLD FIBER OPTIC CABLE PRODUCTION, CONSUMPTION, EXPORT, IMPORT (2024-2032) 92
      106. TABLE 105 REST OF THE WORLD FIBER OPTIC CABLE PRODUCTION, CONSUMPTION, EXPORT, IMPORT (2024-2032) 92
      107. TABLE 106 USA FPGA CONSUMPTION BY TECHNOLOGY (2024-2032) 94
      108. TABLE 107 USA FPGA CONSUMPTION BY TECHNOLOGY (2024-2032) 94
      109. TABLE 108 EUROPE FPGA CONSUMPTION BY TECHNOLOGY (2024-2032) 94
      110. TABLE 109 EUROPE FPGA CONSUMPTION BY TECHNOLOGY (2024-2032) 94
      111. TABLE 110 CHINA FPGA CONSUMPTION BY TECHNOLOGY (2024-2032) 95
      112. TABLE 111 CHINA FPGA CONSUMPTION BY TECHNOLOGY (2024-2032) 95
      113. TABLE 112 JAPAN FPGA CONSUMPTION BY TECHNOLOGY (2024-2032) 95
      114. TABLE 113 JAPAN FPGA CONSUMPTION BY TECHNOLOGY (2024-2032) 95
      115. TABLE 114 INDIA FPGA CONSUMPTION BY TECHNOLOGY (2024-2032) 96
      116. TABLE 115 INDIA FPGA CONSUMPTION BY TECHNOLOGY (2024-2032) 96
      117. TABLE 116 SOUTHEAST ASIA FPGA CONSUMPTION BY TECHNOLOGY (2024-2032) 96
      118. TABLE 117 SOUTHEAST ASIA FPGA CONSUMPTION BY TECHNOLOGY (2024-2032) 96
      119. TABLE 118 ROW FPGA CONSUMPTION BY TECHNOLOGY (2024-2032) 97
      120. TABLE 119 ROW FPGA CONSUMPTION BY TECHNOLOGY (2024-2032) 97
      121. TABLE 120 GLOBAL FPGA CONSUMPTION BY APPLICATION (2024-2032) K UNITS 97
      122. TABLE 121 GLOBAL FPGA CONSUMPTION BY APPLICATION (2024-2032) K UNITS 97 12 List of Figures
      123. FIGURE 1 GLOBAL FIELD PROGRAMMABLE GATE ARRAY (FPGA) KEY PLAYERS MARKET SHARE, 2017 (%) 13
      124. FIGURE 2 GLOBAL FIELD PROGRAMMABLE GATE ARRAY (FPGA) MARKET SIZE (MILLION USD) STATUS AND OUTLOOK (2024-2032) 16
      125. FIGURE 3 GLOBAL FIELD PROGRAMMABLE GATE ARRAY (FPGA) MARKET SIZE (MILLION USD) STATUS AND OUTLOOK (2024-2032) 20
      126. FIGURE 4 GLOBAL FIELD PROGRAMMABLE GATE ARRAY (FPGA) MARKET REVENUE (MILLION USD) COMPARISON BY REGION (2024-2032) 21
      127. FIGURE 5 NORTH AMERICAS FIELD PROGRAMMABLE GATE ARRAY (FPGA) MARKET REVENUE (MILLION USD) COMPARISON BY COUNTRY (2024-2032) 21
      128. FIGURE 6 USA FIELD PROGRAMMABLE GATE ARRAY (FPGA) MARKET SIZE (MILLION USD) AND GROWTH RATE (2024-2032) % 22
      129. FIGURE 7 EUROPE FIELD PROGRAMMABLE GATE ARRAY (FPGA) MARKET SIZE (MILLION USD) AND GROWTH RATE (2024-2032) % 22
      130. FIGURE 8 CHINA FIELD PROGRAMMABLE GATE ARRAY (FPGA) MARKET SIZE (MILLION USD) AND GROWTH RATE (2024-2032) % 23
      131. FIGURE 9 JAPAN FIELD PROGRAMMABLE GATE ARRAY (FPGA) MARKET SIZE (MILLION USD) AND GROWTH RATE (2024-2032) % 23
      132. FIGURE 10 INDIA FIELD PROGRAMMABLE GATE ARRAY (FPGA) MARKET SIZE (MILLION USD) AND GROWTH RATE (2024-2032) % 24
      133. FIGURE 11 SOUTHEAST ASIA FIELD PROGRAMMABLE GATE ARRAY (FPGA) MARKET SIZE (MILLION USD) AND GROWTH RATE (2024-2032) % 24
      134. FIGURE 12 GLOBAL FIELD PROGRAMMABLE GATE ARRAY (FPGA) REVENUE (MILLION USD) COMPARISON BY TECHNOLOGY (2024-2032) 26
      135. FIGURE 13 GLOBAL FIELD PROGRAMMABLE GATE ARRAY (FPGA) MARKET SHARE (%) BY TECHNOLOGY IN 2017 26
      136. FIGURE 14 GLOBAL FIELD PROGRAMMABLE GATE ARRAY (FPGA) REVENUE (MILLION USD) COMPARISON BY APPLICATION (2024-2032) 27
      137. FIGURE 15 GLOBAL FIELD PROGRAMMABLE GATE ARRAY (FPGA) MARKET SHARE (%) BY APPLICATION IN 2017 28
      138. FIGURE 16 TOP DOWN & BOTTOM UP APPROACH 33
      139. FIGURE 17 GLOBAL FIELD PROGRAMMABLE GATE ARRAY (FPGA) MARKET: MARKET STRUCTURE 34
      140. FIGURE 18 DROC ANALYSIS OF GLOBAL FIELD PROGRAMMABLE GATE ARRAY (FPGA) MARKET 38
      141. FIGURE 19 SUPPLY CHAIN ANALYSIS 42
      142. FIGURE 20 GLOBAL FIELD PROGRAMMABLE GATE ARRAY (FPGA) REVENUE MARKET VALUE, BY TECHNOLOGY, 2024-2032, (USD MILLION) 45
      143. FIGURE 21 GLOBAL FIELD PROGRAMMABLE GATE ARRAY (FPGA) REVENUE MARKET VALUE, BY TECHNOLOGY, 2024-2032, (USD MILLION) 46
      144. FIGURE 22 GLOBAL FIELD PROGRAMMABLE GATE ARRAY (FPGA) REVENUE MARKET VALUE, BY APPLICATION, 2024-2032, (USD MILLION) 49
      145. FIGURE 23 GLOBAL FIELD PROGRAMMABLE GATE ARRAY (FPGA) REVENUE MARKET VALUE, BY APPLICATION, 2024-2032, (USD MILLION) 50
      146. FIGURE 24 GLOBAL FIELD PROGRAMMABLE GATE ARRAY (FPGA) MARKET SIZE, BY REGION, 2024-2032(USD MILLION) 53
      147. FIGURE 25 NORTH AMERICA FIELD PROGRAMMABLE GATE ARRAY (FPGA) MARKET SIZE, BY COUNTRY, 2024-2032(USD MILLION) 55
      148. FIGURE 26 NORTH AMERICA FIELD PROGRAMMABLE GATE ARRAY (FPGA) MARKET, BY TECHNOLOGY, 2024-2032(USD MILLION) 56
      149. FIGURE 27 NORTH AMERICA FIELD PROGRAMMABLE GATE ARRAY (FPGA) MARKET, BY APPLICATION, 2024-2032(USD MILLION) 57
      150. FIGURE 28 EUROPE FIELD PROGRAMMABLE GATE ARRAY (FPGA) MARKET SIZE, BY COUNTRY, 2024-2032(USD MILLION) 63
      151. FIGURE 29 EUROPE FIELD PROGRAMMABLE GATE ARRAY (FPGA) MARKET, BY TECHNOLOGY, 2024-2032(USD MILLION) 64
      152. FIGURE 30 EUROPE FIELD PROGRAMMABLE GATE ARRAY (FPGA) MARKET, BY APPLICATION, 2024-2032(USD MILLION) 65
      153. FIGURE 31 ASIA-PACIFIC FIELD PROGRAMMABLE GATE ARRAY (FPGA) MARKET SIZE, BY COUNTRY, 2024-2032(USD MILLION) 73
      154. FIGURE 32 ASIA-PACIFIC FIELD PROGRAMMABLE GATE ARRAY (FPGA) MARKET, BY TECHNOLOGY, 2024-2032(USD MILLION) 74
      155. FIGURE 33 ASIA-PACIFIC FIELD PROGRAMMABLE GATE ARRAY (FPGA) MARKET, BY APPLICATION, 2024-2032(USD MILLION) 75
      156. FIGURE 34 REST OF THE WORLD (ROW) FIELD PROGRAMMABLE GATE ARRAY (FPGA) MARKET SIZE, BY COUNTRY, 2024-2032(USD MILLION) 84
      157. FIGURE 35 REST OF THE WORLD (ROW) FIELD PROGRAMMABLE GATE ARRAY (FPGA) MARKET, BY TECHNOLOGY, 2024-2032(USD MILLION) 85
      158. FIGURE 36 REST OF THE WORLD (ROW) FIELD PROGRAMMABLE GATE ARRAY (FPGA) MARKET, BY APPLICATION, 2024-2032(USD MILLION) 86

    FPGA Security Market Segmentation

    FPGA Security Market Configuration Outlook (USD Billion, 2018-2032)

    • Low-end FPGA
    • Mid-Range FPGA
    • High-End FPGA

    FPGA Security Market Node Size Outlook (USD Billion, 2018-2032)

    • Less than 28nm
    • 28-90 nm
    • More than 90nm

    FPGA Security Market Technology Outlook (USD Billion, 2018-2032)

    • SRAM
    • Flash
    • Antifuse

    FPGA Security Market Application Outlook (USD Billion, 2018-2032)

    • FPGA synthesis Flow
    • Applied cryptography
    • Algorithmic cryptographic security
    • Others

    FPGA Security Market Regional Outlook (USD Billion, 2018-2032)

    • North America Outlook (USD Billion, 2018-2032)

      • North America FPGA Security Market by Configuration
    • Low-end FPGA
    • Mid-Range FPGA
    • High-End FPGA
      • North America FPGA Security Market by Node Size

    • Less than 28nm
    • 28-90 nm
    • More than 90nm
    • North America FPGA Security Market by Technology
    • SRAM
    • Flash
    • Antifuse
    • North America FPGA Security Market by Application
    • FPGA synthesis Flow
    • Applied cryptography
    • Algorithmic cryptographic security
    • Others
      • US Outlook (USD Billion, 2018-2032)

      • US FPGA Security Market by Configuration
        • Low-end FPGA
        • Mid-Range FPGA
        • High-End FPGA
      • US FPGA Security Market by Node Size
        • Less than 28nm
        • 28-90 nm
        • More than 90nm
      • US FPGA Security Market by Technology
    • SRAM
    • Flash
    • Antifuse
      • US FPGA Security Market by Application
    • FPGA synthesis Flow
    • Applied cryptography
    • Algorithmic cryptographic security
    • Others
      • CANADA Outlook (USD Billion, 2018-2032)

      • CANADA FPGA Security Market by Configuration
        • Low-end FPGA
        • Mid-Range FPGA
        • High-End FPGA
      • CANADA FPGA Security Market by Node Size
        • Less than 28nm
        • 28-90 nm
        • More than 90nm
      • CANADA FPGA Security Market by Technology
    • SRAM
    • Flash
    • Antifuse
      • CANADA FPGA Security Market by Application
    • FPGA synthesis Flow
    • Applied cryptography
    • Algorithmic cryptographic security
    • Others
      • Europe Outlook (USD Billion, 2018-2032)

      • Europe FPGA Security Market by Configuration
        • Low-end FPGA
        • Mid-Range FPGA
        • High-End FPGA
      • Europe FPGA Security Market by Node Size
        • Less than 28nm
        • 28-90 nm
        • More than 90nm
      • Europe FPGA Security Market by Technology
    • SRAM
    • Flash
    • Antifuse
      • Europe FPGA Security Market by Application
    • FPGA synthesis Flow
    • Applied cryptography
    • Algorithmic cryptographic security
    • Others
      • Germany Outlook (USD Billion, 2018-2032)

      • Germany FPGA Security Market by Configuration
        • Low-end FPGA
        • Mid-Range FPGA
        • High-End FPGA
      • Germany FPGA Security Market by Node Size
        • Less than 28nm
        • 28-90 nm
        • More than 90nm
      • Germany FPGA Security Market by Technology
    • SRAM
    • Flash
    • Antifuse
      • Germany FPGA Security Market by Application
    • FPGA synthesis Flow
    • Applied cryptography
    • Algorithmic cryptographic security
    • Others
      • France Outlook (USD Billion, 2018-2032)

      • France FPGA Security Market by Configuration
        • Low-end FPGA
        • Mid-Range FPGA
        • High-End FPGA
      • France FPGA Security Market by Node Size
        • Less than 28nm
        • 28-90 nm
      • France FPGA Security Market by Technology
    • SRAM
    • Flash
    • Antifuse
      • France FPGA Security Market by Application
    • FPGA synthesis Flow
    • Applied cryptography
    • Algorithmic cryptographic security
    • Others
      • UK Outlook (USD Billion, 2018-2032)

      • UK FPGA Security Market by Configuration
        • Low-end FPGA
        • Mid-Range FPGA
        • High-End FPGA
      • UK FPGA Security Market by Node Size
        • Less than 28nm
        • 28-90 nm
        • More than 90nm
      • UK FPGA Security Market by Technology
    • SRAM
    • Flash
    • Antifuse
      • UK FPGA Security Market by Application
    • FPGA synthesis Flow
    • Applied cryptography
    • Algorithmic cryptographic security
    • Others
      • ITALY Outlook (USD Billion, 2018-2032)

      • ITALY FPGA Security Market by Configuration
        • Low-end FPGA
        • Mid-Range FPGA
        • High-End FPGA
      • ITALY FPGA Security Market by Node Size
        • Less than 28nm
        • 28-90 nm
        • More than 90nm
      • ITALY FPGA Security Market by Technology
    • SRAM
    • Flash
    • Antifuse
      • ITALY FPGA Security Market by Application
    • FPGA synthesis Flow
    • Applied cryptography
    • Algorithmic cryptographic security
    • Others
      • SPAIN Outlook (USD Billion, 2018-2032)

      • Spain FPGA Security Market by Configuration
        • Low-end FPGA
        • Mid-Range FPGA
        • High-End FPGA
      • Spain FPGA Security Market by Node Size
        • Less than 28nm
        • 28-90 nm
        • More than 90nm
      • Spain FPGA Security Market by Technology
    • SRAM
    • Flash
    • Antifuse
      • Spain FPGA Security Market by Application
    • FPGA synthesis Flow
    • Applied cryptography
    • Algorithmic cryptographic security
    • Others
      • Rest Of Europe Outlook (USD Billion, 2018-2032)

      • Rest Of Europe FPGA Security Market by Configuration
        • Low-end FPGA
        • Mid-Range FPGA
        • High-End FPGA
      • REST OF EUROPE FPGA Security Market by Node Size
        • Less than 28nm
        • 28-90 nm
        • More than 90nm
      • REST OF EUROPE FPGA Security Market by Technology
    • SRAM
    • Flash
    • Antifuse
    REST OF EUROPE FPGA Security Market by Application
    • FPGA synthesis Flow
    • Applied cryptography
    • Algorithmic cryptographic security
    • Others
    • Asia-Pacific Outlook (USD Billion, 2018-2032)

      • Asia-Pacific FPGA Security Market by Configuration
        • Low-end FPGA
        • Mid-Range FPGA
        • High-End FPGA
      • Asia-Pacific FPGA Security Market by Node Size
        • Less than 28nm
        • 28-90 nm
        • More than 90nm
      • Asia-Pacific FPGA Security Market by Technology
    • SRAM
    • Flash
    • Antifuse
      • Asia-Pacific FPGA Security Market by Application
    • FPGA synthesis Flow
    • Applied cryptography
    • Algorithmic cryptographic security
    • Others
      • China Outlook (USD Billion, 2018-2032)

      • China FPGA Security Market by Configuration
        • Low-end FPGA
        • Mid-Range FPGA
        • High-End FPGA
      • China FPGA Security Market by Node Size
        • Less than 28nm
        • 28-90 nm
        • More than 90nm
      • China FPGA Security Market by Technology
    • SRAM
    • Flash
    • Antifuse
      • China FPGA Security Market by Application
    • FPGA synthesis Flow
    • Applied cryptography
    • Algorithmic cryptographic security
    • Others
      • Japan Outlook (USD Billion, 2018-2032)

      • Japan FPGA Security Market by Configuration
        • Low-end FPGA
        • Mid-Range FPGA
        • High-End FPGA
      • Japan FPGA Security Market by Node Size
        • Less than 28nm
        • 28-90 nm
        • More than 90nm
      • Japan FPGA Security Market by Technology
    • SRAM
    • Flash
    • Antifuse
      • Japan FPGA Security Market by Application
    • FPGA synthesis Flow
    • Applied cryptography
    • Algorithmic cryptographic security
    • Others
      • India Outlook (USD Billion, 2018-2032)

      • India FPGA Security Market by Configuration
        • Low-end FPGA
        • Mid-Range FPGA
        • High-End FPGA
      • India FPGA Security Market by Node Size
        • Less than 28nm
        • 28-90 nm
        • More than 90nm
      • India FPGA Security Market by Technology
    • SRAM
    • Flash
    • Antifuse
      • India FPGA Security Market by Application
    • FPGA synthesis Flow
    • Applied cryptography
    • Algorithmic cryptographic securitys
    • Others
      • Australia Outlook (USD Billion, 2018-2032)

      • Australia FPGA Security Market by Configuration
        • Low-end FPGA
        • Mid-Range FPGA
        • High-End FPGA
      • Australia FPGA Security Market by Node Size
        • Less than 28nm
        • 28-90 nm
        • More than 90nm
      • Australia FPGA Security Market by Technology
    • SRAM
    • Flash
    • Antifuse
      • Australia FPGA Security Market by Application
    • FPGA synthesis Flow
    • Applied cryptography
    • Algorithmic cryptographic security
    • Others
      • Rest of Asia-Pacific Outlook (USD Billion, 2018-2032)

      • Rest of Asia-Pacific FPGA Security Market by Configuration
        • Low-end FPGA
        • Mid-Range FPGA
        • High-End FPGA
      • Rest of Asia-Pacific FPGA Security Market by Node Size
        • Less than 28nm
        • 28-90 nm
        • More than 90nm
      • Rest of Asia-Pacific FPGA Security Market by Technology
    • SRAM
    • Flash
    • Antifuse
      • Rest of Asia-Pacific FPGA Security Market by Application
    • FPGA synthesis Flow
    • Applied cryptography
    • Algorithmic cryptographic security
    • Others
    • Rest of the World Outlook (USD Billion, 2018-2032)

      • Rest of the World FPGA Security Market by Configuration
        • Low-end FPGA
        • Mid-Range FPGA
        • High-End FPGA
      • Rest of the World FPGA Security Market by Node Size
        • Less than 28nm
        • 28-90 nm
        • More than 90nm
      • Rest of the World FPGA Security Market by Technology
    • SRAM
    • Flash
    • Antifuse
      • Rest of the World FPGA Security Market by Application
    • FPGA synthesis Flow
    • Applied cryptography
    • Algorithmic cryptographic security
    • Others
      • Middle East Outlook (USD Billion, 2018-2032)

      • Middle East FPGA Security Market by Configuration
        • Low-end FPGA
        • Mid-Range FPGA
        • High-End FPGA
      • Middle East FPGA Security Market by Node Size
        • Less than 28nm
        • 28-90 nm
        • More than 90nm
      • Middle East FPGA Security Market by Technology
    • SRAM
    • Flash
    • Antifuse
      • Middle East FPGA Security Market by Application
    • FPGA synthesis Flow
    • Applied cryptography
    • Algorithmic cryptographic security
    • Others
      • Africa Outlook (USD Billion, 2018-2032)

      • Africa FPGA Security Market by Configuration
        • Low-end FPGA
        • Mid-Range FPGA
        • High-End FPGA
      • Africa FPGA Security Market by Node Size
        • Less than 28nm
        • 28-90 nm
        • More than 90nm
      • Africa FPGA Security Market by Technology
    • SRAM
    • Flash
    • Antifuse
      • Africa FPGA Security Market by Application
    • FPGA synthesis Flow
    • Applied cryptography
    • Algorithmic cryptographic security
    • Others
      • Latin America Outlook (USD Billion, 2018-2032)

      • Latin America FPGA Security Market by Configuration
        • Low-end FPGA
        • Mid-Range FPGA
        • High-End FPGA
      • Latin America FPGA Security Market by Node Size
        • Less than 28nm
        • 28-90 nm
        • More than 90nm
      • Latin America FPGA Security Market by Technology
    • SRAM
    • Flash
    • Antifuse
      • Latin America FPGA Security Market by Application
    • FPGA synthesis Flow
    • Applied cryptography
    • Algorithmic cryptographic security
    • Others
    Infographic

    Free Sample Request

    Kindly complete the form below to receive a free sample of this Report

    Get Free Sample

    Customer Strories

    “I am very pleased with how market segments have been defined in a relevant way for my purposes (such as "Portable Freezers & refrigerators" and "last-mile"). In general the report is well structured. Thanks very much for your efforts.”

    Victoria Milne

    Founder
    Case Study
    Chemicals and Materials