
Demand Response Management System Market Share
ID: MRFR/E&P/5231-HCR
100 Pages
October 2025
Demand Response Management System Market Research Report By Application (Commercial, Industrial, Residential, Utility), By End User (Electricity Providers, Commercial Establishments, Industrial Facilities, Government), By Deployment Type (On-Premise, Cloud-Based), By Component (Solutions, Services) and By Regional (North America, Europe, South America, Asia Pacific, Middle East and Africa) - Fo...

Market Summary
As per Market Research Future Analysis, the Demand Response Management System Market was valued at 53.66 USD Billion in 2024 and is projected to grow from 53.66 USD Billion in 2024 to 76.69 USD Billion by 2035, reflecting a CAGR of 3.30% from 2025 to 2035. The market is driven by rising electricity consumption, government incentives, and advancements in smart grid technologies, which enhance energy management and efficiency.
Key Market Trends & Highlights
The Demand Response Management System Market is witnessing significant growth due to various trends.
- Market Size in 2024: 53.66 USD Billion; projected to reach 76.69 USD Billion by 2035. Commercial segment leads with a valuation of 2.5 USD Billion in 2023, expected to rise to 5.14 USD Billion by 2032. North America dominates the market with a valuation of 2.5 USD Billion in 2023, projected to grow to 5.15 USD Billion by 2032. Government incentives and regulatory frameworks are driving investments in demand response technologies.
Market Size & Forecast
| 2024 Market Size | USD 53.66 Billion |
| 2035 Market Size | USD 76.69 Billion |
| CAGR (2024-2035) | 3.30% |
| Largest Regional Market Share in 2023 | North America. |
Major Players
<p>Cpower, Siemens, GridPoint, Virtual Power Solutions, EnerNOC, Schneider Electric, ABB, EnergyHub, Rocky Mountain Institute, Flexitricity, Johnson Controls, Honeywell, Control4, Voltus.</p>
Market Trends
The Demand Response Management System industry continues to show promising growth due to the energy management strategies put in place by governments and regulatory organizations. Managing the maximum possible energy load not only enables consumers to practice energy conservation, but also allows utilities to relieve peak load. There has also been a greater focus on the development of smart grid technologies which further aids in the integration of demand response systems and improves overall energy management.
With the IoT era and smart homes on the rise, the opportunities in this field are still considerable. Tech companies may be good partners for manufacturers and service providers to be able to create more effective solutions and tools that enhance accessibility and user friendliness of demand response programs. Moreover, the trend of purchasing electric cars, not only for businesses but households as well will allow for incremental growth of the market by further expanding the initiatives related to demand response programs.
Satisfying consumers by eliminating complications through ease of use can help capture this market potential in the long run. The demand for automation in response systems has also tended to increase lately.
There is an increasing trend among organizations to adopt software that combines various tools for data analysis. This automation leads to rapid decision-making and more efficient energy utilization. In addition, there is a growing concern for the environment and climate change which is driving investment into technologies that manage power demand fluctuations. With the increasing use of energy storage systems, there is also scope for greater demand-side management to align with electricity use to create a supply system that is more responsive to fluctuations in demand.
<p>The increasing integration of renewable energy sources into the grid is driving the adoption of Demand Response Management Systems, which enhance grid reliability and optimize energy consumption.</p>
U.S. Department of Energy
Demand Response Management System Market Market Drivers
Market Growth Projections
The Global Demand Response Management System Market Industry is projected to experience substantial growth over the coming years. With an expected market value of 6.43 USD Billion in 2024, the industry is on a trajectory towards reaching 15.7 USD Billion by 2035. This growth is indicative of the increasing adoption of demand response technologies and strategies across various sectors. The anticipated CAGR of 8.44% from 2025 to 2035 highlights the potential for innovation and expansion within the market. As stakeholders recognize the importance of demand response in optimizing energy consumption, the industry is likely to evolve significantly.
Consumer Awareness and Engagement
Rising consumer awareness regarding energy consumption and sustainability is driving the Global Demand Response Management System Market Industry. As individuals become more conscious of their energy usage, they are increasingly seeking ways to reduce costs and minimize their environmental impact. This trend is evident in the growing number of residential demand response programs that empower consumers to manage their energy consumption actively. Utilities are leveraging this awareness by offering incentives for participation in demand response initiatives. This engagement is likely to enhance market growth, as more consumers recognize the benefits of demand response in achieving energy savings and sustainability.
Regulatory Support and Incentives
Government policies and incentives play a crucial role in shaping the Global Demand Response Management System Market Industry. Various jurisdictions are offering financial incentives and regulatory frameworks that encourage the implementation of demand response programs. For example, in California, the state has established programs that provide financial rewards to consumers who participate in demand response initiatives. Such regulatory support not only stimulates market growth but also fosters a culture of energy conservation among consumers. As these policies gain traction globally, the demand response market is poised for robust expansion, further solidifying its importance in energy management.
Growing Demand for Energy Efficiency
The Global Demand Response Management System Market Industry is experiencing a surge in demand driven by the increasing emphasis on energy efficiency. Governments worldwide are implementing stringent regulations aimed at reducing energy consumption and greenhouse gas emissions. For instance, the European Union has set ambitious targets for energy efficiency, which encourages the adoption of demand response strategies. This trend is reflected in the projected market value, which is expected to reach 6.43 USD Billion in 2024. As organizations seek to optimize energy use, demand response systems become essential tools for managing consumption effectively.
Advancements in Smart Grid Technology
Technological advancements in smart grid infrastructure are significantly influencing the Global Demand Response Management System Market Industry. The integration of advanced metering infrastructure and real-time data analytics enables utilities to better manage energy loads and respond to demand fluctuations. For example, in the United States, the deployment of smart meters has facilitated more dynamic pricing models, encouraging consumers to adjust their energy usage during peak periods. This technological evolution is expected to contribute to the market's growth, with a projected CAGR of 8.44% from 2025 to 2035, ultimately enhancing grid reliability and efficiency.
Increased Adoption of Renewable Energy Sources
The transition towards renewable energy sources is a pivotal driver for the Global Demand Response Management System Market Industry. As countries strive to meet renewable energy targets, the variability of these energy sources necessitates effective demand response strategies. For instance, in Germany, the integration of solar and wind energy has led to the development of demand response programs that help balance supply and demand. This shift not only supports grid stability but also promotes consumer engagement in energy management. The market is anticipated to grow significantly, reaching 15.7 USD Billion by 2035, reflecting the critical role of demand response in renewable energy integration.
Market Segment Insights
Demand Response Management System Market Application Insights
<p>The Demand Response Management System Market, particularly within the Application segment, is witnessing substantial growth as it provides solutions to optimize energy consumption across various sectors. In 2023, the market is valued at 5.96 USD Billion and is projected to double in size by 2032. This growth reflects the increasing need for energy efficiency and reliable response techniques across different applications. The market is divided into several categories including Commercial, Industrial, Residential, and Utility segments, each significantly contributing to the overall market dynamics.</p>
<p>Among these, the Commercial segment holds a majority share with a valuation of 2.5 USD Billion in 2023, expected to rise to 5.14 USD Billion by 2032. The commercial sector's importance lies in its widespread implementation of demand response programs as businesses focus on reducing operational costs and minimizing energy usage during peak periods.</p>
<p>The Industrial segment also plays a vital role with a market valuation of 1.5 USD Billion in 2023, projected to grow to 3.12 USD Billion by 2032. Industries, due to their energy-intensive operations, often engage in demand response strategies to mitigate their energy expenditure, which exemplifies their significance in the market. However, the Residential segment, with a valuation of 1.45 USD Billion in 2023 and a predicted increase to 3.0 USD Billion by 2032, shows the potential of demand response initiatives within households.</p>
Demand Response Management System Market End User Insights
<p>The Demand Response Management System Market is set to witness substantial growth influenced by various end users, playing a key role in its trajectory. In 2023, the revenue of this market is valued at 5.96 billion USD, with a promising increase expected over the following years. Among the prominent end users, Electricity Providers significantly dominate, utilizing demand response strategies to manage peak loads efficiently, thus enhancing grid reliability and stability. Commercial Establishments represent a vital sector, as they adopt these systems to optimize energy consumption and reduce operational costs.</p>
<p>Industrial Facilities also show significant engagement in the Demand Response Management, driven by the need to enhance process efficiency and sustainability practices. Additionally, the Government sector increasingly collaborates in promoting demand response initiatives, aligning with energy-saving policies and regulations. The overall Demand Response Management System Market segmentation reflects a diverse landscape, presenting various opportunities for innovation and energy management solutions across these key end users.</p>
Demand Response Management System Market Deployment Type Insights
<p>The Demand Response Management System Market is poised for substantial growth, with significant attention on the Deployment Type segment, particularly in On-Premise and Cloud-Based solutions. The market was valued at 5.96 USD Billion in 2023 and is projected to show robust demand as smart technologies transform energy management practices. The On-Premise deployment has been traditionally favored by large enterprises due to data security and regulatory compliance, making it a significant player in the market. Conversely, the Cloud-Based deployment is gaining traction, driven by its scalability, cost-effectiveness, and ease of updates, catering to a broader range of businesses, including SMEs.</p>
<p>Market trends indicate a shift towards hybrid models, leveraging both deployment types to enhance operational efficiencies. Therefore, the growth drivers include technological advancements, regulatory support for clean energy initiatives, and increasing adoption of IoT, propelling the Demand Response Management System Market revenue. Furthermore, challenges such as cybersecurity concerns and integration complexities may impact deployment choices. Nonetheless, opportunities arise as companies look to optimize energy consumption and reduce costs, fostering growth in both On-Premise and Cloud-Based deployments, thus diversifying the Demand Response Management System Market segmentation.</p>
Demand Response Management System Market Component Insights
<p>The Demand Response Management System Market is poised for growth in the Component segment, reflecting a total market valuation of 5.96 USD Billion in 2023. Broadly categorized into components such as Solutions and Services, this market is witnessing trends driven by increasing energy efficiency needs and grid reliability. Solutions are crucial as they empower businesses to manage and optimize their energy consumption during peak times, thus enhancing operational efficiency. This segment dominates the market as organizations are increasingly adopting these technologies to meet regulatory requirements and improve sustainability.</p>
<p>On the other hand, Services are significant, providing essential support, maintenance, and consulting that facilitate the successful implementation of Demand Response strategies. The demand for these services is supported by rising energy costs and the need for advanced analytics and expertise in energy management. As the emphasis on clean energy and resource optimization intensifies, the Demand Response Management System Market segmentation reflected in this Component focus underscores the pivotal role both Solutions and Services play in shaping energy management landscapes.</p>
Get more detailed insights about Demand Response Management System Market Research Report - Global Forecast till 2032
Regional Insights
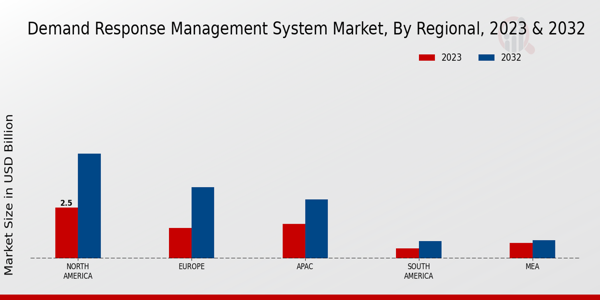
The Demand Response Management System Market is projected to attain notable growth across various regions, with the market revenue valued at 5.96 USD Billion in 2023. North America leads the market with a valuation of 2.5 USD Billion, expected to grow significantly to 5.15 USD Billion by 2032, highlighting its dominance in this industry. Europe follows with a significant valuation of 1.5 USD Billion in 2023, which will rise to 3.5 USD Billion, emphasizing its vital role in adopting effective response strategies.
The APAC region, valued at 1.7 USD Billion in 2023, is anticipated to expand to 2.9 USD Billion, driven by rapid urbanization and increased energy consumption.
South America, with a value of 0.5 USD Billion currently, is gradually growing to 0.85 USD Billion, indicating a developing interest in energy management solutions. Meanwhile, the MEA segment, valued at 0.76 USD Billion, is projected to reach 0.91 USD Billion, reflecting emerging opportunities in energy efficiency amidst regional challenges. The overall Demand Response Management System Market statistics showcase a diverse regional landscape with varying growth drivers and challenges, presenting opportunities for stakeholders in this evolving industry.
Source: Primary Research, Secondary Research, Market Research Future Database and Analyst Review
Key Players and Competitive Insights
The Demand Response Management System Market is a dynamic sector that has gained significant traction in recent years as the need for efficient energy management continues to grow. This market plays a crucial role in enabling utilities and grid operators to optimize energy consumption, particularly during peak demand periods. The competitive landscape is highly influenced by technological advancements, regulatory frameworks, and the increasing adoption of renewable energy sources, which have made demand response a pivotal solution for balancing supply and demand.
As various stakeholders aim to enhance their operational efficiency and sustainability practices, the market is becoming more saturated with innovative solutions aimed at improving demand-side management. Companies are continually striving to differentiate themselves through advanced analytics, customer engagement strategies, and integration capabilities with other energy management systems.
Cpower has positioned itself as a formidable player in the Demand Response Management System Market, leveraging its strengths in technology and customer service. The company has developed a strong portfolio of demand response programs that cater to diverse sectors, allowing it to effectively engage and retain customers. Cpower’s expertise in program design and implementation has enabled it to tailor solutions that meet the specific needs of both commercial and industrial clients. Furthermore, Cpower's commitment to compliance and regulatory alignment ensures that its offerings meet stringent industry standards, enhancing its reputation in the market.
With a robust network of partnerships and a customer-centric approach, Cpower continues to expand its presence, capitalizing on the growing trend of energy efficiency and grid reliability.
Siemens, a recognized leader in the Demand Response Management System Market, brings a wealth of experience and innovation to the table. The company integrates cutting-edge technology into its demand response solutions, making them highly adaptable to the evolving energy landscape. Siemens benefits from its extensive footprint, allowing it to serve a diverse range of markets and establish strong relationships with utility companies and end-users. The company's prowess in automation and analytics sets it apart, as it provides actionable insights that help customers make informed decisions regarding their energy consumption.
Siemens’ ongoing investments in research and development showcase its dedication to advancing smart energy solutions, solidifying its position as a key player in shaping the future of demand response management and contributing to a more sustainable energy ecosystem.
Key Companies in the Demand Response Management System Market market include


Industry Developments
Recent developments in the Demand Response Management System Market indicate a strong growth trajectory, driven by increasing energy costs and a push for sustainability in energy consumption. Companies like Cpower, Siemens, and EnerNOC are actively involved in enhancing their offerings, focusing on advanced technologies that streamline energy management and encourage consumer participation in demand response programs. The market has witnessed heightened interest from organizations like Honeywell and Schneider Electric, which have been expanding their solutions to incorporate smart technology and IoT capabilities. Additionally, GridPoint and EnerNOC have seen strategic partnerships aimed at improving service delivery and customer engagement.
In terms of mergers and acquisitions, companies like ABB and Control4 have engaged in discussions for potential collaborations to strengthen their market positioning. The growing recognition of demand response as a critical component of energy management strategies is further fueling investment in this space, as highlighted by the economic impact of policy changes favoring grid resilience and efficiency. As firms such as Voltus and Flexitricity innovate, the market is evolving rapidly, creating opportunities for both new entrants and established players to thrive.
Future Outlook
Demand Response Management System Market Future Outlook
<p>The Demand Response Management System Market is projected to grow at an 3.30% CAGR from 2025 to 2035, driven by technological advancements and regulatory support.</p>
New opportunities lie in:
- <p>Develop AI-driven analytics tools for enhanced demand forecasting. Expand partnerships with utility companies to optimize energy distribution. Invest in consumer engagement platforms to increase participation in demand response programs.</p>
<p>By 2035, the market is poised to achieve substantial growth, reflecting its critical role in energy management.</p>
Market Segmentation
Demand Response Management System Market End User Outlook
- Electricity Providers
- Commercial Establishments
- Industrial Facilities
- Government
Demand Response Management System Market Regional Outlook
- North America
- Europe
- South America
- Asia Pacific
- Middle East and Africa
Demand Response Management System Market Component Outlook
- Solutions
- Services
Demand Response Management System Market Application Outlook
- Commercial
- Industrial
- Residential
- Utility
Demand Response Management System Market Deployment Type Outlook
- On-Premise
- Cloud-Based
Report Scope
| Report Attribute/Metric | Details |
| Market Size 2035 | 76.69 (USD Billion) |
| Compound Annual Growth Rate (CAGR) | 3.30% (2025 - 2035) |
| Report Coverage | Revenue Forecast, Competitive Landscape, Growth Factors, and Trends |
| Base Year | 2024 |
| Market Forecast Period | 2025 - 2035 |
| Historical Data | 2019 - 2023 |
| Market Forecast Units | USD Billion |
| Key Companies Profiled | Cpower, Siemens, GridPoint, Virtual Power Solutions, EnerNOC, Schneider Electric, ABB, EnergyHub, Rocky Mountain Institute, Flexitricity, Johnson Controls, Honeywell, Control4, Voltus |
| Segments Covered | Application, End User, Deployment Type, Component, Regional |
| Key Market Opportunities | Increased renewable energy integration, Regulatory incentives for demand response, Smart grid technology adoption, Growing energy consumer engagement, Advancements in IoT applications. |
| Key Market Dynamics | Regulatory incentives, Grid flexibility demand, Renewable energy integration, Consumer engagement, Technology advancements |
| Countries Covered | North America, Europe, APAC, South America, MEA |
| Market Size 2024 | 53.66 (USD Billion) |
| Market Size 2025 | 55.43 (USD Billion) |
Market Highlights
Author
Latest Comments
John Doe
john@example.com
This is a great article! Really helped me understand the topic better.
Posted on July 23, 2025, 10:15
AM
Jane Smith
jane@domain.com
Thanks for sharing this. I’ve bookmarked it for later reference.
Posted on July 22, 2025, 7:45
PM
FAQs
What is the projected market size of the Demand Response Management System Market by 2032?
The Demand Response Management System Market is expected to be valued at 12.31 USD Billion by 2032.
What is the expected CAGR for the Demand Response Management System Market from 2024 to 2032?
The Demand Response Management System Market is anticipated to grow at a CAGR of 8.39% from 2024 to 2032.
Which region holds the largest market share in the Demand Response Management System Market in 2023?
North America holds the largest market share with a valuation of 2.5 USD Billion in 2023.
What will the market value of the Commercial application segment be by 2032?
The Commercial application segment is projected to be valued at 5.14 USD Billion by 2032.
How much is the Industrial application segment valued in 2023?
In 2023, the Industrial application segment is valued at 1.5 USD Billion.
What is the estimated market value for the Residential application segment by 2032?
The Residential application segment is expected to reach a market value of 3.0 USD Billion by 2032.
Who are the key players in the Demand Response Management System Market?
Major players in the market include Cpower, Siemens, ABB, Honeywell, and Schneider Electric.
What is the estimated market size for the Utility application segment by 2032?
The Utility application segment is projected to reach a market value of 1.05 USD Billion by 2032.
What is the market value of the Europe region for the Demand Response Management System Market in 2032?
Europe's market value for the Demand Response Management System Market is expected to be 3.5 USD Billion by 2032.
What challenges may impact the growth of the Demand Response Management System Market?
Challenges may include regulatory uncertainties and varying adoption rates across regions.
-
Table of Contents
-
Executive Summary
- Market Overview
- Key Findings
- Market Segmentation
- Competitive Landscape
- Challenges and Opportunities
- Future Outlook
-
Market Introduction
- Definition
-
Scope of the Study
- Research Objective
- Assumption
- Limitations
-
Research Methodology
- Overview
- Data Mining
- Secondary Research
-
Primary Research
- Primary Interviews and Information Gathering Process
- Breakdown of Primary Respondents
- Forecasting Model
-
Market Size Estimation
- Bottom-up Approach
- Top-Down Approach
- Data Triangulation
- Validation
-
MARKET DYNAMICS
- Overview
- Drivers
- Restraints
- Opportunities
-
MARKET FACTOR ANALYSIS
- Value chain Analysis
-
Porter's Five Forces Analysis
- Bargaining Power of Suppliers
- Bargaining Power of Buyers
- Threat of New Entrants
- Threat of Substitutes
- Intensity of Rivalry
-
COVID-19 Impact Analysis
- Market Impact Analysis
- Regional Impact
- Opportunity and Threat Analysis
-
DEMAND RESPONSE MANAGEMENT SYSTEM MARKET, BY APPLICATION (USD BILLION)
- Commercial
- Industrial
- Residential
- Utility
-
DEMAND RESPONSE MANAGEMENT SYSTEM MARKET, BY END USER (USD BILLION)
- Electricity Providers
- Commercial Establishments
- Industrial Facilities
- Government
-
DEMAND RESPONSE MANAGEMENT SYSTEM MARKET, BY DEPLOYMENT TYPE (USD BILLION)
- On-Premise
- Cloud-Based
-
DEMAND RESPONSE MANAGEMENT SYSTEM MARKET, BY COMPONENT (USD BILLION)
- Solutions
- Services
-
DEMAND RESPONSE MANAGEMENT SYSTEM MARKET, BY REGIONAL (USD BILLION)
-
North America
- US
- Canada
-
Europe
- Germany
- UK
- France
- Russia
- Italy
- Spain
- Rest of Europe
-
APAC
- China
- India
- Japan
- South Korea
- Malaysia
- Thailand
- Indonesia
- Rest of APAC
-
South America
- Brazil
- Mexico
- Argentina
- Rest of South America
-
MEA
- GCC Countries
- South Africa
- Rest of MEA
-
North America
-
Competitive Landscape
- Overview
- Competitive Analysis
- Market share Analysis
- Major Growth Strategy in the Demand Response Management System Market
- Competitive Benchmarking
- Leading Players in Terms of Number of Developments in the Demand Response Management System Market
-
Key developments and growth strategies
- New Product Launch/Service Deployment
- Merger & Acquisitions
- Joint Ventures
-
Major Players Financial Matrix
- Sales and Operating Income
- Major Players R&D Expenditure. 2023
-
COMPANY PROFILES
-
Cpower
- Financial Overview
- Products Offered
- Key Developments
- SWOT Analysis
- Key Strategies
-
Siemens
- Financial Overview
- Products Offered
- Key Developments
- SWOT Analysis
- Key Strategies
-
GridPoint
- Financial Overview
- Products Offered
- Key Developments
- SWOT Analysis
- Key Strategies
-
Virtual Power Solutions
- Financial Overview
- Products Offered
- Key Developments
- SWOT Analysis
- Key Strategies
-
EnerNOC
- Financial Overview
- Products Offered
- Key Developments
- SWOT Analysis
- Key Strategies
-
Schneider Electric
- Financial Overview
- Products Offered
- Key Developments
- SWOT Analysis
- Key Strategies
-
ABB
- Financial Overview
- Products Offered
- Key Developments
- SWOT Analysis
- Key Strategies
-
EnergyHub
- Financial Overview
- Products Offered
- Key Developments
- SWOT Analysis
- Key Strategies
-
Rocky Mountain Institute
- Financial Overview
- Products Offered
- Key Developments
- SWOT Analysis
- Key Strategies
-
Flexitricity
- Financial Overview
- Products Offered
- Key Developments
- SWOT Analysis
- Key Strategies
-
Johnson Controls
- Financial Overview
- Products Offered
- Key Developments
- SWOT Analysis
- Key Strategies
-
Honeywell
- Financial Overview
- Products Offered
- Key Developments
- SWOT Analysis
- Key Strategies
-
Control4
- Financial Overview
- Products Offered
- Key Developments
- SWOT Analysis
- Key Strategies
-
Voltus
- Financial Overview
- Products Offered
- Key Developments
- SWOT Analysis
- Key Strategies
-
Cpower
-
APPENDIX
- References
- Related Reports
-
List of Tables and Figures
- LIST OF TABLES
- TABLE 1. LIST OF ASSUMPTIONS
- TABLE 2. NORTH AMERICA DEMAND RESPONSE MANAGEMENT SYSTEM MARKET SIZE ESTIMATES & FORECAST, BY APPLICATION, 2019-2032 (USD BILLIONS)
- TABLE 3. NORTH AMERICA DEMAND RESPONSE MANAGEMENT SYSTEM MARKET SIZE ESTIMATES & FORECAST, BY END USER, 2019-2032 (USD BILLIONS)
- TABLE 4. NORTH AMERICA DEMAND RESPONSE MANAGEMENT SYSTEM MARKET SIZE ESTIMATES & FORECAST, BY DEPLOYMENT TYPE, 2019-2032 (USD BILLIONS)
- TABLE 5. NORTH AMERICA DEMAND RESPONSE MANAGEMENT SYSTEM MARKET SIZE ESTIMATES & FORECAST, BY COMPONENT, 2019-2032 (USD BILLIONS)
- TABLE 6. NORTH AMERICA DEMAND RESPONSE MANAGEMENT SYSTEM MARKET SIZE ESTIMATES & FORECAST, BY REGIONAL, 2019-2032 (USD BILLIONS)
- TABLE 7. US DEMAND RESPONSE MANAGEMENT SYSTEM MARKET SIZE ESTIMATES & FORECAST, BY APPLICATION, 2019-2032 (USD BILLIONS)
- TABLE 8. US DEMAND RESPONSE MANAGEMENT SYSTEM MARKET SIZE ESTIMATES & FORECAST, BY END USER, 2019-2032 (USD BILLIONS)
- TABLE 9. US DEMAND RESPONSE MANAGEMENT SYSTEM MARKET SIZE ESTIMATES & FORECAST, BY DEPLOYMENT TYPE, 2019-2032 (USD BILLIONS)
- TABLE 10. US DEMAND RESPONSE MANAGEMENT SYSTEM MARKET SIZE ESTIMATES & FORECAST, BY COMPONENT, 2019-2032 (USD BILLIONS)
- TABLE 11. US DEMAND RESPONSE MANAGEMENT SYSTEM MARKET SIZE ESTIMATES & FORECAST, BY REGIONAL, 2019-2032 (USD BILLIONS)
- TABLE 12. CANADA DEMAND RESPONSE MANAGEMENT SYSTEM MARKET SIZE ESTIMATES & FORECAST, BY APPLICATION, 2019-2032 (USD BILLIONS)
- TABLE 13. CANADA DEMAND RESPONSE MANAGEMENT SYSTEM MARKET SIZE ESTIMATES & FORECAST, BY END USER, 2019-2032 (USD BILLIONS)
- TABLE 14. CANADA DEMAND RESPONSE MANAGEMENT SYSTEM MARKET SIZE ESTIMATES & FORECAST, BY DEPLOYMENT TYPE, 2019-2032 (USD BILLIONS)
- TABLE 15. CANADA DEMAND RESPONSE MANAGEMENT SYSTEM MARKET SIZE ESTIMATES & FORECAST, BY COMPONENT, 2019-2032 (USD BILLIONS)
- TABLE 16. CANADA DEMAND RESPONSE MANAGEMENT SYSTEM MARKET SIZE ESTIMATES & FORECAST, BY REGIONAL, 2019-2032 (USD BILLIONS)
- TABLE 17. EUROPE DEMAND RESPONSE MANAGEMENT SYSTEM MARKET SIZE ESTIMATES & FORECAST, BY APPLICATION, 2019-2032 (USD BILLIONS)
- TABLE 18. EUROPE DEMAND RESPONSE MANAGEMENT SYSTEM MARKET SIZE ESTIMATES & FORECAST, BY END USER, 2019-2032 (USD BILLIONS)
- TABLE 19. EUROPE DEMAND RESPONSE MANAGEMENT SYSTEM MARKET SIZE ESTIMATES & FORECAST, BY DEPLOYMENT TYPE, 2019-2032 (USD BILLIONS)
- TABLE 20. EUROPE DEMAND RESPONSE MANAGEMENT SYSTEM MARKET SIZE ESTIMATES & FORECAST, BY COMPONENT, 2019-2032 (USD BILLIONS)
- TABLE 21. EUROPE DEMAND RESPONSE MANAGEMENT SYSTEM MARKET SIZE ESTIMATES & FORECAST, BY REGIONAL, 2019-2032 (USD BILLIONS)
- TABLE 22. GERMANY DEMAND RESPONSE MANAGEMENT SYSTEM MARKET SIZE ESTIMATES & FORECAST, BY APPLICATION, 2019-2032 (USD BILLIONS)
- TABLE 23. GERMANY DEMAND RESPONSE MANAGEMENT SYSTEM MARKET SIZE ESTIMATES & FORECAST, BY END USER, 2019-2032 (USD BILLIONS)
- TABLE 24. GERMANY DEMAND RESPONSE MANAGEMENT SYSTEM MARKET SIZE ESTIMATES & FORECAST, BY DEPLOYMENT TYPE, 2019-2032 (USD BILLIONS)
- TABLE 25. GERMANY DEMAND RESPONSE MANAGEMENT SYSTEM MARKET SIZE ESTIMATES & FORECAST, BY COMPONENT, 2019-2032 (USD BILLIONS)
- TABLE 26. GERMANY DEMAND RESPONSE MANAGEMENT SYSTEM MARKET SIZE ESTIMATES & FORECAST, BY REGIONAL, 2019-2032 (USD BILLIONS)
- TABLE 27. UK DEMAND RESPONSE MANAGEMENT SYSTEM MARKET SIZE ESTIMATES & FORECAST, BY APPLICATION, 2019-2032 (USD BILLIONS)
- TABLE 28. UK DEMAND RESPONSE MANAGEMENT SYSTEM MARKET SIZE ESTIMATES & FORECAST, BY END USER, 2019-2032 (USD BILLIONS)
- TABLE 29. UK DEMAND RESPONSE MANAGEMENT SYSTEM MARKET SIZE ESTIMATES & FORECAST, BY DEPLOYMENT TYPE, 2019-2032 (USD BILLIONS)
- TABLE 30. UK DEMAND RESPONSE MANAGEMENT SYSTEM MARKET SIZE ESTIMATES & FORECAST, BY COMPONENT, 2019-2032 (USD BILLIONS)
- TABLE 31. UK DEMAND RESPONSE MANAGEMENT SYSTEM MARKET SIZE ESTIMATES & FORECAST, BY REGIONAL, 2019-2032 (USD BILLIONS)
- TABLE 32. FRANCE DEMAND RESPONSE MANAGEMENT SYSTEM MARKET SIZE ESTIMATES & FORECAST, BY APPLICATION, 2019-2032 (USD BILLIONS)
- TABLE 33. FRANCE DEMAND RESPONSE MANAGEMENT SYSTEM MARKET SIZE ESTIMATES & FORECAST, BY END USER, 2019-2032 (USD BILLIONS)
- TABLE 34. FRANCE DEMAND RESPONSE MANAGEMENT SYSTEM MARKET SIZE ESTIMATES & FORECAST, BY DEPLOYMENT TYPE, 2019-2032 (USD BILLIONS)
- TABLE 35. FRANCE DEMAND RESPONSE MANAGEMENT SYSTEM MARKET SIZE ESTIMATES & FORECAST, BY COMPONENT, 2019-2032 (USD BILLIONS)
- TABLE 36. FRANCE DEMAND RESPONSE MANAGEMENT SYSTEM MARKET SIZE ESTIMATES & FORECAST, BY REGIONAL, 2019-2032 (USD BILLIONS)
- TABLE 37. RUSSIA DEMAND RESPONSE MANAGEMENT SYSTEM MARKET SIZE ESTIMATES & FORECAST, BY APPLICATION, 2019-2032 (USD BILLIONS)
- TABLE 38. RUSSIA DEMAND RESPONSE MANAGEMENT SYSTEM MARKET SIZE ESTIMATES & FORECAST, BY END USER, 2019-2032 (USD BILLIONS)
- TABLE 39. RUSSIA DEMAND RESPONSE MANAGEMENT SYSTEM MARKET SIZE ESTIMATES & FORECAST, BY DEPLOYMENT TYPE, 2019-2032 (USD BILLIONS)
- TABLE 40. RUSSIA DEMAND RESPONSE MANAGEMENT SYSTEM MARKET SIZE ESTIMATES & FORECAST, BY COMPONENT, 2019-2032 (USD BILLIONS)
- TABLE 41. RUSSIA DEMAND RESPONSE MANAGEMENT SYSTEM MARKET SIZE ESTIMATES & FORECAST, BY REGIONAL, 2019-2032 (USD BILLIONS)
- TABLE 42. ITALY DEMAND RESPONSE MANAGEMENT SYSTEM MARKET SIZE ESTIMATES & FORECAST, BY APPLICATION, 2019-2032 (USD BILLIONS)
- TABLE 43. ITALY DEMAND RESPONSE MANAGEMENT SYSTEM MARKET SIZE ESTIMATES & FORECAST, BY END USER, 2019-2032 (USD BILLIONS)
- TABLE 44. ITALY DEMAND RESPONSE MANAGEMENT SYSTEM MARKET SIZE ESTIMATES & FORECAST, BY DEPLOYMENT TYPE, 2019-2032 (USD BILLIONS)
- TABLE 45. ITALY DEMAND RESPONSE MANAGEMENT SYSTEM MARKET SIZE ESTIMATES & FORECAST, BY COMPONENT, 2019-2032 (USD BILLIONS)
- TABLE 46. ITALY DEMAND RESPONSE MANAGEMENT SYSTEM MARKET SIZE ESTIMATES & FORECAST, BY REGIONAL, 2019-2032 (USD BILLIONS)
- TABLE 47. SPAIN DEMAND RESPONSE MANAGEMENT SYSTEM MARKET SIZE ESTIMATES & FORECAST, BY APPLICATION, 2019-2032 (USD BILLIONS)
- TABLE 48. SPAIN DEMAND RESPONSE MANAGEMENT SYSTEM MARKET SIZE ESTIMATES & FORECAST, BY END USER, 2019-2032 (USD BILLIONS)
- TABLE 49. SPAIN DEMAND RESPONSE MANAGEMENT SYSTEM MARKET SIZE ESTIMATES & FORECAST, BY DEPLOYMENT TYPE, 2019-2032 (USD BILLIONS)
- TABLE 50. SPAIN DEMAND RESPONSE MANAGEMENT SYSTEM MARKET SIZE ESTIMATES & FORECAST, BY COMPONENT, 2019-2032 (USD BILLIONS)
- TABLE 51. SPAIN DEMAND RESPONSE MANAGEMENT SYSTEM MARKET SIZE ESTIMATES & FORECAST, BY REGIONAL, 2019-2032 (USD BILLIONS)
- TABLE 52. REST OF EUROPE DEMAND RESPONSE MANAGEMENT SYSTEM MARKET SIZE ESTIMATES & FORECAST, BY APPLICATION, 2019-2032 (USD BILLIONS)
- TABLE 53. REST OF EUROPE DEMAND RESPONSE MANAGEMENT SYSTEM MARKET SIZE ESTIMATES & FORECAST, BY END USER, 2019-2032 (USD BILLIONS)
- TABLE 54. REST OF EUROPE DEMAND RESPONSE MANAGEMENT SYSTEM MARKET SIZE ESTIMATES & FORECAST, BY DEPLOYMENT TYPE, 2019-2032 (USD BILLIONS)
- TABLE 55. REST OF EUROPE DEMAND RESPONSE MANAGEMENT SYSTEM MARKET SIZE ESTIMATES & FORECAST, BY COMPONENT, 2019-2032 (USD BILLIONS)
- TABLE 56. REST OF EUROPE DEMAND RESPONSE MANAGEMENT SYSTEM MARKET SIZE ESTIMATES & FORECAST, BY REGIONAL, 2019-2032 (USD BILLIONS)
- TABLE 57. APAC DEMAND RESPONSE MANAGEMENT SYSTEM MARKET SIZE ESTIMATES & FORECAST, BY APPLICATION, 2019-2032 (USD BILLIONS)
- TABLE 58. APAC DEMAND RESPONSE MANAGEMENT SYSTEM MARKET SIZE ESTIMATES & FORECAST, BY END USER, 2019-2032 (USD BILLIONS)
- TABLE 59. APAC DEMAND RESPONSE MANAGEMENT SYSTEM MARKET SIZE ESTIMATES & FORECAST, BY DEPLOYMENT TYPE, 2019-2032 (USD BILLIONS)
- TABLE 60. APAC DEMAND RESPONSE MANAGEMENT SYSTEM MARKET SIZE ESTIMATES & FORECAST, BY COMPONENT, 2019-2032 (USD BILLIONS)
- TABLE 61. APAC DEMAND RESPONSE MANAGEMENT SYSTEM MARKET SIZE ESTIMATES & FORECAST, BY REGIONAL, 2019-2032 (USD BILLIONS)
- TABLE 62. CHINA DEMAND RESPONSE MANAGEMENT SYSTEM MARKET SIZE ESTIMATES & FORECAST, BY APPLICATION, 2019-2032 (USD BILLIONS)
- TABLE 63. CHINA DEMAND RESPONSE MANAGEMENT SYSTEM MARKET SIZE ESTIMATES & FORECAST, BY END USER, 2019-2032 (USD BILLIONS)
- TABLE 64. CHINA DEMAND RESPONSE MANAGEMENT SYSTEM MARKET SIZE ESTIMATES & FORECAST, BY DEPLOYMENT TYPE, 2019-2032 (USD BILLIONS)
- TABLE 65. CHINA DEMAND RESPONSE MANAGEMENT SYSTEM MARKET SIZE ESTIMATES & FORECAST, BY COMPONENT, 2019-2032 (USD BILLIONS)
- TABLE 66. CHINA DEMAND RESPONSE MANAGEMENT SYSTEM MARKET SIZE ESTIMATES & FORECAST, BY REGIONAL, 2019-2032 (USD BILLIONS)
- TABLE 67. INDIA DEMAND RESPONSE MANAGEMENT SYSTEM MARKET SIZE ESTIMATES & FORECAST, BY APPLICATION, 2019-2032 (USD BILLIONS)
- TABLE 68. INDIA DEMAND RESPONSE MANAGEMENT SYSTEM MARKET SIZE ESTIMATES & FORECAST, BY END USER, 2019-2032 (USD BILLIONS)
- TABLE 69. INDIA DEMAND RESPONSE MANAGEMENT SYSTEM MARKET SIZE ESTIMATES & FORECAST, BY DEPLOYMENT TYPE, 2019-2032 (USD BILLIONS)
- TABLE 70. INDIA DEMAND RESPONSE MANAGEMENT SYSTEM MARKET SIZE ESTIMATES & FORECAST, BY COMPONENT, 2019-2032 (USD BILLIONS)
- TABLE 71. INDIA DEMAND RESPONSE MANAGEMENT SYSTEM MARKET SIZE ESTIMATES & FORECAST, BY REGIONAL, 2019-2032 (USD BILLIONS)
- TABLE 72. JAPAN DEMAND RESPONSE MANAGEMENT SYSTEM MARKET SIZE ESTIMATES & FORECAST, BY APPLICATION, 2019-2032 (USD BILLIONS)
- TABLE 73. JAPAN DEMAND RESPONSE MANAGEMENT SYSTEM MARKET SIZE ESTIMATES & FORECAST, BY END USER, 2019-2032 (USD BILLIONS)
- TABLE 74. JAPAN DEMAND RESPONSE MANAGEMENT SYSTEM MARKET SIZE ESTIMATES & FORECAST, BY DEPLOYMENT TYPE, 2019-2032 (USD BILLIONS)
- TABLE 75. JAPAN DEMAND RESPONSE MANAGEMENT SYSTEM MARKET SIZE ESTIMATES & FORECAST, BY COMPONENT, 2019-2032 (USD BILLIONS)
- TABLE 76. JAPAN DEMAND RESPONSE MANAGEMENT SYSTEM MARKET SIZE ESTIMATES & FORECAST, BY REGIONAL, 2019-2032 (USD BILLIONS)
- TABLE 77. SOUTH KOREA DEMAND RESPONSE MANAGEMENT SYSTEM MARKET SIZE ESTIMATES & FORECAST, BY APPLICATION, 2019-2032 (USD BILLIONS)
- TABLE 78. SOUTH KOREA DEMAND RESPONSE MANAGEMENT SYSTEM MARKET SIZE ESTIMATES & FORECAST, BY END USER, 2019-2032 (USD BILLIONS)
- TABLE 79. SOUTH KOREA DEMAND RESPONSE MANAGEMENT SYSTEM MARKET SIZE ESTIMATES & FORECAST, BY DEPLOYMENT TYPE, 2019-2032 (USD BILLIONS)
- TABLE 80. SOUTH KOREA DEMAND RESPONSE MANAGEMENT SYSTEM MARKET SIZE ESTIMATES & FORECAST, BY COMPONENT, 2019-2032 (USD BILLIONS)
- TABLE 81. SOUTH KOREA DEMAND RESPONSE MANAGEMENT SYSTEM MARKET SIZE ESTIMATES & FORECAST, BY REGIONAL, 2019-2032 (USD BILLIONS)
- TABLE 82. MALAYSIA DEMAND RESPONSE MANAGEMENT SYSTEM MARKET SIZE ESTIMATES & FORECAST, BY APPLICATION, 2019-2032 (USD BILLIONS)
- TABLE 83. MALAYSIA DEMAND RESPONSE MANAGEMENT SYSTEM MARKET SIZE ESTIMATES & FORECAST, BY END USER, 2019-2032 (USD BILLIONS)
- TABLE 84. MALAYSIA DEMAND RESPONSE MANAGEMENT SYSTEM MARKET SIZE ESTIMATES & FORECAST, BY DEPLOYMENT TYPE, 2019-2032 (USD BILLIONS)
- TABLE 85. MALAYSIA DEMAND RESPONSE MANAGEMENT SYSTEM MARKET SIZE ESTIMATES & FORECAST, BY COMPONENT, 2019-2032 (USD BILLIONS)
- TABLE 86. MALAYSIA DEMAND RESPONSE MANAGEMENT SYSTEM MARKET SIZE ESTIMATES & FORECAST, BY REGIONAL, 2019-2032 (USD BILLIONS)
- TABLE 87. THAILAND DEMAND RESPONSE MANAGEMENT SYSTEM MARKET SIZE ESTIMATES & FORECAST, BY APPLICATION, 2019-2032 (USD BILLIONS)
- TABLE 88. THAILAND DEMAND RESPONSE MANAGEMENT SYSTEM MARKET SIZE ESTIMATES & FORECAST, BY END USER, 2019-2032 (USD BILLIONS)
- TABLE 89. THAILAND DEMAND RESPONSE MANAGEMENT SYSTEM MARKET SIZE ESTIMATES & FORECAST, BY DEPLOYMENT TYPE, 2019-2032 (USD BILLIONS)
- TABLE 90. THAILAND DEMAND RESPONSE MANAGEMENT SYSTEM MARKET SIZE ESTIMATES & FORECAST, BY COMPONENT, 2019-2032 (USD BILLIONS)
- TABLE 91. THAILAND DEMAND RESPONSE MANAGEMENT SYSTEM MARKET SIZE ESTIMATES & FORECAST, BY REGIONAL, 2019-2032 (USD BILLIONS)
- TABLE 92. INDONESIA DEMAND RESPONSE MANAGEMENT SYSTEM MARKET SIZE ESTIMATES & FORECAST, BY APPLICATION, 2019-2032 (USD BILLIONS)
- TABLE 93. INDONESIA DEMAND RESPONSE MANAGEMENT SYSTEM MARKET SIZE ESTIMATES & FORECAST, BY END USER, 2019-2032 (USD BILLIONS)
- TABLE 94. INDONESIA DEMAND RESPONSE MANAGEMENT SYSTEM MARKET SIZE ESTIMATES & FORECAST, BY DEPLOYMENT TYPE, 2019-2032 (USD BILLIONS)
- TABLE 95. INDONESIA DEMAND RESPONSE MANAGEMENT SYSTEM MARKET SIZE ESTIMATES & FORECAST, BY COMPONENT, 2019-2032 (USD BILLIONS)
- TABLE 96. INDONESIA DEMAND RESPONSE MANAGEMENT SYSTEM MARKET SIZE ESTIMATES & FORECAST, BY REGIONAL, 2019-2032 (USD BILLIONS)
- TABLE 97. REST OF APAC DEMAND RESPONSE MANAGEMENT SYSTEM MARKET SIZE ESTIMATES & FORECAST, BY APPLICATION, 2019-2032 (USD BILLIONS)
- TABLE 98. REST OF APAC DEMAND RESPONSE MANAGEMENT SYSTEM MARKET SIZE ESTIMATES & FORECAST, BY END USER, 2019-2032 (USD BILLIONS)
- TABLE 99. REST OF APAC DEMAND RESPONSE MANAGEMENT SYSTEM MARKET SIZE ESTIMATES & FORECAST, BY DEPLOYMENT TYPE, 2019-2032 (USD BILLIONS)
- TABLE 100. REST OF APAC DEMAND RESPONSE MANAGEMENT SYSTEM MARKET SIZE ESTIMATES & FORECAST, BY COMPONENT, 2019-2032 (USD BILLIONS)
- TABLE 101. REST OF APAC DEMAND RESPONSE MANAGEMENT SYSTEM MARKET SIZE ESTIMATES & FORECAST, BY REGIONAL, 2019-2032 (USD BILLIONS)
- TABLE 102. SOUTH AMERICA DEMAND RESPONSE MANAGEMENT SYSTEM MARKET SIZE ESTIMATES & FORECAST, BY APPLICATION, 2019-2032 (USD BILLIONS)
- TABLE 103. SOUTH AMERICA DEMAND RESPONSE MANAGEMENT SYSTEM MARKET SIZE ESTIMATES & FORECAST, BY END USER, 2019-2032 (USD BILLIONS)
- TABLE 104. SOUTH AMERICA DEMAND RESPONSE MANAGEMENT SYSTEM MARKET SIZE ESTIMATES & FORECAST, BY DEPLOYMENT TYPE, 2019-2032 (USD BILLIONS)
- TABLE 105. SOUTH AMERICA DEMAND RESPONSE MANAGEMENT SYSTEM MARKET SIZE ESTIMATES & FORECAST, BY COMPONENT, 2019-2032 (USD BILLIONS)
- TABLE 106. SOUTH AMERICA DEMAND RESPONSE MANAGEMENT SYSTEM MARKET SIZE ESTIMATES & FORECAST, BY REGIONAL, 2019-2032 (USD BILLIONS)
- TABLE 107. BRAZIL DEMAND RESPONSE MANAGEMENT SYSTEM MARKET SIZE ESTIMATES & FORECAST, BY APPLICATION, 2019-2032 (USD BILLIONS)
- TABLE 108. BRAZIL DEMAND RESPONSE MANAGEMENT SYSTEM MARKET SIZE ESTIMATES & FORECAST, BY END USER, 2019-2032 (USD BILLIONS)
- TABLE 109. BRAZIL DEMAND RESPONSE MANAGEMENT SYSTEM MARKET SIZE ESTIMATES & FORECAST, BY DEPLOYMENT TYPE, 2019-2032 (USD BILLIONS)
- TABLE 110. BRAZIL DEMAND RESPONSE MANAGEMENT SYSTEM MARKET SIZE ESTIMATES & FORECAST, BY COMPONENT, 2019-2032 (USD BILLIONS)
- TABLE 111. BRAZIL DEMAND RESPONSE MANAGEMENT SYSTEM MARKET SIZE ESTIMATES & FORECAST, BY REGIONAL, 2019-2032 (USD BILLIONS)
- TABLE 112. MEXICO DEMAND RESPONSE MANAGEMENT SYSTEM MARKET SIZE ESTIMATES & FORECAST, BY APPLICATION, 2019-2032 (USD BILLIONS)
- TABLE 113. MEXICO DEMAND RESPONSE MANAGEMENT SYSTEM MARKET SIZE ESTIMATES & FORECAST, BY END USER, 2019-2032 (USD BILLIONS)
- TABLE 114. MEXICO DEMAND RESPONSE MANAGEMENT SYSTEM MARKET SIZE ESTIMATES & FORECAST, BY DEPLOYMENT TYPE, 2019-2032 (USD BILLIONS)
- TABLE 115. MEXICO DEMAND RESPONSE MANAGEMENT SYSTEM MARKET SIZE ESTIMATES & FORECAST, BY COMPONENT, 2019-2032 (USD BILLIONS)
- TABLE 116. MEXICO DEMAND RESPONSE MANAGEMENT SYSTEM MARKET SIZE ESTIMATES & FORECAST, BY REGIONAL, 2019-2032 (USD BILLIONS)
- TABLE 117. ARGENTINA DEMAND RESPONSE MANAGEMENT SYSTEM MARKET SIZE ESTIMATES & FORECAST, BY APPLICATION, 2019-2032 (USD BILLIONS)
- TABLE 118. ARGENTINA DEMAND RESPONSE MANAGEMENT SYSTEM MARKET SIZE ESTIMATES & FORECAST, BY END USER, 2019-2032 (USD BILLIONS)
- TABLE 119. ARGENTINA DEMAND RESPONSE MANAGEMENT SYSTEM MARKET SIZE ESTIMATES & FORECAST, BY DEPLOYMENT TYPE, 2019-2032 (USD BILLIONS)
- TABLE 120. ARGENTINA DEMAND RESPONSE MANAGEMENT SYSTEM MARKET SIZE ESTIMATES & FORECAST, BY COMPONENT, 2019-2032 (USD BILLIONS)
- TABLE 121. ARGENTINA DEMAND RESPONSE MANAGEMENT SYSTEM MARKET SIZE ESTIMATES & FORECAST, BY REGIONAL, 2019-2032 (USD BILLIONS)
- TABLE 122. REST OF SOUTH AMERICA DEMAND RESPONSE MANAGEMENT SYSTEM MARKET SIZE ESTIMATES & FORECAST, BY APPLICATION, 2019-2032 (USD BILLIONS)
- TABLE 123. REST OF SOUTH AMERICA DEMAND RESPONSE MANAGEMENT SYSTEM MARKET SIZE ESTIMATES & FORECAST, BY END USER, 2019-2032 (USD BILLIONS)
- TABLE 124. REST OF SOUTH AMERICA DEMAND RESPONSE MANAGEMENT SYSTEM MARKET SIZE ESTIMATES & FORECAST, BY DEPLOYMENT TYPE, 2019-2032 (USD BILLIONS)
- TABLE 125. REST OF SOUTH AMERICA DEMAND RESPONSE MANAGEMENT SYSTEM MARKET SIZE ESTIMATES & FORECAST, BY COMPONENT, 2019-2032 (USD BILLIONS)
- TABLE 126. REST OF SOUTH AMERICA DEMAND RESPONSE MANAGEMENT SYSTEM MARKET SIZE ESTIMATES & FORECAST, BY REGIONAL, 2019-2032 (USD BILLIONS)
- TABLE 127. MEA DEMAND RESPONSE MANAGEMENT SYSTEM MARKET SIZE ESTIMATES & FORECAST, BY APPLICATION, 2019-2032 (USD BILLIONS)
- TABLE 128. MEA DEMAND RESPONSE MANAGEMENT SYSTEM MARKET SIZE ESTIMATES & FORECAST, BY END USER, 2019-2032 (USD BILLIONS)
- TABLE 129. MEA DEMAND RESPONSE MANAGEMENT SYSTEM MARKET SIZE ESTIMATES & FORECAST, BY DEPLOYMENT TYPE, 2019-2032 (USD BILLIONS)
- TABLE 130. MEA DEMAND RESPONSE MANAGEMENT SYSTEM MARKET SIZE ESTIMATES & FORECAST, BY COMPONENT, 2019-2032 (USD BILLIONS)
- TABLE 131. MEA DEMAND RESPONSE MANAGEMENT SYSTEM MARKET SIZE ESTIMATES & FORECAST, BY REGIONAL, 2019-2032 (USD BILLIONS)
- TABLE 132. GCC COUNTRIES DEMAND RESPONSE MANAGEMENT SYSTEM MARKET SIZE ESTIMATES & FORECAST, BY APPLICATION, 2019-2032 (USD BILLIONS)
- TABLE 133. GCC COUNTRIES DEMAND RESPONSE MANAGEMENT SYSTEM MARKET SIZE ESTIMATES & FORECAST, BY END USER, 2019-2032 (USD BILLIONS)
- TABLE 134. GCC COUNTRIES DEMAND RESPONSE MANAGEMENT SYSTEM MARKET SIZE ESTIMATES & FORECAST, BY DEPLOYMENT TYPE, 2019-2032 (USD BILLIONS)
- TABLE 135. GCC COUNTRIES DEMAND RESPONSE MANAGEMENT SYSTEM MARKET SIZE ESTIMATES & FORECAST, BY COMPONENT, 2019-2032 (USD BILLIONS)
- TABLE 136. GCC COUNTRIES DEMAND RESPONSE MANAGEMENT SYSTEM MARKET SIZE ESTIMATES & FORECAST, BY REGIONAL, 2019-2032 (USD BILLIONS)
- TABLE 137. SOUTH AFRICA DEMAND RESPONSE MANAGEMENT SYSTEM MARKET SIZE ESTIMATES & FORECAST, BY APPLICATION, 2019-2032 (USD BILLIONS)
- TABLE 138. SOUTH AFRICA DEMAND RESPONSE MANAGEMENT SYSTEM MARKET SIZE ESTIMATES & FORECAST, BY END USER, 2019-2032 (USD BILLIONS)
- TABLE 139. SOUTH AFRICA DEMAND RESPONSE MANAGEMENT SYSTEM MARKET SIZE ESTIMATES & FORECAST, BY DEPLOYMENT TYPE, 2019-2032 (USD BILLIONS)
- TABLE 140. SOUTH AFRICA DEMAND RESPONSE MANAGEMENT SYSTEM MARKET SIZE ESTIMATES & FORECAST, BY COMPONENT, 2019-2032 (USD BILLIONS)
- TABLE 141. SOUTH AFRICA DEMAND RESPONSE MANAGEMENT SYSTEM MARKET SIZE ESTIMATES & FORECAST, BY REGIONAL, 2019-2032 (USD BILLIONS)
- TABLE 142. REST OF MEA DEMAND RESPONSE MANAGEMENT SYSTEM MARKET SIZE ESTIMATES & FORECAST, BY APPLICATION, 2019-2032 (USD BILLIONS)
- TABLE 143. REST OF MEA DEMAND RESPONSE MANAGEMENT SYSTEM MARKET SIZE ESTIMATES & FORECAST, BY END USER, 2019-2032 (USD BILLIONS)
- TABLE 144. REST OF MEA DEMAND RESPONSE MANAGEMENT SYSTEM MARKET SIZE ESTIMATES & FORECAST, BY DEPLOYMENT TYPE, 2019-2032 (USD BILLIONS)
- TABLE 145. REST OF MEA DEMAND RESPONSE MANAGEMENT SYSTEM MARKET SIZE ESTIMATES & FORECAST, BY COMPONENT, 2019-2032 (USD BILLIONS)
- TABLE 146. REST OF MEA DEMAND RESPONSE MANAGEMENT SYSTEM MARKET SIZE ESTIMATES & FORECAST, BY REGIONAL, 2019-2032 (USD BILLIONS)
- TABLE 147. PRODUCT LAUNCH/PRODUCT DEVELOPMENT/APPROVAL
- TABLE 148. ACQUISITION/PARTNERSHIP LIST OF FIGURES
- FIGURE 1. MARKET SYNOPSIS
- FIGURE 2. NORTH AMERICA DEMAND RESPONSE MANAGEMENT SYSTEM MARKET ANALYSIS
- FIGURE 3. US DEMAND RESPONSE MANAGEMENT SYSTEM MARKET ANALYSIS BY APPLICATION
- FIGURE 4. US DEMAND RESPONSE MANAGEMENT SYSTEM MARKET ANALYSIS BY END USER
- FIGURE 5. US DEMAND RESPONSE MANAGEMENT SYSTEM MARKET ANALYSIS BY DEPLOYMENT TYPE
- FIGURE 6. US DEMAND RESPONSE MANAGEMENT SYSTEM MARKET ANALYSIS BY COMPONENT
- FIGURE 7. US DEMAND RESPONSE MANAGEMENT SYSTEM MARKET ANALYSIS BY REGIONAL
- FIGURE 8. CANADA DEMAND RESPONSE MANAGEMENT SYSTEM MARKET ANALYSIS BY APPLICATION
- FIGURE 9. CANADA DEMAND RESPONSE MANAGEMENT SYSTEM MARKET ANALYSIS BY END USER
- FIGURE 10. CANADA DEMAND RESPONSE MANAGEMENT SYSTEM MARKET ANALYSIS BY DEPLOYMENT TYPE
- FIGURE 11. CANADA DEMAND RESPONSE MANAGEMENT SYSTEM MARKET ANALYSIS BY COMPONENT
- FIGURE 12. CANADA DEMAND RESPONSE MANAGEMENT SYSTEM MARKET ANALYSIS BY REGIONAL
- FIGURE 13. EUROPE DEMAND RESPONSE MANAGEMENT SYSTEM MARKET ANALYSIS
- FIGURE 14. GERMANY DEMAND RESPONSE MANAGEMENT SYSTEM MARKET ANALYSIS BY APPLICATION
- FIGURE 15. GERMANY DEMAND RESPONSE MANAGEMENT SYSTEM MARKET ANALYSIS BY END USER
- FIGURE 16. GERMANY DEMAND RESPONSE MANAGEMENT SYSTEM MARKET ANALYSIS BY DEPLOYMENT TYPE
- FIGURE 17. GERMANY DEMAND RESPONSE MANAGEMENT SYSTEM MARKET ANALYSIS BY COMPONENT
- FIGURE 18. GERMANY DEMAND RESPONSE MANAGEMENT SYSTEM MARKET ANALYSIS BY REGIONAL
- FIGURE 19. UK DEMAND RESPONSE MANAGEMENT SYSTEM MARKET ANALYSIS BY APPLICATION
- FIGURE 20. UK DEMAND RESPONSE MANAGEMENT SYSTEM MARKET ANALYSIS BY END USER
- FIGURE 21. UK DEMAND RESPONSE MANAGEMENT SYSTEM MARKET ANALYSIS BY DEPLOYMENT TYPE
- FIGURE 22. UK DEMAND RESPONSE MANAGEMENT SYSTEM MARKET ANALYSIS BY COMPONENT
- FIGURE 23. UK DEMAND RESPONSE MANAGEMENT SYSTEM MARKET ANALYSIS BY REGIONAL
- FIGURE 24. FRANCE DEMAND RESPONSE MANAGEMENT SYSTEM MARKET ANALYSIS BY APPLICATION
- FIGURE 25. FRANCE DEMAND RESPONSE MANAGEMENT SYSTEM MARKET ANALYSIS BY END USER
- FIGURE 26. FRANCE DEMAND RESPONSE MANAGEMENT SYSTEM MARKET ANALYSIS BY DEPLOYMENT TYPE
- FIGURE 27. FRANCE DEMAND RESPONSE MANAGEMENT SYSTEM MARKET ANALYSIS BY COMPONENT
- FIGURE 28. FRANCE DEMAND RESPONSE MANAGEMENT SYSTEM MARKET ANALYSIS BY REGIONAL
- FIGURE 29. RUSSIA DEMAND RESPONSE MANAGEMENT SYSTEM MARKET ANALYSIS BY APPLICATION
- FIGURE 30. RUSSIA DEMAND RESPONSE MANAGEMENT SYSTEM MARKET ANALYSIS BY END USER
- FIGURE 31. RUSSIA DEMAND RESPONSE MANAGEMENT SYSTEM MARKET ANALYSIS BY DEPLOYMENT TYPE
- FIGURE 32. RUSSIA DEMAND RESPONSE MANAGEMENT SYSTEM MARKET ANALYSIS BY COMPONENT
- FIGURE 33. RUSSIA DEMAND RESPONSE MANAGEMENT SYSTEM MARKET ANALYSIS BY REGIONAL
- FIGURE 34. ITALY DEMAND RESPONSE MANAGEMENT SYSTEM MARKET ANALYSIS BY APPLICATION
- FIGURE 35. ITALY DEMAND RESPONSE MANAGEMENT SYSTEM MARKET ANALYSIS BY END USER
- FIGURE 36. ITALY DEMAND RESPONSE MANAGEMENT SYSTEM MARKET ANALYSIS BY DEPLOYMENT TYPE
- FIGURE 37. ITALY DEMAND RESPONSE MANAGEMENT SYSTEM MARKET ANALYSIS BY COMPONENT
- FIGURE 38. ITALY DEMAND RESPONSE MANAGEMENT SYSTEM MARKET ANALYSIS BY REGIONAL
- FIGURE 39. SPAIN DEMAND RESPONSE MANAGEMENT SYSTEM MARKET ANALYSIS BY APPLICATION
- FIGURE 40. SPAIN DEMAND RESPONSE MANAGEMENT SYSTEM MARKET ANALYSIS BY END USER
- FIGURE 41. SPAIN DEMAND RESPONSE MANAGEMENT SYSTEM MARKET ANALYSIS BY DEPLOYMENT TYPE
- FIGURE 42. SPAIN DEMAND RESPONSE MANAGEMENT SYSTEM MARKET ANALYSIS BY COMPONENT
- FIGURE 43. SPAIN DEMAND RESPONSE MANAGEMENT SYSTEM MARKET ANALYSIS BY REGIONAL
- FIGURE 44. REST OF EUROPE DEMAND RESPONSE MANAGEMENT SYSTEM MARKET ANALYSIS BY APPLICATION
- FIGURE 45. REST OF EUROPE DEMAND RESPONSE MANAGEMENT SYSTEM MARKET ANALYSIS BY END USER
- FIGURE 46. REST OF EUROPE DEMAND RESPONSE MANAGEMENT SYSTEM MARKET ANALYSIS BY DEPLOYMENT TYPE
- FIGURE 47. REST OF EUROPE DEMAND RESPONSE MANAGEMENT SYSTEM MARKET ANALYSIS BY COMPONENT
- FIGURE 48. REST OF EUROPE DEMAND RESPONSE MANAGEMENT SYSTEM MARKET ANALYSIS BY REGIONAL
- FIGURE 49. APAC DEMAND RESPONSE MANAGEMENT SYSTEM MARKET ANALYSIS
- FIGURE 50. CHINA DEMAND RESPONSE MANAGEMENT SYSTEM MARKET ANALYSIS BY APPLICATION
- FIGURE 51. CHINA DEMAND RESPONSE MANAGEMENT SYSTEM MARKET ANALYSIS BY END USER
- FIGURE 52. CHINA DEMAND RESPONSE MANAGEMENT SYSTEM MARKET ANALYSIS BY DEPLOYMENT TYPE
- FIGURE 53. CHINA DEMAND RESPONSE MANAGEMENT SYSTEM MARKET ANALYSIS BY COMPONENT
- FIGURE 54. CHINA DEMAND RESPONSE MANAGEMENT SYSTEM MARKET ANALYSIS BY REGIONAL
- FIGURE 55. INDIA DEMAND RESPONSE MANAGEMENT SYSTEM MARKET ANALYSIS BY APPLICATION
- FIGURE 56. INDIA DEMAND RESPONSE MANAGEMENT SYSTEM MARKET ANALYSIS BY END USER
- FIGURE 57. INDIA DEMAND RESPONSE MANAGEMENT SYSTEM MARKET ANALYSIS BY DEPLOYMENT TYPE
- FIGURE 58. INDIA DEMAND RESPONSE MANAGEMENT SYSTEM MARKET ANALYSIS BY COMPONENT
- FIGURE 59. INDIA DEMAND RESPONSE MANAGEMENT SYSTEM MARKET ANALYSIS BY REGIONAL
- FIGURE 60. JAPAN DEMAND RESPONSE MANAGEMENT SYSTEM MARKET ANALYSIS BY APPLICATION
- FIGURE 61. JAPAN DEMAND RESPONSE MANAGEMENT SYSTEM MARKET ANALYSIS BY END USER
- FIGURE 62. JAPAN DEMAND RESPONSE MANAGEMENT SYSTEM MARKET ANALYSIS BY DEPLOYMENT TYPE
- FIGURE 63. JAPAN DEMAND RESPONSE MANAGEMENT SYSTEM MARKET ANALYSIS BY COMPONENT
- FIGURE 64. JAPAN DEMAND RESPONSE MANAGEMENT SYSTEM MARKET ANALYSIS BY REGIONAL
- FIGURE 65. SOUTH KOREA DEMAND RESPONSE MANAGEMENT SYSTEM MARKET ANALYSIS BY APPLICATION
- FIGURE 66. SOUTH KOREA DEMAND RESPONSE MANAGEMENT SYSTEM MARKET ANALYSIS BY END USER
- FIGURE 67. SOUTH KOREA DEMAND RESPONSE MANAGEMENT SYSTEM MARKET ANALYSIS BY DEPLOYMENT TYPE
- FIGURE 68. SOUTH KOREA DEMAND RESPONSE MANAGEMENT SYSTEM MARKET ANALYSIS BY COMPONENT
- FIGURE 69. SOUTH KOREA DEMAND RESPONSE MANAGEMENT SYSTEM MARKET ANALYSIS BY REGIONAL
- FIGURE 70. MALAYSIA DEMAND RESPONSE MANAGEMENT SYSTEM MARKET ANALYSIS BY APPLICATION
- FIGURE 71. MALAYSIA DEMAND RESPONSE MANAGEMENT SYSTEM MARKET ANALYSIS BY END USER
- FIGURE 72. MALAYSIA DEMAND RESPONSE MANAGEMENT SYSTEM MARKET ANALYSIS BY DEPLOYMENT TYPE
- FIGURE 73. MALAYSIA DEMAND RESPONSE MANAGEMENT SYSTEM MARKET ANALYSIS BY COMPONENT
- FIGURE 74. MALAYSIA DEMAND RESPONSE MANAGEMENT SYSTEM MARKET ANALYSIS BY REGIONAL
- FIGURE 75. THAILAND DEMAND RESPONSE MANAGEMENT SYSTEM MARKET ANALYSIS BY APPLICATION
- FIGURE 76. THAILAND DEMAND RESPONSE MANAGEMENT SYSTEM MARKET ANALYSIS BY END USER
- FIGURE 77. THAILAND DEMAND RESPONSE MANAGEMENT SYSTEM MARKET ANALYSIS BY DEPLOYMENT TYPE
- FIGURE 78. THAILAND DEMAND RESPONSE MANAGEMENT SYSTEM MARKET ANALYSIS BY COMPONENT
- FIGURE 79. THAILAND DEMAND RESPONSE MANAGEMENT SYSTEM MARKET ANALYSIS BY REGIONAL
- FIGURE 80. INDONESIA DEMAND RESPONSE MANAGEMENT SYSTEM MARKET ANALYSIS BY APPLICATION
- FIGURE 81. INDONESIA DEMAND RESPONSE MANAGEMENT SYSTEM MARKET ANALYSIS BY END USER
- FIGURE 82. INDONESIA DEMAND RESPONSE MANAGEMENT SYSTEM MARKET ANALYSIS BY DEPLOYMENT TYPE
- FIGURE 83. INDONESIA DEMAND RESPONSE MANAGEMENT SYSTEM MARKET ANALYSIS BY COMPONENT
- FIGURE 84. INDONESIA DEMAND RESPONSE MANAGEMENT SYSTEM MARKET ANALYSIS BY REGIONAL
- FIGURE 85. REST OF APAC DEMAND RESPONSE MANAGEMENT SYSTEM MARKET ANALYSIS BY APPLICATION
- FIGURE 86. REST OF APAC DEMAND RESPONSE MANAGEMENT SYSTEM MARKET ANALYSIS BY END USER
- FIGURE 87. REST OF APAC DEMAND RESPONSE MANAGEMENT SYSTEM MARKET ANALYSIS BY DEPLOYMENT TYPE
- FIGURE 88. REST OF APAC DEMAND RESPONSE MANAGEMENT SYSTEM MARKET ANALYSIS BY COMPONENT
- FIGURE 89. REST OF APAC DEMAND RESPONSE MANAGEMENT SYSTEM MARKET ANALYSIS BY REGIONAL
- FIGURE 90. SOUTH AMERICA DEMAND RESPONSE MANAGEMENT SYSTEM MARKET ANALYSIS
- FIGURE 91. BRAZIL DEMAND RESPONSE MANAGEMENT SYSTEM MARKET ANALYSIS BY APPLICATION
- FIGURE 92. BRAZIL DEMAND RESPONSE MANAGEMENT SYSTEM MARKET ANALYSIS BY END USER
- FIGURE 93. BRAZIL DEMAND RESPONSE MANAGEMENT SYSTEM MARKET ANALYSIS BY DEPLOYMENT TYPE
- FIGURE 94. BRAZIL DEMAND RESPONSE MANAGEMENT SYSTEM MARKET ANALYSIS BY COMPONENT
- FIGURE 95. BRAZIL DEMAND RESPONSE MANAGEMENT SYSTEM MARKET ANALYSIS BY REGIONAL
- FIGURE 96. MEXICO DEMAND RESPONSE MANAGEMENT SYSTEM MARKET ANALYSIS BY APPLICATION
- FIGURE 97. MEXICO DEMAND RESPONSE MANAGEMENT SYSTEM MARKET ANALYSIS BY END USER
- FIGURE 98. MEXICO DEMAND RESPONSE MANAGEMENT SYSTEM MARKET ANALYSIS BY DEPLOYMENT TYPE
- FIGURE 99. MEXICO DEMAND RESPONSE MANAGEMENT SYSTEM MARKET ANALYSIS BY COMPONENT
- FIGURE 100. MEXICO DEMAND RESPONSE MANAGEMENT SYSTEM MARKET ANALYSIS BY REGIONAL
- FIGURE 101. ARGENTINA DEMAND RESPONSE MANAGEMENT SYSTEM MARKET ANALYSIS BY APPLICATION
- FIGURE 102. ARGENTINA DEMAND RESPONSE MANAGEMENT SYSTEM MARKET ANALYSIS BY END USER
- FIGURE 103. ARGENTINA DEMAND RESPONSE MANAGEMENT SYSTEM MARKET ANALYSIS BY DEPLOYMENT TYPE
- FIGURE 104. ARGENTINA DEMAND RESPONSE MANAGEMENT SYSTEM MARKET ANALYSIS BY COMPONENT
- FIGURE 105. ARGENTINA DEMAND RESPONSE MANAGEMENT SYSTEM MARKET ANALYSIS BY REGIONAL
- FIGURE 106. REST OF SOUTH AMERICA DEMAND RESPONSE MANAGEMENT SYSTEM MARKET ANALYSIS BY APPLICATION
- FIGURE 107. REST OF SOUTH AMERICA DEMAND RESPONSE MANAGEMENT SYSTEM MARKET ANALYSIS BY END USER
- FIGURE 108. REST OF SOUTH AMERICA DEMAND RESPONSE MANAGEMENT SYSTEM MARKET ANALYSIS BY DEPLOYMENT TYPE
- FIGURE 109. REST OF SOUTH AMERICA DEMAND RESPONSE MANAGEMENT SYSTEM MARKET ANALYSIS BY COMPONENT
- FIGURE 110. REST OF SOUTH AMERICA DEMAND RESPONSE MANAGEMENT SYSTEM MARKET ANALYSIS BY REGIONAL
- FIGURE 111. MEA DEMAND RESPONSE MANAGEMENT SYSTEM MARKET ANALYSIS
- FIGURE 112. GCC COUNTRIES DEMAND RESPONSE MANAGEMENT SYSTEM MARKET ANALYSIS BY APPLICATION
- FIGURE 113. GCC COUNTRIES DEMAND RESPONSE MANAGEMENT SYSTEM MARKET ANALYSIS BY END USER
- FIGURE 114. GCC COUNTRIES DEMAND RESPONSE MANAGEMENT SYSTEM MARKET ANALYSIS BY DEPLOYMENT TYPE
- FIGURE 115. GCC COUNTRIES DEMAND RESPONSE MANAGEMENT SYSTEM MARKET ANALYSIS BY COMPONENT
- FIGURE 116. GCC COUNTRIES DEMAND RESPONSE MANAGEMENT SYSTEM MARKET ANALYSIS BY REGIONAL
- FIGURE 117. SOUTH AFRICA DEMAND RESPONSE MANAGEMENT SYSTEM MARKET ANALYSIS BY APPLICATION
- FIGURE 118. SOUTH AFRICA DEMAND RESPONSE MANAGEMENT SYSTEM MARKET ANALYSIS BY END USER
- FIGURE 119. SOUTH AFRICA DEMAND RESPONSE MANAGEMENT SYSTEM MARKET ANALYSIS BY DEPLOYMENT TYPE
- FIGURE 120. SOUTH AFRICA DEMAND RESPONSE MANAGEMENT SYSTEM MARKET ANALYSIS BY COMPONENT
- FIGURE 121. SOUTH AFRICA DEMAND RESPONSE MANAGEMENT SYSTEM MARKET ANALYSIS BY REGIONAL
- FIGURE 122. REST OF MEA DEMAND RESPONSE MANAGEMENT SYSTEM MARKET ANALYSIS BY APPLICATION
- FIGURE 123. REST OF MEA DEMAND RESPONSE MANAGEMENT SYSTEM MARKET ANALYSIS BY END USER
- FIGURE 124. REST OF MEA DEMAND RESPONSE MANAGEMENT SYSTEM MARKET ANALYSIS BY DEPLOYMENT TYPE
- FIGURE 125. REST OF MEA DEMAND RESPONSE MANAGEMENT SYSTEM MARKET ANALYSIS BY COMPONENT
- FIGURE 126. REST OF MEA DEMAND RESPONSE MANAGEMENT SYSTEM MARKET ANALYSIS BY REGIONAL
- FIGURE 127. KEY BUYING CRITERIA OF DEMAND RESPONSE MANAGEMENT SYSTEM MARKET
- FIGURE 128. RESEARCH PROCESS OF MRFR
- FIGURE 129. DRO ANALYSIS OF DEMAND RESPONSE MANAGEMENT SYSTEM MARKET
- FIGURE 130. DRIVERS IMPACT ANALYSIS: DEMAND RESPONSE MANAGEMENT SYSTEM MARKET
- FIGURE 131. RESTRAINTS IMPACT ANALYSIS: DEMAND RESPONSE MANAGEMENT SYSTEM MARKET
- FIGURE 132. SUPPLY / VALUE CHAIN: DEMAND RESPONSE MANAGEMENT SYSTEM MARKET
- FIGURE 133. DEMAND RESPONSE MANAGEMENT SYSTEM MARKET, BY APPLICATION, 2024 (% SHARE)
- FIGURE 134. DEMAND RESPONSE MANAGEMENT SYSTEM MARKET, BY APPLICATION, 2019 TO 2032 (USD Billions)
- FIGURE 135. DEMAND RESPONSE MANAGEMENT SYSTEM MARKET, BY END USER, 2024 (% SHARE)
- FIGURE 136. DEMAND RESPONSE MANAGEMENT SYSTEM MARKET, BY END USER, 2019 TO 2032 (USD Billions)
- FIGURE 137. DEMAND RESPONSE MANAGEMENT SYSTEM MARKET, BY DEPLOYMENT TYPE, 2024 (% SHARE)
- FIGURE 138. DEMAND RESPONSE MANAGEMENT SYSTEM MARKET, BY DEPLOYMENT TYPE, 2019 TO 2032 (USD Billions)
- FIGURE 139. DEMAND RESPONSE MANAGEMENT SYSTEM MARKET, BY COMPONENT, 2024 (% SHARE)
- FIGURE 140. DEMAND RESPONSE MANAGEMENT SYSTEM MARKET, BY COMPONENT, 2019 TO 2032 (USD Billions)
- FIGURE 141. DEMAND RESPONSE MANAGEMENT SYSTEM MARKET, BY REGIONAL, 2024 (% SHARE)
- FIGURE 142. DEMAND RESPONSE MANAGEMENT SYSTEM MARKET, BY REGIONAL, 2019 TO 2032 (USD Billions)
- FIGURE 143. BENCHMARKING OF MAJOR COMPETITORS
Demand Response Management System Market Segmentation
Demand Response Management System Market By Application (USD Billion, 2019-2032)
Commercial
Industrial
Residential
Utility
Demand Response Management System Market By End User (USD Billion, 2019-2032)
Electricity Providers
Commercial Establishments
Industrial Facilities
Government
Demand Response Management System Market By Deployment Type (USD Billion, 2019-2032)
On-Premise
Cloud-Based
Demand Response Management System Market By Component (USD Billion, 2019-2032)
Solutions
Services
Demand Response Management System Market By Regional (USD Billion, 2019-2032)
North America
Europe
South America
Asia Pacific
Middle East and Africa
Demand Response Management System Market Regional Outlook (USD Billion, 2019-2032)
North America Outlook (USD Billion, 2019-2032)
North America Demand Response Management System Market by Application Type
Commercial
Industrial
Residential
Utility
North America Demand Response Management System Market by End User Type
Electricity Providers
Commercial Establishments
Industrial Facilities
Government
North America Demand Response Management System Market by Deployment Type
On-Premise
Cloud-Based
North America Demand Response Management System Market by Component Type
Solutions
Services
North America Demand Response Management System Market by Regional Type
US
Canada
US Outlook (USD Billion, 2019-2032)
US Demand Response Management System Market by Application Type
Commercial
Industrial
Residential
Utility
US Demand Response Management System Market by End User Type
Electricity Providers
Commercial Establishments
Industrial Facilities
Government
US Demand Response Management System Market by Deployment Type
On-Premise
Cloud-Based
US Demand Response Management System Market by Component Type
Solutions
Services
CANADA Outlook (USD Billion, 2019-2032)
CANADA Demand Response Management System Market by Application Type
Commercial
Industrial
Residential
Utility
CANADA Demand Response Management System Market by End User Type
Electricity Providers
Commercial Establishments
Industrial Facilities
Government
CANADA Demand Response Management System Market by Deployment Type
On-Premise
Cloud-Based
CANADA Demand Response Management System Market by Component Type
Solutions
Services
Europe Outlook (USD Billion, 2019-2032)
Europe Demand Response Management System Market by Application Type
Commercial
Industrial
Residential
Utility
Europe Demand Response Management System Market by End User Type
Electricity Providers
Commercial Establishments
Industrial Facilities
Government
Europe Demand Response Management System Market by Deployment Type
On-Premise
Cloud-Based
Europe Demand Response Management System Market by Component Type
Solutions
Services
Europe Demand Response Management System Market by Regional Type
Germany
UK
France
Russia
Italy
Spain
Rest of Europe
GERMANY Outlook (USD Billion, 2019-2032)
GERMANY Demand Response Management System Market by Application Type
Commercial
Industrial
Residential
Utility
GERMANY Demand Response Management System Market by End User Type
Electricity Providers
Commercial Establishments
Industrial Facilities
Government
GERMANY Demand Response Management System Market by Deployment Type
On-Premise
Cloud-Based
GERMANY Demand Response Management System Market by Component Type
Solutions
Services
UK Outlook (USD Billion, 2019-2032)
UK Demand Response Management System Market by Application Type
Commercial
Industrial
Residential
Utility
UK Demand Response Management System Market by End User Type
Electricity Providers
Commercial Establishments
Industrial Facilities
Government
UK Demand Response Management System Market by Deployment Type
On-Premise
Cloud-Based
UK Demand Response Management System Market by Component Type
Solutions
Services
FRANCE Outlook (USD Billion, 2019-2032)
FRANCE Demand Response Management System Market by Application Type
Commercial
Industrial
Residential
Utility
FRANCE Demand Response Management System Market by End User Type
Electricity Providers
Commercial Establishments
Industrial Facilities
Government
FRANCE Demand Response Management System Market by Deployment Type
On-Premise
Cloud-Based
FRANCE Demand Response Management System Market by Component Type
Solutions
Services
RUSSIA Outlook (USD Billion, 2019-2032)
RUSSIA Demand Response Management System Market by Application Type
Commercial
Industrial
Residential
Utility
RUSSIA Demand Response Management System Market by End User Type
Electricity Providers
Commercial Establishments
Industrial Facilities
Government
RUSSIA Demand Response Management System Market by Deployment Type
On-Premise
Cloud-Based
RUSSIA Demand Response Management System Market by Component Type
Solutions
Services
ITALY Outlook (USD Billion, 2019-2032)
ITALY Demand Response Management System Market by Application Type
Commercial
Industrial
Residential
Utility
ITALY Demand Response Management System Market by End User Type
Electricity Providers
Commercial Establishments
Industrial Facilities
Government
ITALY Demand Response Management System Market by Deployment Type
On-Premise
Cloud-Based
ITALY Demand Response Management System Market by Component Type
Solutions
Services
SPAIN Outlook (USD Billion, 2019-2032)
SPAIN Demand Response Management System Market by Application Type
Commercial
Industrial
Residential
Utility
SPAIN Demand Response Management System Market by End User Type
Electricity Providers
Commercial Establishments
Industrial Facilities
Government
SPAIN Demand Response Management System Market by Deployment Type
On-Premise
Cloud-Based
SPAIN Demand Response Management System Market by Component Type
Solutions
Services
REST OF EUROPE Outlook (USD Billion, 2019-2032)
REST OF EUROPE Demand Response Management System Market by Application Type
Commercial
Industrial
Residential
Utility
REST OF EUROPE Demand Response Management System Market by End User Type
Electricity Providers
Commercial Establishments
Industrial Facilities
Government
REST OF EUROPE Demand Response Management System Market by Deployment Type
On-Premise
Cloud-Based
REST OF EUROPE Demand Response Management System Market by Component Type
Solutions
Services
APAC Outlook (USD Billion, 2019-2032)
APAC Demand Response Management System Market by Application Type
Commercial
Industrial
Residential
Utility
APAC Demand Response Management System Market by End User Type
Electricity Providers
Commercial Establishments
Industrial Facilities
Government
APAC Demand Response Management System Market by Deployment Type
On-Premise
Cloud-Based
APAC Demand Response Management System Market by Component Type
Solutions
Services
APAC Demand Response Management System Market by Regional Type
China
India
Japan
South Korea
Malaysia
Thailand
Indonesia
Rest of APAC
CHINA Outlook (USD Billion, 2019-2032)
CHINA Demand Response Management System Market by Application Type
Commercial
Industrial
Residential
Utility
CHINA Demand Response Management System Market by End User Type
Electricity Providers
Commercial Establishments
Industrial Facilities
Government
CHINA Demand Response Management System Market by Deployment Type
On-Premise
Cloud-Based
CHINA Demand Response Management System Market by Component Type
Solutions
Services
INDIA Outlook (USD Billion, 2019-2032)
INDIA Demand Response Management System Market by Application Type
Commercial
Industrial
Residential
Utility
INDIA Demand Response Management System Market by End User Type
Electricity Providers
Commercial Establishments
Industrial Facilities
Government
INDIA Demand Response Management System Market by Deployment Type
On-Premise
Cloud-Based
INDIA Demand Response Management System Market by Component Type
Solutions
Services
JAPAN Outlook (USD Billion, 2019-2032)
JAPAN Demand Response Management System Market by Application Type
Commercial
Industrial
Residential
Utility
JAPAN Demand Response Management System Market by End User Type
Electricity Providers
Commercial Establishments
Industrial Facilities
Government
JAPAN Demand Response Management System Market by Deployment Type
On-Premise
Cloud-Based
JAPAN Demand Response Management System Market by Component Type
Solutions
Services
SOUTH KOREA Outlook (USD Billion, 2019-2032)
SOUTH KOREA Demand Response Management System Market by Application Type
Commercial
Industrial
Residential
Utility
SOUTH KOREA Demand Response Management System Market by End User Type
Electricity Providers
Commercial Establishments
Industrial Facilities
Government
SOUTH KOREA Demand Response Management System Market by Deployment Type
On-Premise
Cloud-Based
SOUTH KOREA Demand Response Management System Market by Component Type
Solutions
Services
MALAYSIA Outlook (USD Billion, 2019-2032)
MALAYSIA Demand Response Management System Market by Application Type
Commercial
Industrial
Residential
Utility
MALAYSIA Demand Response Management System Market by End User Type
Electricity Providers
Commercial Establishments
Industrial Facilities
Government
MALAYSIA Demand Response Management System Market by Deployment Type
On-Premise
Cloud-Based
MALAYSIA Demand Response Management System Market by Component Type
Solutions
Services
THAILAND Outlook (USD Billion, 2019-2032)
THAILAND Demand Response Management System Market by Application Type
Commercial
Industrial
Residential
Utility
THAILAND Demand Response Management System Market by End User Type
Electricity Providers
Commercial Establishments
Industrial Facilities
Government
THAILAND Demand Response Management System Market by Deployment Type
On-Premise
Cloud-Based
THAILAND Demand Response Management System Market by Component Type
Solutions
Services
INDONESIA Outlook (USD Billion, 2019-2032)
INDONESIA Demand Response Management System Market by Application Type
Commercial
Industrial
Residential
Utility
INDONESIA Demand Response Management System Market by End User Type
Electricity Providers
Commercial Establishments
Industrial Facilities
Government
INDONESIA Demand Response Management System Market by Deployment Type
On-Premise
Cloud-Based
INDONESIA Demand Response Management System Market by Component Type
Solutions
Services
REST OF APAC Outlook (USD Billion, 2019-2032)
REST OF APAC Demand Response Management System Market by Application Type
Commercial
Industrial
Residential
Utility
REST OF APAC Demand Response Management System Market by End User Type
Electricity Providers
Commercial Establishments
Industrial Facilities
Government
REST OF APAC Demand Response Management System Market by Deployment Type
On-Premise
Cloud-Based
REST OF APAC Demand Response Management System Market by Component Type
Solutions
Services
South America Outlook (USD Billion, 2019-2032)
South America Demand Response Management System Market by Application Type
Commercial
Industrial
Residential
Utility
South America Demand Response Management System Market by End User Type
Electricity Providers
Commercial Establishments
Industrial Facilities
Government
South America Demand Response Management System Market by Deployment Type
On-Premise
Cloud-Based
South America Demand Response Management System Market by Component Type
Solutions
Services
South America Demand Response Management System Market by Regional Type
Brazil
Mexico
Argentina
Rest of South America
BRAZIL Outlook (USD Billion, 2019-2032)
BRAZIL Demand Response Management System Market by Application Type
Commercial
Industrial
Residential
Utility
BRAZIL Demand Response Management System Market by End User Type
Electricity Providers
Commercial Establishments
Industrial Facilities
Government
BRAZIL Demand Response Management System Market by Deployment Type
On-Premise
Cloud-Based
BRAZIL Demand Response Management System Market by Component Type
Solutions
Services
MEXICO Outlook (USD Billion, 2019-2032)
MEXICO Demand Response Management System Market by Application Type
Commercial
Industrial
Residential
Utility
MEXICO Demand Response Management System Market by End User Type
Electricity Providers
Commercial Establishments
Industrial Facilities
Government
MEXICO Demand Response Management System Market by Deployment Type
On-Premise
Cloud-Based
MEXICO Demand Response Management System Market by Component Type
Solutions
Services
ARGENTINA Outlook (USD Billion, 2019-2032)
ARGENTINA Demand Response Management System Market by Application Type
Commercial
Industrial
Residential
Utility
ARGENTINA Demand Response Management System Market by End User Type
Electricity Providers
Commercial Establishments
Industrial Facilities
Government
ARGENTINA Demand Response Management System Market by Deployment Type
On-Premise
Cloud-Based
ARGENTINA Demand Response Management System Market by Component Type
Solutions
Services
REST OF SOUTH AMERICA Outlook (USD Billion, 2019-2032)
REST OF SOUTH AMERICA Demand Response Management System Market by Application Type
Commercial
Industrial
Residential
Utility
REST OF SOUTH AMERICA Demand Response Management System Market by End User Type
Electricity Providers
Commercial Establishments
Industrial Facilities
Government
REST OF SOUTH AMERICA Demand Response Management System Market by Deployment Type
On-Premise
Cloud-Based
REST OF SOUTH AMERICA Demand Response Management System Market by Component Type
Solutions
Services
MEA Outlook (USD Billion, 2019-2032)
MEA Demand Response Management System Market by Application Type
Commercial
Industrial
Residential
Utility
MEA Demand Response Management System Market by End User Type
Electricity Providers
Commercial Establishments
Industrial Facilities
Government
MEA Demand Response Management System Market by Deployment Type
On-Premise
Cloud-Based
MEA Demand Response Management System Market by Component Type
Solutions
Services
MEA Demand Response Management System Market by Regional Type
GCC Countries
South Africa
Rest of MEA
GCC COUNTRIES Outlook (USD Billion, 2019-2032)
GCC COUNTRIES Demand Response Management System Market by Application Type
Commercial
Industrial
Residential
Utility
GCC COUNTRIES Demand Response Management System Market by End User Type
Electricity Providers
Commercial Establishments
Industrial Facilities
Government
GCC COUNTRIES Demand Response Management System Market by Deployment Type
On-Premise
Cloud-Based
GCC COUNTRIES Demand Response Management System Market by Component Type
Solutions
Services
SOUTH AFRICA Outlook (USD Billion, 2019-2032)
SOUTH AFRICA Demand Response Management System Market by Application Type
Commercial
Industrial
Residential
Utility
SOUTH AFRICA Demand Response Management System Market by End User Type
Electricity Providers
Commercial Establishments
Industrial Facilities
Government
SOUTH AFRICA Demand Response Management System Market by Deployment Type
On-Premise
Cloud-Based
SOUTH AFRICA Demand Response Management System Market by Component Type
Solutions
Services
REST OF MEA Outlook (USD Billion, 2019-2032)
REST OF MEA Demand Response Management System Market by Application Type
Commercial
Industrial
Residential
Utility
REST OF MEA Demand Response Management System Market by End User Type
Electricity Providers
Commercial Establishments
Industrial Facilities
Government
REST OF MEA Demand Response Management System Market by Deployment Type
On-Premise
Cloud-Based
REST OF MEA Demand Response Management System Market by Component Type
Solutions
Services

Free Sample Request
Kindly complete the form below to receive a free sample of this Report
Customer Strories
“I am very pleased with how market segments have been defined in a relevant way for my purposes (such as "Portable Freezers & refrigerators" and "last-mile"). In general the report is well structured. Thanks very much for your efforts.”
Leave a Comment