ID: MRFR/E&P/5231-HCR | February 2021 | Region: Global | 100 pages
Market Overview:
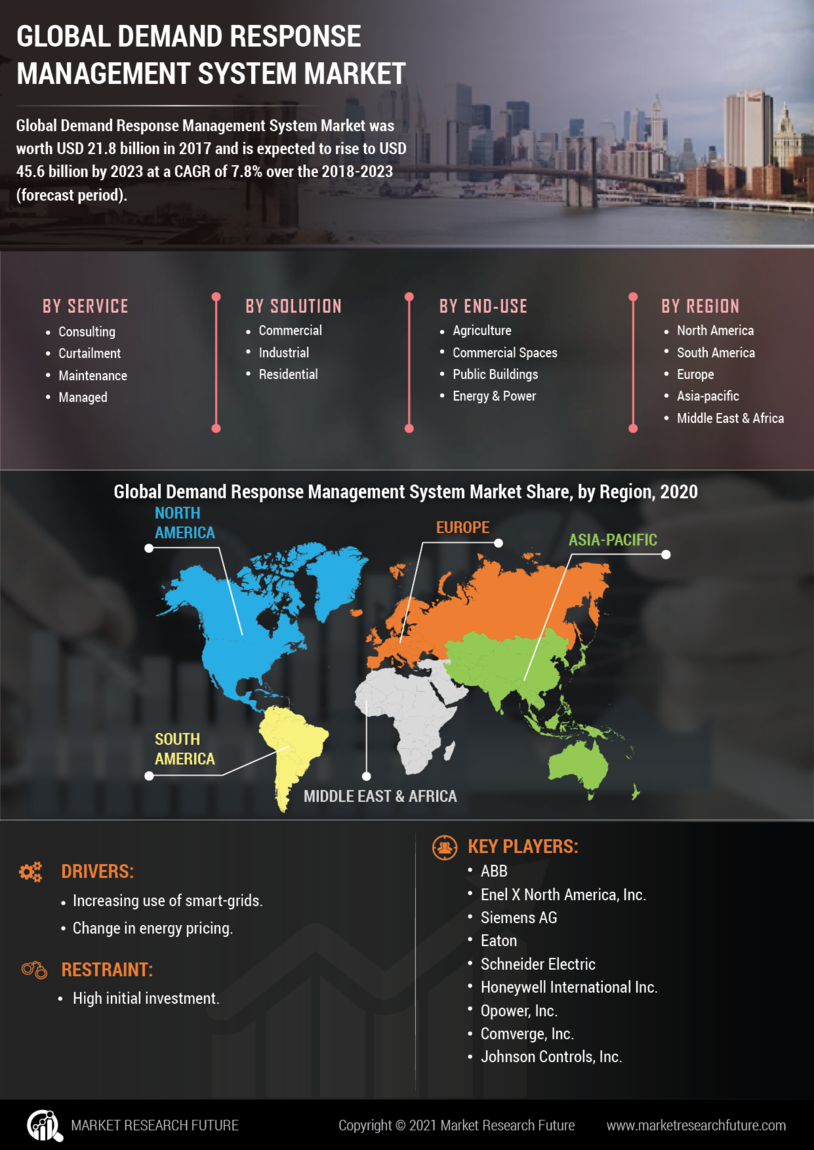
Demand Response Management Systems (DRMS) are software platforms used by utilities and energy suppliers to track and comprehensively manage their operations. The Global Demand Response Management Systems Market is driven primarily by the growing adoption of smart grid systems across the globe. The demand for smart grids has grown progressively as people have come to realize their various benefits over conventional grid systems. Smart grid systems allow better tracking of the energy consumption and help reduce the overall energy consumption, making them highly valuable in today’s times of resource conservation and environmental protection.
Increasing demand for smart grids and demand response management systems from the residential sector is likely to be a major opportunity for players in the DRMS market over the forecast period. The residential sector has become a major market for smart grid technology over the last few years, as individual consumers and families have become increasingly aware to the positive environmental impact they can have through simple measures such as adopting smart grids and keeping their energy consumption in check. The financial benefits of smart grid systems have also convinced residential consumers to opt for smart grids over the last few years. This is likely to be a major demand channel for the global demand response management system market over the forecast period.
On the other hand, the high initial investment required for demand response management systems is likely to hamper the market’s growth prospects over the forecast period. While the long-term benefits of DRMS are immense, the high initial costs act as a deterrent to their widespread uptake, especially in the residential sector, where individual users may not necessarily be ready to spend large amounts on installing demand response management systems.
According to Market Research Future (MRFR), the Global Demand Response Management Systems Market was worth USD 21.8 billion in 2017 and is expected to rise to USD 45.6 billion by 2023 at a CAGR of 7.8% over the 2018-2023 (forecast period).
Segmentation
The Global Demand Response Management Systems Market is segmented by Service, Solution, End-Use, and Region.
The Global DRMS Market is segmented by service into consulting, curtailment, maintenance, and managed. Consulting is likely to be the leading service segment within the Global Demand Response Management Systems Market over the forecast period as well as the fastest growing.
By Solution, the Global Demand Response Management Systems Market is segmented into commercial, industrial, and residential. Commercial solutions are the leading revenue generators for the Global Demand Response Management Systems Market and are likely to remain in the position over the forecast period due to the growing demand for demand response management systems in large-scale energy grids.
By End-Use, the DRMS Market is segmented into agriculture, commercial spaces, public buildings, energy and power. Public buildings are likely to be the leading consumer of Demand Response Management Systems over the forecast period, due to the affordability of DRMS for government agencies and the growing government support for energy saving mechanisms such as DRMS.
Regional Analysis
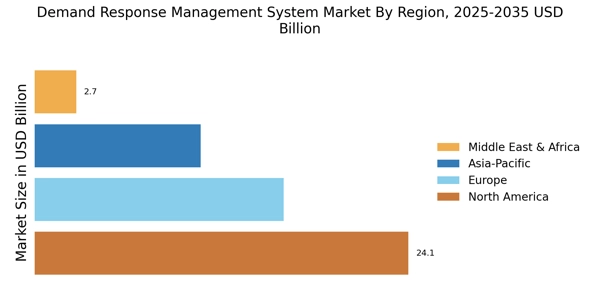
Regionally, the Global Demand Response Management Systems Market is segmented into North America, Europe, Asia Pacific (APAC), and Rest-of-the-World. North America is likely to be the dominant contributor to the Global Demand Response Management Systems Market over the forecast period due to the widespread establishment of smart grid infrastructure in countries such as the U.S., which has made it easier to adopt demand response management systems on a similar scale. APAC is likely to be a major market for demand response management systems over the forecast period due to the growing demand from entities in the government sector as well as residential sector for smart grid development, which is likely to drive the demand for demand response management systems.
Competitive Analysis:
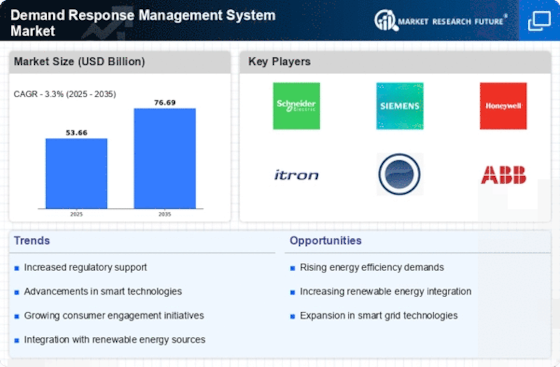
Leading players in the DRMS Market include ABB (Switzerland), Enel X North America, Inc. (U.S.), Siemens AG (Germany), Eaton (Republic of Ireland), Schneider Electric (France), Honeywell International Inc. (U.S.), Opower, Inc. (U.S.), Comverge, Inc. (U.S.), and Johnson Controls, Inc. (U.S.)
Report Methodology
Accuracy of the data has been maintained at all cost in the report. The report contains information gathered from primary interviews with the industry’s leading lights as well as information gathered from reliable secondary research. The research is carried out according to a domain-specific formula to ensure the accuracy of the data gathered. A comprehensive look at the market is provided through the report’s granular look at the market’s segmentation, and the use of a top-down and bottom-up approach supports this premise.
Global Demand Response Management System Market by Service
Global Demand Response Management System Market by Solution
Global Demand Response Management System Market by End-use
Global Demand Response Management System Market by Region
Frequently Asked Questions (FAQ) :
The demand response management system market can thrive at 7.8% CAGR by 2023.
The demand response management system market can attain a value of USD 45.6 Bn by 2023
Honeywell International Inc. (U.S.), Comverge, Inc. (U.S.), Opower, Inc. (U.S.), and Johnson Controls, Inc. (U.S.) are some key players of the demand response management system market.
The high requirement for smart grids can propel the demand response management system market growth.
The high adoption of demand response management system across industries in North America can prompt the demand response management system market growth.
Table of Contents
1 Executive Summary
2 Market Introduction
2.1 Definition
2.2 Scope of the Study
2.3 Market Structure
2.4 Key Takeaways
2.5 Macro Factor Indicators Analysis
2.5.1 GDP (USD Million)
2.5.2 GNI Per Capita, Atlas Method (USD)
2.5.3 GDP Per Capita PPP (USD)
3 Market Insights
4 Research Methodology
4.1 Research Solution Type
4.2 Primary Research
4.3 Secondary Research
4.4 Market Size Estimation
4.5 Forecast Model
4.6 List of Assumptions
5 Market Dynamics
5.1 Introduction
5.2 Drivers
5.2.1 Increasing use of Smart-Grids
5.2.2 Change in Energy Pricing
5.2.3 Drivers Impact Analysis
5.3 Restraints
5.3.1 High Initial Investment
5.3.2 Restraints Impact Analysis
5.4 Opportunities
5.4.1 Growing Demand from Residential Sector
5.5 Value Chain Analysis
5.5 Porter’s Five Forces Model
5.5.1 Threat of New Entrants
5.5.2 Bargaining Power of Suppliers
5.5.3 Bargaining Power of Buyers
5.5.4 Threat of Substitutes
5.5.5 Intensity of Rivalry
6 Global Demand Response Management System Market, By Service
6.1 Overview
6.1.1 Consulting
6.1.1.1 Market Estimates & Forecast, 2018-2023
6.1.1.2 Market Estimates & Forecast, By Region/Country, 2018-2023
6.1.2 Curtailment
6.1.2.1 Market Estimates & Forecast, 2018-2023
6.1.2.2 Market Estimates & Forecast, By Region/Country, 2018-2023
6.1.3 Maintenance
6.1.3.1 Market Estimates & Forecast, 2018-2023
6.1.3.2 Market Estimates & Forecast, By Region/Country, 2018-2023
6.1.4 Managed
6.1.4.1 Market Estimates & Forecast, 2018-2023
6.1.4.2 Market Estimates & Forecast, By Region/Country, 2018-2023
7 Global Demand Response Management System Market, By Solution
7.1 Overview
7.1.1 Commercial
7.1.1.1 Market Estimates & Forecast, 2018-2023
7.1.1.2 Market Estimates & Forecast, By Region/Country, 2018-2023
7.1.2 Industrial
7.1.2.1 Market Estimates & Forecast, 2018-2023
7.1.2.2 Market Estimates & Forecast, By Region/Country, 2018-2023
7.1.3 Residential
7.1.3.1 Market Estimates & Forecast, 2018-2023
7.1.3.2 Market Estimates & Forecast, By Region/Country, 2018-2023
8 Global Demand Response Management System Market, By End-User
8.1 Overview
8.1.1 Agriculture
8.1.1.1 Market Estimates & Forecast, 2018-2023
8.1.1.2 Market Estimates & Forecast, By Region/Country, 2018-2023
8.1.2 Commercial Spaces
8.1.2.1 Market Estimates & Forecast, 2018-2023
8.1.2.2 Market Estimates & Forecast, By Region/Country, 2018-2023
8.1.3 Public Buildings
8.1.3.1 Market Estimates & Forecast, 2018-2023
8.1.3.2 Market Estimates & Forecast, By Region/Country, 2018-2023
8.1.4 Energy and Power
8.1.4.1 Market Estimates & Forecast, 2018-2023
8.1.4.2 Market Estimates & Forecast, By Region/Country, 2018-2023
9 Global Demand Response Management System Market, By Region
9.1 Overview
9.2 North America
9.2.1 Market Estimates & Forecast, By Country, 2018-2023
9.2.2 Market Estimates & Forecast, By Service, 2018-2023
9.2.3 Market Estimates & Forecast, By Solution, 2018-2023
9.2.4 Market Estimates & Forecast, By End-User, 2018-2023
9.2.5 US
9.2.5.1 Market Estimates & Forecast, By Service, 2018-2023
9.2.5.2 Market Estimates & Forecast, By Solution, 2018-2023
9.2.5.3 Market Estimates & Forecast, By End-User, 2018-2023
9.2.6 Canada
9.2.6.1 Market Estimates & Forecast, By Service, 2018-2023
9.2.6.2 Market Estimates & Forecast, By Solution, 2018-2023
9.2.6.3 Market Estimates & Forecast, By End-User, 2018-2023
9.3 Europe
9.3.1 Market Estimates & Forecast, By Country, 2018-2023
9.3.2 Market Estimates & Forecast, By Service, 2018-2023
9.3.3 Market Estimates & Forecast, By Solution, 2018-2023
9.3.4 Market Estimates & Forecast, By End-User, 2018-2023
9.3.5 Germany
9.3.5.1 Market Estimates & Forecast, By Service, 2018-2023
9.3.5.2 Market Estimates & Forecast, By Solution, 2018-2023
9.3.5.3 Market Estimates & Forecast, By End-User, 2018-2023
9.3.6 Italy
9.3.6.1 Market Estimates & Forecast, By Service, 2018-2023
9.3.6.2 Market Estimates & Forecast, By Solution, 2018-2023
9.3.6.3 Market Estimates & Forecast, By End-User, 2018-2023
9.3.7 UK
9.3.7.1 Market Estimates & Forecast, By Service, 2018-2023
9.3.7.2 Market Estimates & Forecast, By Solution, 2018-2023
9.3.7.3 Market Estimates & Forecast, By End-User, 2018-2023
9.3.8 Spain
9.3.8.1 Market Estimates & Forecast, By Service, 2018-2023
9.3.8.2 Market Estimates & Forecast, By Solution, 2018-2023
9.3.8.3 Market Estimates & Forecast, By End-User, 2018-2023
9.3.9 Rest of Europe
9.3.9.1 Market Estimates & Forecast, By Service, 2018-2023
9.3.9.2 Market Estimates & Forecast, By Solution, 2018-2023
9.3.9.3 Market Estimates & Forecast, By End-User, 2018-2023
9.4 Asia Pacific
9.4.1 Market Estimates & Forecast, By Country, 2018-2023
9.4.2 Market Estimates & Forecast, By Service, 2018-2023
9.4.3 Market Estimates & Forecast, By Solution, 2018-2023
9.4.4 Market Estimates & Forecast, By End-User, 2018-2023
9.4.5 China
9.4.5.1 Market Estimates & Forecast, By Service, 2018-2023
9.4.5.2 Market Estimates & Forecast, By Solution, 2018-2023
9.4.5.3 Market Estimates & Forecast, By End-User, 2018-2023
9.4.6 India
9.4.6.1 Market Estimates & Forecast, By Service, 2018-2023
9.4.6.2 Market Estimates & Forecast, By Solution, 2018-2023
9.4.6.3 Market Estimates & Forecast, By End-User, 2018-2023
9.4.7 Japan
9.4.7.1 Market Estimates & Forecast, By Service, 2018-2023
9.4.7.2 Market Estimates & Forecast, By Solution, 2018-2023
9.4.7.3 Market Estimates & Forecast, By End-User, 2018-2023
9.4.8 Rest of Asia Pacific
9.4.8.1 Market Estimates & Forecast, By Service, 2018-2023
9.4.8.2 Market Estimates & Forecast, By Solution, 2018-2023
9.4.8.3 Market Estimates & Forecast, By End-User, 2018-2023
9.6 Rest of the World
9.6.1 Market Estimates & Forecast, By Country, 2018-2023
9.6.2 Market Estimates & Forecast, By Service, 2018-2023
9.6.3 Market Estimates & Forecast, By Solution, 2018-2023
9.6.4 Market Estimates & Forecast, By End-User, 2018-2023
9.6.5 Latin America
9.6.5.1 Market Estimates & Forecast, By Service, 2018-2023
9.6.5.2 Market Estimates & Forecast, By Solution, 2018-2023
9.6.5.3 Market Estimates & Forecast, By End-User, 2018-2023
9.6.6 Middle East & Africa
9.6.6.1 Market Estimates & Forecast, By Service, 2018-2023
9.6.6.2 Market Estimates & Forecast, By Solution, 2018-2023
9.6.6.3 Market Estimates & Forecast, By End-User, 2018-2023
10 Competitive Landscape
10.1 Competitive Scenario
10.1.1 Competitive Overview of the Demand Response Management System Market
10.1.2 Competitive Benchmarking of the Demand Response Management System Market
10.1.3 Market Share Analysis: Demand Response Management System Service Provider
10.1.5 New Product Development
10.1.6 Merger & Acquisition in Demand Response Management System Market
10.1.7 Partnership/Collaboration
10.1.8 Joint Ventures
11 Company Profiles
11.1 ABB
11.1.1 Company Overview
11.1.2 Financial Overview
11.1.3 Product Offerings
11.1.4 Key Developments
11.1.6 SWOT Analysis
11.1.6 Key Strategy
11.2 Enel X North America, Inc.
11.2.1 Company Overview
11.2.2 Financial Overview
11.2.3 Product Offerings
11.2.4 Key Developments
11.2.6 SWOT Analysis
11.2.6 Key Strategy
11.3 Siemens AG
11.3.1 Company Overview
11.3.2 Financial Overview
11.3.3 Product Offerings
11.3.4 Key Developments
11.3.6 SWOT Analysis
11.3.6 Key Strategy
11.4 Eaton
11.4.1 Company Overview
11.4.2 Financial Overview
11.4.3 Product Offerings
11.4.4 Key Developments
11.4.6 SWOT Analysis
11.4.6 Key Strategy
11.5 Schneider Electric
11.5.1 Company Overview
11.5.2 Financial Overview
11.5.3 Product Offerings
11.5.4 Key Developments
11.5.5 SWOT Analysis
11.6.6 Key Strategy
11.6 Honeywell International Inc
11.6.1 Company Overview
11.6.2 Financial Overview
11.6.3 Product Offerings
11.6.4 Key Developments
11.6.6 SWOT Analysis
11.6.6 Key Strategy
11.7 Opower, Inc.
11.7.1 Company Overview
11.7.2 Financial Overview
11.7.3 Product Offerings
11.7.4 Key Developments
11.7.6 SWOT Analysis
11.7.6 Key Strategy
11.8 Comverge, Inc
11.8.1 Company Overview
11.8.2 Financial Overview
11.8.3 Product Offerings
11.8.4 Key Developments
11.8.6 SWOT Analysis
11.8.6 Key Strategy
11.9 Johnson Controls, Inc
11.9.1 Company Overview
11.9.2 Financial Overview
11.9.3 Product Offerings
11.9.4 Key Developments
11.9.6 SWOT Analysis
11.9.6 Key Strategy
Note: The companies listed above are based on initial secondary research, the detailed list of players will be covered in the final study and according to the client requirements.
List of Table
Table 1 GLOBAL DEMAND RESPONSE MANAGEMENT SYSTEM MARKET BY SERVICE
Table 2 GLOBAL DEMAND RESPONSE MANAGEMENT SYSTEM MARKET BY SOLUTION
Table 3 GLOBAL DEMAND RESPONSE MANAGEMENT SYSTEM MARKET BY END-USER
Table 5 GLOBAL DEMAND RESPONSE MANAGEMENT SYSTEM MARKET BY GEOGRAPHY
Table 6 NORTH AMERICA DEMAND RESPONSE MANAGEMENT SYSTEM MARKET BY SERVICE
Table 7 NORTH AMERICA DEMAND RESPONSE MANAGEMENT SYSTEM MARKET BY SOLUTION
Table 8 NORTH AMERICA DEMAND RESPONSE MANAGEMENT SYSTEM MARKET BY END-USER
Table 9 US DEMAND RESPONSE MANAGEMENT SYSTEM MARKET
Table 10 US DEMAND RESPONSE MANAGEMENT SYSTEM MARKET BY SERVICE
Table 11 US DEMAND RESPONSE MANAGEMENT SYSTEM MARKET BY SOLUTION
Table 12 US DEMAND RESPONSE MANAGEMENT SYSTEM MARKET BY END-USER
Table 13 CANADA DEMAND RESPONSE MANAGEMENT SYSTEM MARKET BY SERVICE
Table 14 CANADA DEMAND RESPONSE MANAGEMENT SYSTEM MARKET BY SOLUTION
Table 15 CANADA DEMAND RESPONSE MANAGEMENT SYSTEM MARKET BY END-USER
Table 16 EUROPE DEMAND RESPONSE MANAGEMENT SYSTEM MARKET BY SERVICE
Table 17 EUROPE DEMAND RESPONSE MANAGEMENT SYSTEM MARKET BY SOLUTION
Table 18 EUROPE DEMAND RESPONSE MANAGEMENT SYSTEM MARKET BY END-USER
Table 19 GERMANY DEMAND RESPONSE MANAGEMENT SYSTEM MARKET BY SERVICE
Table 20 GERMANY DEMAND RESPONSE MANAGEMENT SYSTEM MARKET BY SOLUTION
Table 21 GERMANY DEMAND RESPONSE MANAGEMENT SYSTEM MARKET BY END-USER
Table 22 ITALY DEMAND RESPONSE MANAGEMENT SYSTEM MARKET BY SERVICE
Table 23 ITALY DEMAND RESPONSE MANAGEMENT SYSTEM MARKET BY SOLUTION
Table 24 ITALY DEMAND RESPONSE MANAGEMENT SYSTEM MARKET BY END-USER
Table 25 UK DEMAND RESPONSE MANAGEMENT SYSTEM MARKET BY SERVICE
Table 26 UK DEMAND RESPONSE MANAGEMENT SYSTEM MARKET BY SOLUTION
Table 27 UK DEMAND RESPONSE MANAGEMENT SYSTEM MARKET BY END-USER
Table 28 SPAIN DEMAND RESPONSE MANAGEMENT SYSTEM MARKET BY SERVICE
Table 29 SPAIN DEMAND RESPONSE MANAGEMENT SYSTEM MARKET BY SOLUTION
Table 30 SPAIN DEMAND RESPONSE MANAGEMENT SYSTEM MARKET BY END-USER
Table 31 REST OF EUROPE DEMAND RESPONSE MANAGEMENT SYSTEM MARKET BY SERVICE
Table 32 REST OF EUROPE DEMAND RESPONSE MANAGEMENT SYSTEM MARKET BY SOLUTION
Table 33 REST OF EUROPE DEMAND RESPONSE MANAGEMENT SYSTEM MARKET BY END-USER
Table 34 ASIA-PACIFIC DEMAND RESPONSE MANAGEMENT SYSTEM MARKET BY SERVICE
Table 35 ASIA-PACIFIC DEMAND RESPONSE MANAGEMENT SYSTEM MARKET BY SOLUTION
Table 36 ASIA-PACIFIC DEMAND RESPONSE MANAGEMENT SYSTEM MARKET BY END-USER
Table 37 CHINA DEMAND RESPONSE MANAGEMENT SYSTEM MARKET BY SERVICE
Table 38 CHINA DEMAND RESPONSE MANAGEMENT SYSTEM MARKET BY SOLUTION
Table 39 CHINA DEMAND RESPONSE MANAGEMENT SYSTEM MARKET BY END-USER
Table 40 INDIA DEMAND RESPONSE MANAGEMENT SYSTEM MARKET BY SERVICE
Table 41 INDIA DEMAND RESPONSE MANAGEMENT SYSTEM MARKET BY SOLUTION
Table 42 INDIA DEMAND RESPONSE MANAGEMENT SYSTEM MARKET BY END-USER
Table 43 JAPAN DEMAND RESPONSE MANAGEMENT SYSTEM MARKET BY SERVICE
Table 44 JAPAN DEMAND RESPONSE MANAGEMENT SYSTEM MARKET BY SOLUTION
Table 45 JAPAN DEMAND RESPONSE MANAGEMENT SYSTEM MARKET BY END-USER
Table 46 REST OF APAC DEMAND RESPONSE MANAGEMENT SYSTEM MARKET BY SERVICE
Table 47 REST OF APAC DEMAND RESPONSE MANAGEMENT SYSTEM MARKET BY SOLUTION
Table 48 REST OF APAC DEMAND RESPONSE MANAGEMENT SYSTEM MARKET BY END-USER
Table 49 REST OF THE WORLD DEMAND RESPONSE MANAGEMENT SYSTEM MARKET BY SERVICE
Table 50 REST OF THE WORLD DEMAND RESPONSE MANAGEMENT SYSTEM MARKET BY SOLUTION
Table 51 REST OF THE WORLD DEMAND RESPONSE MANAGEMENT SYSTEM MARKET BY END-USER
Table 52 LATIN AMERICA DEMAND RESPONSE MANAGEMENT SYSTEM MARKET BY SERVICE
Table 53 LATIN AMERICA DEMAND RESPONSE MANAGEMENT SYSTEM MARKET BY SOLUTION
Table 54 LATIN AMERICA DEMAND RESPONSE MANAGEMENT SYSTEM MARKET BY END-USER
Table 55 MIDDLE EAST AND AFRICA DEMAND RESPONSE MANAGEMENT SYSTEM MARKET BY SERVICE
Table 56 MIDDLE EAST AND AFRICA DEMAND RESPONSE MANAGEMENT SYSTEM MARKET BY SOLUTION
Table 57 MIDDLE EAST AND AFRICA DEMAND RESPONSE MANAGEMENT SYSTEM MARKET BY END-USER
Table 58 NEW PRODUCT DEVELOPMENT: - KEY DEVELOPMENT ANALYSIS, 2014 TO 2017
Table 59 MAJOR ACQUISITION & EXPANSION: - KEY DEVELOPMENT ANALYSIS, 2014 TO 2017
List of Figure
FIGURE 1 GLOBAL DEMAND RESPONSE MANAGEMENT SYSTEM MARKET: MARKET STRUCTURE
FIGURE 2 RESEARCH SOLUTION TYPE OF MRFR
FIGURE 3 TOP DOWN & BOTTOM UP APPROACH
FIGURE 4 DROC ANALYSIS OF GLOBAL DEMAND RESPONSE MANAGEMENT SYSTEM MARKET
FIGURE 6 DRIVERS IMPACT ANALYSIS: DEMAND RESPONSE MANAGEMENT SYSTEM MARKET
FIGURE 6 RESTRAINTS IMPACT ANALYSIS: DEMAND RESPONSE MANAGEMENT SYSTEM MARKET
FIGURE 7 VALUE CHAIN: DEMAND RESPONSE MANAGEMENT SYSTEM MARKET
FIGURE 8 PORTER'S FIVE FORCES ANALYSIS OF THE GLOBAL DEMAND RESPONSE MANAGEMENT SYSTEM MARKET
FIGURE 10 GLOBAL DEMAND RESPONSE MANAGEMENT SYSTEM MARKET, BY SERVICE, 2017 (% SHARE)
FIGURE 11 GLOBAL DEMAND RESPONSE MANAGEMENT SYSTEM MARKET, BY SOLUTION, 2017 (% SHARE)
FIGURE 12 GLOBAL DEMAND RESPONSE MANAGEMENT SYSTEM MARKET, BY END-USER, 2017 (% SHARE)
FIGURE 13 NORTH AMERICA: DEMAND RESPONSE MANAGEMENT SYSTEM MARKETSHARE, BY COUNTRY, 2017 (% SHARE)
FIGURE 14 EUROPE DEMAND RESPONSE MANAGEMENT SYSTEM MARKET, BY COUNTRY, 2017 (% SHARE)
FIGURE 15 ASIA PACIFIC DEMAND RESPONSE MANAGEMENT SYSTEM MARKET, BY COUNTRY, 2017 (% SHARE)
FIGURE 16 REST OF THE WORLD DEMAND RESPONSE MANAGEMENT SYSTEM MARKET, BY REGION, 2017 (% SHARE)
FIGURE 17 BENCHMARKING OF MAJOR COMPETITORS
FIGURE 18 MAJOR MANUFACTURER MARKET SHARE ANALYSIS, 2017 (% SHARE)