• Cat-intel
  • MedIntelliX
  • Resources
  • About Us
  • Hero Background
    English
    Chinese
    French
    Japanese
    Korean
    German
    Spanish

    Business Process as a Service Market Share

    ID: MRFR/ICT/9210-HCR
    99 Pages
    Ankit Gupta
    October 2025

    Business Process as a Service Market Research Report Information by Process Type (Human Resource Management, Finance & Accounting, Sales & Marketing, Data & Analytics, Customer Service & Support, Procurement & Supply Chain Management, Operations, and Others), Organization Size (Large, Small & Medium Enterprise), Vertical (BFSI, IT & Telecommunications, Manufacturing,...

    Share:
    Download PDF ×

    We do not share your information with anyone. However, we may send you emails based on your report interest from time to time. You may contact us at any time to opt-out.

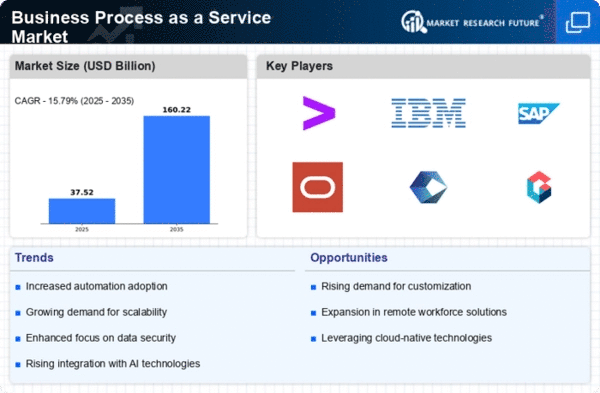
    Business Process as a Service Market Infographic
    $ 4,950.0
    $ 5,950.0
    $ 7,250.0

    Market Share

    Business Process as a Service Market Share Analysis

    Businesses may use a variety of market share positioning tactics in the diversified environment provided by the business process as a service (BPaaS) market. Product differentiation is a popular strategy, with businesses highlighting the unique qualities and advantages of their BPaaS offerings. This might include emphasizing improved automation capabilities, simplified corporate procedures, or market-specific knowledge. Businesses want to make a name for themselves in the market and draw in customers who are searching for certain enhancements to their company processes by exhibiting these differentiators. Another important tactic is cost leadership, in which businesses concentrate on providing BPaaS products at a competitive cost. Offering affordable but effective business process solutions may help enterprises acquire market share and appeal to budget-conscious businesses. Another important factor is market segmentation, wherein businesses identify and target certain business sectors or industries with specialized BPaaS products. Businesses may place their goods to solve certain business difficulties and increase their market share inside niches by knowing the particular demands of various market groups. The BPaaS market is driven by innovation, as businesses are always looking to integrate state-of-the-art analytics, integration, and process automation capabilities. Companies may draw in tech-savvy clients and build a strong brand by keeping ahead of the curve and providing cutting-edge solutions. Alliances and partnerships are also crucial, as businesses work together with other technology suppliers, advisory services, or sector specialists to increase their market share. Companies may increase their market share and impact by partnering with complementary services and building strategic alliances that capitalize on each other's advantages. In the BPaaS market, market share positioning may be significantly impacted by Customer Experience and Support, two important elements. Businesses may draw and keep a wider clientele by emphasizing user-friendly interfaces, smooth deployment procedures, and attentive customer support, which will eventually boost their position in the BPaaS market. Businesses may expand their market share by fostering enduring connections and customer loyalty via the provision of excellent customer experiences. The positioning of market share is also significantly shaped by marketing and communication initiatives. Businesses take part in thought leadership material, targeted advertising, market events, and aggressive marketing and promotional campaigns. The objectives of these endeavors are to elevate awareness, cultivate brand identity, and forge a robust foothold within the BPaaS market. Through proficient communication of the benefits of their BPaaS solutions to the intended audience, businesses may impact procurement choices and get a competitive advantage.

    Market Summary

    As per Market Research Future Analysis, the Business Process as a Service (BPaaS) market is projected to grow significantly, with an expected CAGR of 16% during the forecast period, reaching a market value of USD 121.1 Billion by 2030. BPaaS leverages cloud technology to deliver business services, allowing organizations to optimize processes and reduce costs. The model supports scalability and flexibility, enabling businesses to pay only for the services they use. Key drivers include the increasing adoption of cloud-based services and the need for business process optimization, while concerns over data privacy and security pose challenges. The COVID-19 pandemic accelerated the shift to digital platforms, further boosting BPaaS adoption across various sectors.

    Key Market Trends & Highlights

    The BPaaS market is characterized by rapid technological advancements and increasing demand for cloud solutions.

    • Market size expected to reach USD 121.1 Billion by 2030.
    • CAGR of 16% during the forecast period.
    • North America projected to hold the largest market share due to high demand.
    • Asia-Pacific anticipated to be the fastest-growing region.

    Market Size & Forecast

    Market Size USD 121.1 Billion by 2030
    CAGR 16%
    Largest Regional Market Share North America
    Fastest Growing Region Asia-Pacific

    Major Players

    IBM Corporation (US), Wipro Limited (India), NTT DATA, Inc. (Japan), Swiss Post Solutions Limited (Switzerland), Entercoms (US), Conduent, Inc. (US), DXC Technology Company (US), Tech Mahindra Limited (India), Tata Consultancy Services Limited (India)

    Market Trends

    The Global Business Process as a Service Market is poised for substantial growth, driven by the increasing demand for operational efficiency and the adoption of cloud-based solutions across various industries.

    U.S. Department of Commerce

    Business Process as a Service Market Market Drivers

    Focus on Cost Efficiency

    Cost efficiency remains a pivotal driver in the Global Business Process as a Service Market Industry. Organizations are increasingly pressured to minimize expenses while maximizing output. By outsourcing business processes to service providers, companies can reduce overhead costs associated with maintaining in-house operations. This shift not only allows for better allocation of resources but also enables firms to focus on core competencies. The financial implications are substantial, as the market is projected to expand to 254.4 USD Billion by 2035, indicating a strong preference for cost-effective solutions that Business Process as a Service offers.

    Market Growth Projections

    The Global Business Process as a Service Market Industry is poised for substantial growth, with projections indicating a rise from 32.4 USD Billion in 2024 to 254.4 USD Billion by 2035. This trajectory suggests a compound annual growth rate of 20.61% from 2025 to 2035. Such growth is driven by various factors, including the increasing demand for automation, cost efficiency, and the integration of advanced technologies. The market's expansion reflects a broader trend towards outsourcing business processes, as organizations seek to enhance operational efficiency and focus on core competencies.

    Rising Demand for Automation

    The Global Business Process as a Service Market Industry experiences a notable surge in demand for automation solutions. Organizations are increasingly adopting automated processes to enhance efficiency and reduce operational costs. For instance, businesses are leveraging robotic process automation to streamline repetitive tasks, which can lead to significant time savings. This trend is reflected in the projected market growth, with the industry expected to reach 32.4 USD Billion in 2024. As companies seek to optimize their workflows, the adoption of Business Process as a Service is likely to accelerate, contributing to a robust compound annual growth rate of 20.61% from 2025 to 2035.

    Globalization of Business Operations

    The globalization of business operations significantly influences the Global Business Process as a Service Market Industry. As companies expand their reach across borders, they require scalable and flexible solutions to manage diverse operations effectively. Business Process as a Service enables organizations to standardize processes while accommodating local variations, thus facilitating smoother international operations. This adaptability is crucial for companies aiming to thrive in competitive global markets. The increasing need for such solutions is reflected in the market's projected growth, as it is expected to reach 32.4 USD Billion in 2024, highlighting the importance of globalization in driving demand for Business Process as a Service.

    Integration of Advanced Technologies

    The integration of advanced technologies such as artificial intelligence and machine learning is transforming the Global Business Process as a Service Market Industry. These technologies facilitate enhanced data analysis, predictive analytics, and decision-making processes, thereby improving overall service delivery. Companies that adopt these innovations can expect to see improved customer experiences and operational efficiencies. As the industry evolves, the incorporation of such technologies is likely to drive further growth, aligning with the anticipated market expansion to 254.4 USD Billion by 2035. This trend underscores the importance of technological advancement in shaping the future of business processes.

    Regulatory Compliance and Risk Management

    Regulatory compliance and risk management are critical drivers in the Global Business Process as a Service Market Industry. Organizations face increasing scrutiny from regulatory bodies, necessitating robust compliance frameworks. Business Process as a Service providers offer solutions that help companies navigate complex regulatory landscapes while minimizing risks associated with non-compliance. This is particularly relevant in industries such as finance and healthcare, where regulatory requirements are stringent. As businesses prioritize compliance, the demand for Business Process as a Service is expected to grow, contributing to the market's anticipated expansion to 254.4 USD Billion by 2035.

    Market Segment Insights

    Regional Insights

    Key Companies in the Business Process as a Service Market market include

    Industry Developments

    Future Outlook

    Business Process as a Service Market Future Outlook

    The Business Process as a Service Market is poised for robust growth at 20.61% CAGR from 2024 to 2035, driven by digital transformation, automation, and demand for operational efficiency.

    New opportunities lie in:

    • Leverage AI-driven analytics to enhance decision-making processes for clients.
    • Develop industry-specific solutions to cater to niche markets and improve customer satisfaction.
    • Invest in cybersecurity measures to ensure data protection and build client trust.

    By 2035, the Business Process as a Service Market is expected to achieve substantial growth, solidifying its role in global business operations.

    Market Segmentation

    Report Scope

    Report Attribute/Metric Details
      Market Size   USD 121.1 Billion
      CAGR   16%
      Base Year   2021
      Forecast Period   2022-2030
      Historical Data   2020
      Forecast Units   Value (USD Billion)
      Report Coverage   Revenue Forecast, Competitive Landscape, Growth Factors, and Trends
      Segments Covered   Type, Service
      Geographies Covered   North America, Europe, Asia-Pacific
      Key Vendors   IBM Corporation (US) Wipro Limited (India) NTT DATA Inc. (Japan) Swiss Post Solutions Limited (Switzerland) Entercoms (US) Avaloq (Switzerland) Conduent Inc. (US).
      Key Market Opportunities   Rapid advancements in technology
      Key Market Drivers   Increasing adoption of cloud-based services

    Market Highlights

    Author

    Ankit Gupta
    Senior Research Analyst

    She holds an experience of about 6+ years in market research and business consulting, working under the spectrum of information communication technology, telecommunications and semiconductor domains. aarti conceptualizes and implements a scalable business strategy and provides strategic leadership to the clients. her expertise lies in market estimation, competitive intelligence, pipeline analysis, customer assessment, etc.

    Leave a Comment

    Latest Comments

    John Doe
    john@example.com

    This is a great article! Really helped me understand the topic better.

    Posted on July 23, 2025, 10:15 AM
    Jane Smith
    jane@domain.com

    Thanks for sharing this. I’ve bookmarked it for later reference.

    Posted on July 22, 2025, 7:45 PM

    FAQs

    At what CAGR is the global business process as a service market predicted to grow during the forecast period?

    The global business process as a service market is predicted to grow at a 16% CAGR between 2022-2030.

    What will be the valuation of the global business process as a service market during the forecast period?

    The global business process as a service market will touch USD 121.1 Billion by 2030.

    Which region will lead the global business process as a service market?

    North America will lead the global business process as a service market.

    What are the key factors driving the global business process as a service market?

    Increasing adoption of cloud-based services and rapid advances in technology are the key factors driving the global business process as a service market growth.

    Who are the key contenders profiled in the global business process as a service market?

    Key contenders profiled in the global business process as a service market include BM Corporation, Wipro Limited, NTT DATA, Inc, Swiss Post Solutions Limited, Entercoms, Avaloq, Conduent, Inc, DXC Technology Company, Tech Mahindra Limited (India), Celegence LLC, Flatworld Solutions Pvt. Ltd., Tata Consultancy Services Limited and Business Connexion (Pty) Ltd.

    1. Table of Contents
    2. Executive Summary
      1. Market Attractiveness Analysis
        1. GlobalBusiness Process as A Service Market, by Process Type
        2. Global Business Process as A Service Market, byOrganization Size
        3. GlobalBusiness Process as A Service Market, by Vertical
        4. GlobalBusiness Process as A Service Market, by Region
    3. Market Introduction
      1. Definition
      2. Scope of the Study
      3. Market Structure
    4. Research Methodology
      1. Research Process
      2. Primary Research
      3. Secondary Research
      4. Market Size Estimation
      5. List of Assumptions
    5. MARKET DYNAMICS
      1. Introduction
      2. Drivers
        1. Increasing adoption of cloud-based services
        2. Need for business process optimization
        3. Access to skilled professionals
      3. Restraints
        1. Rising concern over data privacy and security
      4. Opportunities
        1. Rapid advancements in technology
      5. Challenges
        1. Lack of awareness
      6. Impact of COVID-19
        1. Impact on BPaaS providers
        2. Impact on IT industry
        3. Impact on end-use verticals
    6. MARKET FACTOR ANALYSIS
      1. Value Chain Analysis/Supply Chain Analysis
      2. Porter’s Five Forces Model
        1. Bargaining Power of Suppliers
        2. Bargaining Power of Buyers
        3. Threat of New Entrants
        4. Threat of Substitutes
        5. Intensity of Rivalry
    7. GLOBALBUSINESS PROCESS AS A SERVICE MARKET, BY PROCESS TYPE
      1. Introduction
      2. Human Resource Management
      3. Finance & Accounting
      4. Sales & Marketing
      5. Data & Analytics
      6. Customer Service & Support
      7. Procurement & Supply Chain Management
      8. Operations
      9. Others
    8. GLOBAL BUSINESS PROCESS AS A SERVICE MARKET, BYORGANIZATION SIZE
      1. Introduction
      2. Large Enterprise
      3. Small & Medium Enterprise
    9. GLOBALBUSINESS PROCESS AS A SERVICE MARKET, BY VERTICAL
      1. Introduction
      2. BFSI
      3. IT & Telecommunications
      4. Manufacturing
      5. Healthcare
      6. Retail
      7. Media & Entertainment
      8. Government
      9. Others
    10. GLOBALBUSINESS PROCESS AS A SERVICE MARKET, BY REGION
      1. Overview
      2. North America
        1. Market Size & Estimates, by Country, 2019–2027
        2. Market Size & Estimates, by Process Type, 2019–2027
        3. Market Size & Estimates, by Organization Size, 2019–2027
        4. Market Size & Estimates, by Vertical, 2019–2027
        5. US
        6. Canada
        7. Mexico
      3. Europe
        1. Market Size & Estimates, by Country, 2019–2027
        2. Market Size & Estimates, by Process Type, 2019–2027
        3. Market Size & Estimates, by Organization Size, 2019–2027
        4. Market Size & Estimates, by Vertical, 2019–2027
        5. Germany
        6. UK
        7. France
        8. Rest of Europe
      4. Asia-Pacific
        1. Market Size & Estimates, by Country, 2019–2027
        2. Market Size & Estimates, by Process Type, 2019–2027
        3. Market Size & Estimates, by Organization Size, 2019–2027
        4. Market Size & Estimates, by Vertical, 2019–2027
        5. China
        6. Japan
        7. India
        8. Rest of Asia-Pacific
      5. Middle East & Africa
        1. Market Size & Estimates, by Process Type, 2019–2027
        2. Market Size & Estimates, by Organization Size, 2019–2027
        3. Market Size & Estimates, by Vertical, 2019–2027
      6. South America
        1. Market Size & Estimates, by Process Type, 2019–2027
        2. Market Size & Estimates, by Organization Size, 2019–2027
        3. Market Size & Estimates, by Vertical, 2019–2027
    11. Competitive Landscape
      1. Introduction
      2. KeyPlayersMarket Share Analysis, 2020 (%)
      3. Competitive Benchmarking
      4. Competitor Dashboard
      5. Major Growth Strategy in the market
      6. Key Developments & Growth Strategies
        1. Product Developments
        2. Mergers & Acquisitions
        3. Contracts & Agreements
    12. COMPANY PROFILES
      1. Capgemini (France)
        1. Company Overview
        2. Financial Overview
        3. Products/Services/Solutions Offered
        4. Key Developments
        5. SWOT Analysis
        6. Key Strategies
      2. Cognizant (US)
        1. Company Overview
        2. Financial Overview
        3. Products/Services/Solutions Offered
        4. Key Developments
        5. SWOT Analysis
        6. Key Strategies
      3. IBM Corporation (US)
        1. Company Overview
        2. Financial Overview
        3. Products/Services/Solutions Offered
        4. Key Developments
        5. SWOT Analysis
        6. Key Strategies
      4. Wipro Limited (India)
        1. Company Overview
        2. Financial Overview
        3. Products/Services/Solutions Offered
        4. Key Developments
        5. SWOT Analysis
        6. Key Strategies
      5. NTT DATA, Inc. (Japan)
        1. Company Overview
        2. Financial Overview
        3. Products/Services/Solutions Offered
        4. Key Developments
        5. SWOT Analysis
        6. Key Strategies
      6. Swiss Post Solutions Limited (Switzerland)
        1. Company Overview
        2. Financial Overview
        3. Products/Services/Solutions Offered
        4. Key Developments
        5. SWOT Analysis
        6. Key Strategies
      7. Entercoms (US)
        1. Company Overview
        2. Financial Overview
        3. Products/Services/Solutions Offered
        4. Key Developments
        5. SWOT Analysis
        6. Key Strategies
      8. Avaloq (Switzerland)
        1. Company Overview
        2. Financial Overview
        3. Products/Services/Solutions Offered
        4. Key Developments
        5. SWOT Analysis
        6. Key Strategies
      9. Conduent, Inc. (US)
        1. Company Overview
        2. Financial Overview
        3. Products/Services/Solutions Offered
        4. Key Developments
        5. SWOT Analysis
        6. Key Strategies
      10. DXC Technology Company (US)
        1. Company Overview
        2. Financial Overview
        3. Products/Services/Solutions Offered
        4. Key Developments
        5. SWOT Analysis
        6. Key Strategies
      11. Tech Mahindra Limited (India)
        1. Company Overview
        2. Financial Overview
        3. Products/Services/Solutions Offered
        4. Key Developments
        5. SWOT Analysis
        6. Key Strategies
      12. Celegence LLC (US)
        1. Company Overview
        2. Financial Overview
        3. Products/Services/Solutions Offered
        4. Key Developments
        5. SWOT Analysis
        6. Key Strategies
      13. Flatworld Solutions Pvt. Ltd. (India)
        1. Company Overview
        2. Financial Overview
        3. Products/Services/Solutions Offered
        4. Key Developments
        5. SWOT Analysis
        6. Key Strategies
      14. Tata Consultancy Services Limited (India)
        1. Company Overview
        2. Financial Overview
        3. Products/Services/Solutions Offered
        4. Key Developments
        5. SWOT Analysis
        6. Key Strategies
      15. Business Connexion (Pty) Ltd. (South Africa)
        1. Company Overview
        2. Financial Overview
        3. Products/Services/Solutions Offered
        4. Key Developments
        5. SWOT Analysis
        6. Key Strategies
    13. List of Tables and Figures
      1. LIST OF TABLES
      2. TABLE 1 LIST OF ASSUMPTIONS
      3. TABLE 2 GLOBAL BUSINESS PROCESS AS A SERVICE MARKET, BY PROCESS TYPE, 2019–2027 (USD MILLION)
      4. TABLE 3 GLOBAL BUSINESS PROCESS AS A SERVICE MARKET, BY ORGANIZATION SIZE, 2019–2027 (USD MILLION)
      5. TABLE 4 GLOBAL BUSINESS PROCESS AS A SERVICE MARKET, BY VERTICAL, 2019–2027 (USD MILLION)
      6. TABLE 5 GLOBAL BUSINESS PROCESS AS A SERVICE MARKET, BY REGION, 2019–2027 (USD MILLION)
      7. TABLE 6 NORTH AMERICA: BUSINESS PROCESS AS A SERVICE MARKET, BY COUNTRY, 2019–2027 (USD MILLION)
      8. TABLE 7 NORTH AMERICA: BUSINESS PROCESS AS A SERVICE MARKET, BY PROCESS TYPE, 2019–2027 (USD MILLION)
      9. TABLE 8 NORTH AMERICA: BUSINESS PROCESS AS A SERVICE MARKET, BY ORGANIZATION SIZE, 2019–2027 (USD MILLION)
      10. TABLE 9 NORTH AMERICA: BUSINESS PROCESS AS A SERVICE MARKET, BY VERTICAL, 2019–2027 (USD MILLION)
      11. TABLE 10 US: BUSINESS PROCESS AS A SERVICE MARKET, BY PROCESS TYPE, 2019–2027 (USD MILLION)
      12. TABLE 11 US: BUSINESS PROCESS AS A SERVICE MARKET, BY ORGANIZATION SIZE, 2019–2027 (USD MILLION)
      13. TABLE 12 US: BUSINESS PROCESS AS A SERVICE MARKET, BY VERTICAL, 2019–2027 (USD MILLION)
      14. TABLE 13 CANADA: BUSINESS PROCESS AS A SERVICE MARKET, BY PROCESS TYPE, 2019–2027 (USD MILLION)
      15. TABLE 14 CANADA: BUSINESS PROCESS AS A SERVICE MARKET, BY ORGANIZATION SIZE, 2019–2027 (USD MILLION)
      16. TABLE 15 CANADA: BUSINESS PROCESS AS A SERVICE MARKET, BY VERTICAL, 2019–2027 (USD MILLION)
      17. TABLE 16 MEXICO: BUSINESS PROCESS AS A SERVICE MARKET, BY PROCESS TYPE, 2019–2027 (USD MILLION)
      18. TABLE 17 MEXICO: BUSINESS PROCESS AS A SERVICE MARKET, BY ORGANIZATION SIZE, 2019–2027 (USD MILLION)
      19. TABLE 18 MEXICO: BUSINESS PROCESS AS A SERVICE MARKET, BY VERTICAL, 2019–2027 (USD MILLION)
      20. TABLE 19 EUROPE: BUSINESS PROCESS AS A SERVICE MARKET, BY COUNTRY, 2019–2027 (USD MILLION)
      21. TABLE 20 EUROPE: BUSINESS PROCESS AS A SERVICE MARKET, BY PROCESS TYPE, 2019–2027 (USD MILLION)
      22. TABLE 21 EUROPE: BUSINESS PROCESS AS A SERVICE MARKET, BY ORGANIZATION SIZE, 2019–2027 (USD MILLION)
      23. TABLE 22 EUROPE: BUSINESS PROCESS AS A SERVICE MARKET, BY VERTICAL, 2019–2027 (USD MILLION)
      24. TABLE 23 UK: BUSINESS PROCESS AS A SERVICE MARKET, BY PROCESS TYPE, 2019–2027 (USD MILLION)
      25. TABLE 24 UK: BUSINESS PROCESS AS A SERVICE MARKET, BY ORGANIZATION SIZE, 2019–2027 (USD MILLION)
      26. TABLE 25 UK: BUSINESS PROCESS AS A SERVICE MARKET, BY VERTICAL, 2019–2027 (USD MILLION)
      27. TABLE 26 GERMANY: BUSINESS PROCESS AS A SERVICE MARKET, BY PROCESS TYPE, 2019–2027 (USD MILLION)
      28. TABLE 27 GERMANY: BUSINESS PROCESS AS A SERVICE MARKET, BY ORGANIZATION SIZE, 2019–2027 (USD MILLION)
      29. TABLE 28 GERMANY: BUSINESS PROCESS AS A SERVICE MARKET, BY VERTICAL, 2019–2027 (USD MILLION)
      30. TABLE 29 FRANCE: BUSINESS PROCESS AS A SERVICE MARKET, BY PROCESS TYPE, 2019–2027 (USD MILLION)
      31. TABLE 30 FRANCE: BUSINESS PROCESS AS A SERVICE MARKET, BY ORGANIZATION SIZE, 2019–2027 (USD MILLION)
      32. TABLE 31 FRANCE: BUSINESS PROCESS AS A SERVICE MARKET, BY VERTICAL, 2019–2027 (USD MILLION)
      33. TABLE 32 REST OF EUROPE: BUSINESS PROCESS AS A SERVICE MARKET, BY PROCESS TYPE, 2019–2027 (USD MILLION)
      34. TABLE 33 REST OF EUROPE: BUSINESS PROCESS AS A SERVICE MARKET, BY ORGANIZATION SIZE, 2019–2027 (USD MILLION)
      35. TABLE 34 REST OF EUROPE: BUSINESS PROCESS AS A SERVICE MARKET, BY VERTICAL, 2019–2027 (USD MILLION)
      36. TABLE 35 ASIA-PACIFIC: BUSINESS PROCESS AS A SERVICE MARKET, BY COUNTRY, 2019–2027 (USD MILLION)
      37. TABLE 36 ASIA-PACIFIC: BUSINESS PROCESS AS A SERVICE MARKET, BY PROCESS TYPE, 2019–2027 (USD MILLION)
      38. TABLE 37 ASIA-PACIFIC: BUSINESS PROCESS AS A SERVICE MARKET, BY ORGANIZATION SIZE, 2019–2027 (USD MILLION)
      39. TABLE 38 ASIA-PACIFIC: BUSINESS PROCESS AS A SERVICE MARKET, BY VERTICAL, 2019–2027 (USD MILLION)
      40. TABLE 39 CHINA: BUSINESS PROCESS AS A SERVICE MARKET, BY PROCESS TYPE, 2019–2027 (USD MILLION)
      41. TABLE 40 CHINA: BUSINESS PROCESS AS A SERVICE MARKET, BY ORGANIZATION SIZE, 2019–2027 (USD MILLION)
      42. TABLE 41 CHINA: BUSINESS PROCESS AS A SERVICE MARKET, BY VERTICAL, 2019–2027 (USD MILLION)
      43. TABLE 42 INDIA: BUSINESS PROCESS AS A SERVICE MARKET, BY PROCESS TYPE, 2019–2027 (USD MILLION)
      44. TABLE 43 INDIA: BUSINESS PROCESS AS A SERVICE MARKET, BY ORGANIZATION SIZE, 2019–2027 (USD MILLION)
      45. TABLE 44 INDIA: BUSINESS PROCESS AS A SERVICE MARKET, BY VERTICAL, 2019–2027 (USD MILLION)
      46. TABLE 45 JAPAN: BUSINESS PROCESS AS A SERVICE MARKET, BY PROCESS TYPE, 2019–2027 (USD MILLION)
      47. TABLE 46 JAPAN: BUSINESS PROCESS AS A SERVICE MARKET, BY ORGANIZATION SIZE, 2019–2027 (USD MILLION)
      48. TABLE 47 JAPAN: BUSINESS PROCESS AS A SERVICE MARKET, BY VERTICAL, 2019–2027 (USD MILLION)
      49. TABLE 48 REST OF ASIA-PACIFIC: BUSINESS PROCESS AS A SERVICE MARKET, BY PROCESS TYPE, 2019–2027 (USD MILLION)
      50. TABLE 49 REST OF ASIA-PACIFIC: BUSINESS PROCESS AS A SERVICE MARKET, BY ORGANIZATION SIZE, 2019–2027 (USD MILLION)
      51. TABLE 50 REST OF ASIA-PACIFIC: BUSINESS PROCESS AS A SERVICE MARKET, BY VERTICAL, 2019–2027 (USD MILLION)
      52. TABLE 51 MIDDLE EAST & AFRICA: BUSINESS PROCESS AS A SERVICE MARKET, BY PROCESS TYPE, 2019–2027 (USD MILLION)
      53. TABLE 52 MIDDLE EAST & AFRICA: BUSINESS PROCESS AS A SERVICE MARKET, BY ORGANIZATION SIZE, 2019–2027 (USD MILLION)
      54. TABLE 53 MIDDLE EAST & AFRICA: BUSINESS PROCESS AS A SERVICE MARKET, BY VERTICAL, 2019–2027 (USD MILLION)
      55. TABLE 54 SOUTH AMERICA: BUSINESS PROCESS AS A SERVICE MARKET, BY PROCESS TYPE, 2019–2027 (USD MILLION)
      56. TABLE 55 SOUTH AMERICA: BUSINESS PROCESS AS A SERVICE MARKET, BY ORGANIZATION SIZE, 2019–2027 (USD MILLION)
      57. TABLE 56 SOUTH AMERICA: BUSINESS PROCESS AS A SERVICE MARKET, BY VERTICAL, 2019–2027 (USD MILLION)     LIST OF FIGURES
      58. FIGURE 1 MARKET SYNOPSIS
      59. FIGURE 2 RESEARCH PROCESS OF MRFR
      60. FIGURE 3 TOP-DOWN & Bottom-up Approach
      61. FIGURE 4 GLOBAL BUSINESS PROCESS AS A SERVICE MARKET, BY PROCESS TYPE, 2019–2027 (USD MILLION)
      62. FIGURE 5 GLOBAL BUSINESS PROCESS AS A SERVICE MARKET, BY ORGANIZATION SIZE, 2019–2027 (USD MILLION)
      63. FIGURE 6 GLOBAL BUSINESS PROCESS AS A SERVICE MARKET, BY VERTICAL, 2019–2027 (USD MILLION)
      64. FIGURE 7 GLOBAL BUSINESS PROCESS AS A SERVICE MARKET, BY REGION, 2019-2027 (USD MILLION)
      65. FIGURE 8 NORTH AMERICA: BUSINESS PROCESS AS A SERVICE MARKET, BY COUNTRY, 2019–2027 (USD MILLION)
      66. FIGURE 9 NORTH AMERICA: BUSINESS PROCESS AS A SERVICE MARKET, BY PROCESS TYPE, 2019–2027 (USD MILLION)
      67. FIGURE 10 NORTH AMERICA: BUSINESS PROCESS AS A SERVICE MARKET, BY ORGANIZATION SIZE, 2019–2027 (USD MILLION)
      68. FIGURE 11 NORTH AMERICA: BUSINESS PROCESS AS A SERVICE MARKET, BY VERTICAL, 2019–2027 (USD MILLION)
      69. FIGURE 12 EUROPE: BUSINESS PROCESS AS A SERVICE MARKET, BY COUNTRY, 2019–2027 (USD MILLION)
      70. FIGURE 13 EUROPE: BUSINESS PROCESS AS A SERVICE MARKET, BY PROCESS TYPE, 2019–2027 (USD MILLION)
      71. FIGURE 14 EUROPE: BUSINESS PROCESS AS A SERVICE MARKET, BY ORGANIZATION SIZE, 2019–2027 (USD MILLION)
      72. FIGURE 15 EUROPE: BUSINESS PROCESS AS A SERVICE MARKET, BY VERTICAL, 2019–2027 (USD MILLION)
      73. FIGURE 16 ASIA-PACIFIC: BUSINESS PROCESS AS A SERVICE MARKET, BY COUNTRY, 2019–2027 (USD MILLION)
      74. FIGURE 17 ASIA-PACIFIC: BUSINESS PROCESS AS A SERVICE MARKET, BY PROCESS TYPE, 2019–2027 (USD MILLION)
      75. FIGURE 18 ASIA-PACIFIC: BUSINESS PROCESS AS A SERVICE MARKET, BY ORGANIZATION SIZE, 2019–2027 (USD MILLION)
      76. FIGURE 19 ASIA-PACIFIC: BUSINESS PROCESS AS A SERVICE MARKET, BY VERTICAL, 2019–2027 (USD MILLION)
      77. FIGURE 20 MIDDLE EAST & AFRICA: BUSINESS PROCESS AS A SERVICE MARKET, BY PROCESS TYPE, 2019–2027 (USD MILLION)
      78. FIGURE 21 MIDDLE EAST & AFRICA: BUSINESS PROCESS AS A SERVICE MARKET, BY ORGANIZATION SIZE, 2019–2027 (USD MILLION)
      79. FIGURE 22 MIDDLE EAST & AFRICA: BUSINESS PROCESS AS A SERVICE MARKET, BY VERTICAL, 2019–2027 (USD MILLION)
      80. FIGURE 23 SOUTH AMERICA: BUSINESS PROCESS AS A SERVICE MARKET, BY PROCESS TYPE, 2019–2027 (USD MILLION)
      81. FIGURE 24 SOUTH AMERICA: BUSINESS PROCESS AS A SERVICE MARKET, BY ORGANIZATION SIZE, 2019–2027 (USD MILLION)
      82. FIGURE 25 SOUTH AMERICA: BUSINESS PROCESS AS A SERVICE MARKET, BY VERTICAL, 2019–2027 (USD MILLION)

    Business Process as a Service Market Segmentation

    Market Segmentation Overview

    • Detailed segmentation data will be available in the full report
    • Comprehensive analysis by multiple parameters
    • Regional and country-level breakdowns
    • Market size forecasts by segment
    Infographic

    Free Sample Request

    Kindly complete the form below to receive a free sample of this Report

    Get Free Sample

    Customer Strories

    “I am very pleased with how market segments have been defined in a relevant way for my purposes (such as "Portable Freezers & refrigerators" and "last-mile"). In general the report is well structured. Thanks very much for your efforts.”

    Victoria Milne

    Founder
    Case Study
    Chemicals and Materials