• Cat-intel
  • MedIntelliX
  • Resources
  • About Us
  • English
    Chinese
    French
    Japanese
    Korean
    German
    Spanish

    Augmented Virtual Reality Hardware Market Analysis

    ID: MRFR/ICT/9481-CR
    110 Pages
    Aarti Dhapte
    April 2023

    AR/VR Hardware Market Research Report Information By Hardware Type (Sensors, Processors, Controllers, Cameras, Headphones, Display Monitors, and Others), By Application (Head Mounted Display, Head Up Display, and Handheld Devices), By Industry Vertical (Aerospace & Defense, Gaming & Entertainment, Education & Training, Healthcare, Automotive, and Others), and By Region (North Americ...

    Share:
    Download PDF ×

    We do not share your information with anyone. However, we may send you emails based on your report interest from time to time. You may contact us at any time to opt-out.

    ReportInfographic
    $ 4,950.0
    $ 5,950.0
    $ 7,250.0

    Market Analysis

    In-depth Analysis of Augmented Virtual Reality Hardware Market Industry Landscape

    The market factors responsible for the development and advancement of AR/VR hardware include a few elements. AR/VR hardware includes devices like head-mounted displays, glasses as well as controllers that allow users to engage in immersive virtual environments. The AR/VR hardware market is in growth due to increasing user preference for vivid experiences of gaming, recreation and enterprise applications, continuous innovation & technology improvements as well as rapid adoption and investment by users across the industries. A key factor driving the market for AR/VR hardware is increased demand for immersive experiences in gaming and amusement. Since the shoppers want more interactive and engaging types of entertainment, AR/VR hardware solutions are a strong alternative as they provide realistic gaming experience with virtual storytelling capabilities along with different options for fun in case dealing games. This desire for lively experiences fuels the trend of AR/VR devices among gamers, producers and entertainment companies contributing to market growth. As well, the continuous developments in technology and hardware performance capabilities play a key role on shaping characteristics of AR/VR device market. Continuous improvements in display technologies, optics, sensors and data devices facilitate the development of more vivid realistic impersonal reality AR/VR equipment. These advances contribute to the augmentation of an end-user experience, reduction in latency and motion sicknesses and AR / VR application development across gaming education , training health care etc. The market’s attractiveness and intensiveness are based on the progress of hardware capacities for an increasing client base. Furthermore, the growing disposition and spread of AR/VR throughout businesses also contribute to the growth in demand for hardware technology. Companies, projects and societies are increasingly using AR/VR technologies for training, entertainment industry product design virtual collaboration client satisfaction. The broad adoption of AR/VR solutions have quickly gained traction in various industry segments drives the demand for high-quality, reliable hardware for deliver vivid and impactful experience which contributes to market development as well liquefied. However, the AR/VR hardware market also has its own unique challenges and demands that affect its characteristics. The distinguished challenges faced by the market include cost consciousness of buyers and organizations, issues associated with client comfort and ergonomics, as well as need for compelling content purchasing price. In addition, interoperability and standardization issues and the need for seamless integration with other technologies pose technical and functional challenges.

    Market Summary

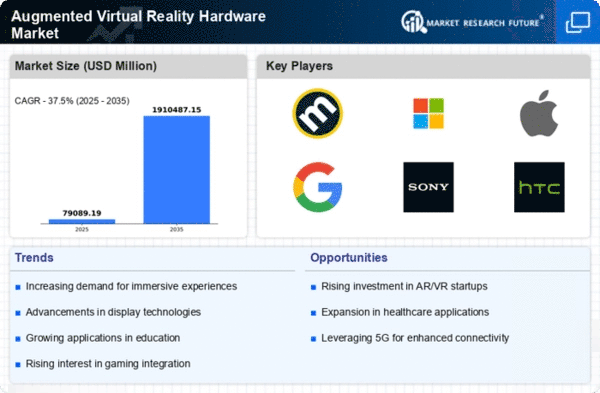
    As per Market Research Future Analysis, the AR/VR Hardware Market was valued at USD 29,984.6 million in 2022 and is projected to grow from USD 41,832.3 million in 2023 to USD 389,066.4 million by 2030, with a CAGR of 37.5% during the forecast period. The growth is driven by high demand across various industries including gaming, entertainment, aerospace, and healthcare. The COVID-19 pandemic has disrupted supply chains, particularly in China, leading to a decline in production capacity and component shipments. Despite these challenges, the market is witnessing opportunities through the increasing use of smartphones and tablets for AR/VR applications, enhanced by 5G technology and WebVR. The sensor segment is expected to maintain its dominance in hardware types, while the gaming and entertainment sector leads in industry verticals.

    Key Market Trends & Highlights

    Key trends influencing the AR/VR Hardware Market include technological advancements and industry adoption.

    • AR/VR Hardware Market Size in 2022: USD 29,984.6 million.
    • Projected Market Size by 2030: USD 389,066.4 million.
    • CAGR during 2023-2030: 37.5%.
    • Asia Pacific held 40.9% market share in 2022.

    Market Size & Forecast

    2022 Market Size USD 29,984.6 million
    2023 Market Size USD 41,832.3 million
    2030 Market Size USD 389,066.4 million
    CAGR (2023-2030) 37.5%.

    Major Players

    Major players include Oculus VR (Meta), Google LLC, HTC Corporation, Samsung Electronics, Sony Corporation, and NXP Semiconductor.

    Market Trends

    Augmented Virtual Reality Hardware Market Market Drivers

    Market Segment Insights

    AR/VR Hardware Type Insights

    Based on Hardware Type, the AR/VR Hardware Market is segmented into Sensors, Processors, Controllers, Cameras, Headphones, Display Monitors, and Others. The sensor segment captured the biggest market share by solution in 2022 and is likely to maintain its dominance in the future years. Sensors are extensively used in the augmented reality and virtual reality hardware market, the sensors support the AR/VR system and are majorly focused on audio and video interface, motion tracking, and voice recognition. Modern-day AR/VR headsets rely on one or more types of sensors utilizing vertical-cavity surface structured-light sensors and a Lidar detection system for depth sensing.

    Processors provide AR/VR devices with the instruction and processing power they need to perform the task. For instance, processing the video into AR/VR format while utilizing a combination of GPU processors, display processors, and machine learning.

    October 2021 Bosch Sesortec GmbH launched new sensors that have reduced time lag which is very essential during head movements, time lag can be a factor in motion sickness while using AR/VR devices. The company states its new sensors have high stability and low latency enabling the sensors to be used in a wide range of applications including VR gaming.

    March 2018 Bosch Sensortec GmbH launched BM1085 motion sensor chips for AR/VR application, navigation, body motion, tracking, and gaming. The sensor is filled with features, combining a low-drift gyroscope with a low-noise accelerometer to significantly reduce the unpleasant motion sickness effect.

    AR/VR HARDWARE MARKET SIZE (USD MILLION) by hardware type (2018-2030)AR VR HARDWARE MARKET SIZE (USD MILLION) by hardware type (2018-2030)

    Source: Secondary Research, Primary Research, Market Research Future Database, and Analyst Review

    AR/VR Hardware Enterprise Size Insights

    Based on Application, the AR/VR Hardware Market is segmented into Head Mounted Display, Head Up Display, and Handheld Devices. The Head Mounted Display segment captured the biggest market share by solution in 2021 and is likely to maintain its dominance in the future years.

    Head-mounted displays are display headsets that are worn on the head, head-mounted displays are equipped with display optics that are placed exactly in front of each eye, these head-mounted displays are combined with inertial measurement units, enabling users to see projected scenes. Head-mounted displays are used in a wide range of applications including aviation, engineering, medicine, and gaming.

    AR/VR Hardware Industry Vertical Insights

    Based on Industry Vertical, the AR/VR Hardware Market is segmented into Aerospace & Defense, Gaming & Entertainment, Education & Training, Healthcare, Automotive, and Others. The Gaming & Entertainment segment captured the biggest market share by solution in 2021 and is likely to maintain its dominance in the future years.

    There is a rapid rise in the adoption of augmented and virtual reality in the gaming and entertainment industry, augmented and virtual reality allows the users to experience digital games and movies in a real-world environment. With the rapid advancement in AR/VR technology, the demand is increasing in this vertical.

    Virtual reality gaming combines augmented reality gaming and virtual reality gaming. Augmented reality gaming is a combination of audio and visual content in real-time. Virtual reality gaming is a 3D application for creating virtual artificial environment in computer games. AR games are mostly played on smartphones, tablets, and portable gaming systems. Augmented reality gaming uses the existing environment and generates a gaming field within itself. VR gaming control may involve keyboard and mouse, game controllers or motion capture methods. Mixed reality games are mostly played on head-mounted displays.

    Acer’s mixed reality headset, Microsoft HoloLens, Samsung Odyssey, Lenovo Explorer, and Dell Visor are some examples of devices on which users can play reality video games.

    AR/VR HARDWARE MARKET SIZE (USD MILLION) by industry vertical (2018-2030)AR VR HARDWARE MARKET SIZE (USD MILLION) by industry vertical (2018-2030)

    Source: Secondary Research, Primary Research, Market Research Future Database, and Analyst Review

    Regional Insights

    By Region, the study segments the market into North America, Europe, Asia-Pacific, Middle East & Africa, and South America. Asia Pacific dominated the AR/VR Hardware Market with a share of 40.9% of the total market in 2022. Growing spending on augmented reality and virtual reality (AR/VR) technologies coupled with rise in penetration of the wireless-first strategy amongst enterprises, industries, and public sector organizations drives the AR/VR market in the Asia-Pacific region. Vendors will advance VR headsets, AR for smart glasses and phones, and disrupt augmented audio technologies, providing the consumer market with excellent growth prospects.

    The demand from businesses for a new immersive experience in how they conduct business and connect with customers and workers is what's fueling the phenomenal market growth for AR/VR technologies. Vendors must, however, respond to consumer AR/VR applications as well if they want to take advantage of opportunities with rapid growth over the coming few years. The highest expenditure sectors over the projection period will be professional services, discrete manufacturing, healthcare, education, and healthcare.

    The North American market for augmented reality and virtual reality hardware is divided into countries namely US and Canada. Growing development in AR and VR technologies coupled with large number of AR and VR technologies players in North America is expected o garner high CAGR during the forecast period.

    For instance, In order to give students access to learning options in the metaverse, several educational institutions plan to launch digital twin campuses, according to VictoryXR, a provider of augmented and virtual reality (AR/VR) content for schools and educational institutions, which has announced the launch of ten "Metaversities" in the US this fall. Growing adoption of immersive technologies in this region owing to its benefits is a major factor expected to drive the growth of the market. 

    Moreover, on-going demand of immersive technologies especially integrate hardware devices in healthcare industry is further expected to garner significant revenue in the coming 10 years. For instance, May 25, 2022, LONDON At a special event for the XR community, ARuVR, the virtual and augmented reality learning company, will announce a partnership with a prominent XR and EdTech supporter to revolutionize medical education. Professor Manish Chand, of the UCL Hospital NHS Foundation Trust, will test out ARuVR's technology to instruct medical students as part of the agreement.

    The invitation-only event will be held at the grade II-listed BT Tower, which is home to BT, which joins Coca-Cola, Rio Tinto, PwC, and NEOM on the long list of international clients for ARuVR.

    Further, the countries considered in the scope of the AR/VR Hardware market are the US, Canada, Mexico, UK, Germany, France, Italy, Spain, Switzerland, Austria, Belgium, Denmark, Finland, Greece, Hungary, Italy, Luxembourg, Netherlands, Norway, Poland, Portugal, Slovakia, Sweden, Romania, Ireland, China, Japan, Singapore, Malaysia, Indonesia, Philippines, South Korea, Hong Kong, Macau, Singapore, Brunei, India, Australia & New Zealand, South Africa, Egypt, Nigeria, Saudi Arabia, Qatar, United Arab Emirates, Bahrain, Kuwait, and Oman, Brazil, Argentina, Chile, and others.

    AR/VR HARDWARE MARKET SIZE (USD MILLION) by region (2018-2030)AR VR HARDWARE MARKET SIZE (USD MILLION) BY REGION (2018-2030)

    Source: Secondary Research, Primary Research, Market Research Future Database, and Analyst Review

    Key Players and Competitive Insights

    Major market players are spending a lot of money on R&D to increase their product lines, which will help the AR/VR Hardware market grow even more. Market participants are also taking a range of strategic initiatives to grow their worldwide footprint, including new product launches, contractual agreements, mergers and acquisitions, increased investments, and collaboration with other organizations. Competitors in the AR/VR Hardware industry must offer cost-effective services and solutions to expand and survive in an increasingly competitive and rising market environment.

    Various AR/VR Hardwares market leaders are introducing new technologies for various industries in order to improve security and eliminate communication gaps between employees and businesses. Oculus VR launched Rift S headset with additional features such as hand gesture controls, the company launched the new VR headset for a price of USD 399, the new VR headset is primarily designed for gaming. NXP Semiconductors is developing accessories and hardware for the gaming markets including AR/VR headsets and wireless gamepads to keep up with the rising market demand and market innovation.

    Industry Developments

    October 2020 Samsung partnered with Stanford University for the development of an AR/VR display that is capable of packing more than 10,000 pixels per inch for use in VR/AR headsets and future contact lenses. The major aim of this partnership is to reduce the perception of the dreaded “screen door effect” in VR displays.

    May 2021 HTC Corporation partnered with Agora a VR company, the partnership aims to develop future VR technologies and experiences, and the partnership will bring HTCs hardware expertise and Agora software expertise for future development in VR technologies.

    Intended Audience

      • Sensor Industry

      • Semiconductor Industry

      • Factories And Manufacturing Facilities

      • Technology Investors

      • Regulatory Industries

      • Government Bodies

      • Augmented and Virtual Reality Industries

    Market Segmentation

    AR/VR Hardware Type Outlook

    • Sensors
    • Processors
    • Controllers
    • Cameras
    • Headphones
    • Display Monitors
    • Others

    AR/VR Hardware Regional Outlook

    North America
    • US
    • Canada
    • Mexico

    AR/VR Hardware Application Outlook

    • Head Mounted Display
    • Head Up Display
    • Handheld Devices

    AR/VR Hardware Industry Vertical Outlook

    • Aerospace & Defense
    • Gaming & Entertainment
    • Education & Training
    • Healthcare
    • Automotive
    • Others

    Report Scope

    Report Attribute/Metric Details
    Market Size 2022 USD 29,984.6 million
    Market Size 2023 USD 41,832.3 million
    Market Size 2030 USD 389,066.4 million
    Compound Annual Growth Rate (CAGR) 37.5% (2023-2030)
    Base Year 2022
    Forecast Period 2023-2030
    Historical Data 2018-2021
    Forecast Units Value (USD Million)
    Report Coverage Revenue Forecast, Competitive Landscape, Growth Factors, and Trends
    Segments Covered Hardware Type, Application, Industry Vertical, and Region
    Geographies Covered North America, Europe, Asia Pacific, Middle East & Africa, and South America
    Countries Covered The US, Canada, Mexico, UK, Germany, France, Italy, Spain, Switzerland, Austria, Belgium, Denmark, Finland, Greece, Hungary, Italy, Luxembourg, Netherlands, Norway, Poland, Portugal, Slovakia, Sweden, Romania, Ireland, China, Japan, Singapore, Malaysia, Indonesia, Philippines, South Korea, Hong Kong, Macau, Singapore, Brunei, India, Australia & New Zealand, South Africa, Egypt, Nigeria, Saudi Arabia, Qatar, United Arab Emirates, Bahrain, Kuwait, and Oman, Brazil, Argentina, and Chile
    Key Companies Profiled Oculus VR (Meta), Google LLC, HTC Corporation, Samsung Electronics, Sony Corporation, Worldviz, NXP Semiconductor N.V, Bosch Sensortec GMBH (Bosch Group), Inertial Labs, Valve Corporation, TCL Technologyc, DPVR, Vuzix, Qualcomm Technologies Inc., Sieko Epson Corporation, Penumbra, Inc., Arm Limited, Leke VR, and others
    Key Market Opportunities Growing use of smartphones and tablets for AR & VR
    Key Market Driver Consumer and commercial rising interest Evolution of silicon technologies

    Market Highlights

    Author

    Aarti Dhapte
    Team Lead - Research

    She holds an experience of about 6+ years in market research and business consulting, working under the spectrum of information communication technology, telecommunications and semiconductor domains. aarti conceptualizes and implements a scalable business strategy and provides strategic leadership to the clients. her expertise lies in market estimation, competitive intelligence, pipeline analysis, customer assessment, etc.

    Leave a Comment

    Latest Comments

    John Doe

    This is a great article! Really helped me understand the topic better.

    Posted on July 23, 2025, 10:15 AM
    Jane Smith

    Thanks for sharing this. I’ve bookmarked it for later reference.

    Posted on July 22, 2025, 7:45 PM

    FAQs

    How much is the AR/VR Hardware market?

    USD 29,984.6 Million in 2022

    What is the market size for 2030, for the AR/VR Hardware Market?

    USD 389,066.4 Million in 2030

    What is the growth rate of the AR/VR Hardware market?

    37.5%

    Which region held the largest market share in the AR/VR Hardware market?

    Asia-Pacific

    Who are the prominent players in the AR/VR Hardware market?

    Oculus VR (Meta), Google LLC, HTC Corporation, Samsung Electronics, Sony Corporation, Worldviz, NXP Semiconductor N.V, Bosch Sensortec GMBH (Bosch Group), Inertial Labs, Valve Corporation, TCL Technologyc, DPVR, Vuzix, Qualcomm Technologies Inc., Sieko Epson Corporation, Penumbra, Inc., Arm Limited, Leke VR, and others.

    1. Table of Contents
    2. Executive Summary 19
      1. MARKET ATTRACTIVENESS
    3. ANALYSIS 20
    4. Market Introduction 21
      1. Definition 21
      2. Scope of the Study 21
      3. Research Objective 21
      4. Market Structure 22
    5. 3
    6. Research Methodology 23
    7. Market Dynamics 30
      1. INTRODUCTION 30
    8. drivers 31
      1. Consumer and Commercial Rising Interest 31
        1. Evolution
    9. of Silicon Technologies 31
      1. DRIVERS IMPACT ANALYSIS 32
      2. restraints
    10. 32
      1. Limited Processing Power, Storage and Memory in Mobile Phones 32
      2. Opportunities 33
        1. Growing Use of Smartphones and Tablets for AR&
    11. VR 33
      1. Rising Usage of VR Beyond Gaming 33
      2. Impact Analysis of
    12. COVID-19 34
      1. Impact on Semiconductor Manufacturers 34
        1. Impact
    13. on ComponentManufacturers 34
      1. Impact on Device Manufacturers 35
    14. COVID-19 Impact on Supply Chain 35
    15. MARKET FACTOR ANALYSIS 36
      1. Supply
    16. Chain Analysis 36
      1. hardware/components manufacturers 36
        1. Technology
    17. Integrators 36
      1. End-Users 37
      2. Porter’s Five Forces Model
    18. 37
      1. Threat of New Entrants 38
        1. Bargaining Power of Suppliers
    19. 38
      1. Threat of Substitutes 38
        1. Bargaining Power of Buyers 38
        2. Intensity of Rivalry 38
    20. GLOBAL Augmented Reality and Virtual Reality
    21. Hardware MARKET,
    22. BY Hardware Type 39
      1. OVERVIEW 39
        1. Global
    23. Augmented Reality and Virtual Reality Hardware market, BY Hardware Type,
    24. 2018–2030
    25. (USD MILLION) 40
      1. Sensors 40
      2. Processors 40
      3. Controllers
    26. 40
      1. Cameras 40
      2. Headphones 41
      3. Display Monitors 41
    27. Others 41
    28. GLOBAL Augmented Reality and Virtual Reality Hardware MARKET,
    29. BY Application 42
      1. OVERVIEW 42
        1. Global Augmented Reality and
    30. Virtual Reality Hardware market, BY Application,
    31. 2018–2030 (USD MILLION)
    32. 43
      1. Head Mounted Display 43
      2. Head Up Display 43
      3. Handheld
    33. Devices 43
    34. GLOBAL Augmented Reality and Virtual Reality Hardware MARKET,
    35. BY Industry Vertical 44
      1. OVERVIEW 44
        1. Global Augmented Reality
    36. and Virtual Reality Hardware market, BY Industry Vertical,
    37. (USD MILLION) 45
      1. Aerospace & Defense 45
      2. Gaming & Entertainment
    38. 45
      1. Education & Training 46
      2. Healthcare 46
      3. Automotive
    39. 46
      1. Others 46
    40. Global Augmented Reality and Virtual Reality Hardware
    41. MARKET,
    42. BY Region 47
      1. OVERVIEW 47
        1. Global Augmented Reality
    43. and Virtual Reality Hardware market, by Region, 2021 VS 2030
    44. (USD MILLION)
    45. 48
      1. Global Augmented Reality and Virtual Reality Hardware market, BY Region,
    46. (USD MILLION) 48
      1. North america 49
        1. North
    47. america: Augmented Reality and Virtual Reality Hardware market, BY Country,
    48. 2018–2030 (USD MILLION) 50
      1. North America Augmented Reality and
    49. Virtual Reality Hardware market, BY Hardware Type,
    50. 51
      1. North America AUGMENTED REALITY AND VIRTUAL REALITY HARDWARE market,
    51. BY Application,
    52. 2018–2030 (USD MILLION) 52
      1. North America
    53. AUGMENTED REALITY AND VIRTUAL REALITY HARDWARE market, BY Industry
    54. Vertical,
    55. 2018–2030 (USD MILLION) 53
      1. US 54
        1. US AUGMENTED REALITY
    56. AND VIRTUAL REALITY HARDWARE market, BY Hardware Type,
    57. 2018–2030 (USD
    58. MILLION) 54
      1. US AUGMENTED REALITY AND VIRTUAL REALITY HARDWARE market,
    59. BY Application, 2018–2030
    60. (USD MILLION) 54
      1. US AUGMENTED
    61. REALITY AND VIRTUAL REALITY HARDWARE market, BY Industry Vertical,
    62. (USD MILLION) 55
      1. CANADA 55
        1. CANADA AUGMENTED REALITY AND
    63. 55
      1. CANADA AUGMENTED REALITY AND VIRTUAL REALITY HARDWARE market, BY
    64. Application,
    65. 2018–2030 (USD MILLION) 56
      1. CANADA AUGMENTED
    66. (USD MILLION) 56
      1. Europe 57
        1. Europe: Augmented Reality and Virtual
    67. Reality Hardware market, BY Country, 2018–2030
    68. (USD MILLION) 58
    69. Europe Augmented Reality and Virtual Reality Hardware market, BY Hardware Type,
    70. 2018–2030 (USD MILLION) 59
      1. Europe AUGMENTED REALITY AND VIRTUAL
    71. REALITY HARDWARE market, BY Application, 2018–2030
    72. (USD MILLION) 60
      1. Europe AUGMENTED REALITY AND VIRTUAL REALITY HARDWARE market, BY Industry
    73. 2018–2030 (USD MILLION) 61
      1. UK 62
        1. UK
    74. AUGMENTED REALITY AND VIRTUAL REALITY HARDWARE market, BY Hardware Type, 2018–2030
    75. (USD MILLION) 62
      1. UK AUGMENTED REALITY AND VIRTUAL REALITY HARDWARE
    76. market, BY Application, 2018–2030
      1. UK AUGMENTED
    77. (USD MILLION) 63
      1. GERMANY 63
        1. GERMANY AUGMENTED REALITY AND
    78. 63
      1. GERMANY AUGMENTED REALITY AND VIRTUAL REALITY HARDWARE market, BY
    79. 2018–2030 (USD MILLION) 64
      1. GERMANY AUGMENTED
    80. (USD MILLION) 64
      1. FRANCE 65
        1. FRANCE AUGMENTED REALITY AND
    81. 65
      1. FRANCE AUGMENTED REALITY AND VIRTUAL REALITY HARDWARE market, BY
    82. 2018–2030 (USD MILLION) 65
      1. FRANCE AUGMENTED
    83. (USD MILLION) 66
      1. ITALY 66
        1. ITALY AUGMENTED REALITY AND VIRTUAL
    84. REALITY HARDWARE market, BY Hardware Type,
    85. 2018–2030 (USD MILLION) 66
      1. ITALY AUGMENTED REALITY AND VIRTUAL REALITY HARDWARE market, BY Application,
    86. 2018–2030 (USD MILLION) 67
      1. ITALY AUGMENTED REALITY AND
    87. VIRTUAL REALITY HARDWARE market, BY Industry Vertical,
    88. MILLION) 67
      1. REST OF EUROPE 68
        1. REST OF EUROPE AUGMENTED REALITY
    89. AND VIRTUAL REALITY HARDWARE market, BY Hardware
    90. Type, 2018–2030 (USD
    91. MILLION) 68
      1. REST OF EUROPE AUGMENTED REALITY AND VIRTUAL REALITY HARDWARE
    92. BY Application, 2018–2030 (USD MILLION) 68
      1. REST
    93. OF EUROPE AUGMENTED REALITY AND VIRTUAL REALITY HARDWARE market, BY Industry
    94. Vertical, 2018–2030 (USD MILLION) 69
      1. Asia-Pacific 70
    95. Asia-Pacific: Augmented Reality and Virtual Reality Hardware market, BY Country,
    96. 2018–2030 (USD MILLION) 71
      1. Asia-Pacific Augmented Reality
    97. MILLION) 72
      1. Asia-Pacific AUGMENTED REALITY AND VIRTUAL REALITY HARDWARE
    98. market, BY Application,
    99. 2018–2030 (USD MILLION) 73
      1. Asia-Pacific
    100. AUGMENTED REALITY AND VIRTUAL REALITY HARDWARE market, BY Industry Vertical,
    101. 2018–2030 (USD MILLION) 74
      1. CHINA 75
        1. CHINA AUGMENTED
    102. REALITY AND VIRTUAL REALITY HARDWARE market, BY Hardware Type,
    103. (USD MILLION) 75
      1. CHINA AUGMENTED REALITY AND VIRTUAL REALITY HARDWARE
    104. 2018–2030 (USD MILLION) 75
      1. CHINA
    105. 2018–2030 (USD MILLION) 76
      1. JAPAN 76
        1. JAPAN AUGMENTED
    106. (USD MILLION) 76
      1. JAPAN AUGMENTED REALITY AND VIRTUAL REALITY HARDWARE
    107. 2018–2030 (USD MILLION) 77
      1. JAPAN
        1. INDIA 78
    108. (USD MILLION) 78
      1. INDIA AUGMENTED REALITY AND VIRTUAL REALITY HARDWARE
        1. INDIA
    109. 2018–2030 (USD MILLION) 79
      1. SOUTH KOREA 79
        1. SOUTH
    110. KOREA AUGMENTED REALITY AND VIRTUAL REALITY HARDWARE market, BY Hardware
    111. Type,
      1. SOUTH KOREA AUGMENTED REALITY AND
    112. 80
      1. SOUTH KOREA AUGMENTED REALITY AND VIRTUAL REALITY HARDWARE market,
    113. BY Industry
    114. Vertical, 2018–2030 (USD MILLION) 80
      1. REST OF
    115. ASIA-PACIFIC 81
      1. REST OF ASIA-PACIFIC AUGMENTED REALITY AND VIRTUAL
    116. REALITY HARDWARE market,
    117. BY Hardware Type, 2018–2030 (USD MILLION) 81
      1. REST OF ASIA-PACIFIC AUGMENTED REALITY AND VIRTUAL REALITY HARDWARE market,
    118. BY Application, 2018–2030 (USD MILLION) 81
      1. REST OF ASIA-PACIFIC
    119. AUGMENTED REALITY AND VIRTUAL REALITY HARDWARE market,
    120. BY Industry Vertical,
    121. 2018–2030 (USD MILLION) 82
      1. Middle East & Africa 82
    122. Middle East & AfricaAugmented Reality and Virtual Reality Hardware market,
    123. BY Hardware Type, 2018–2030 (USD MILLION) 83
      1. Middle East &
    124. AfricaAUGMENTED REALITY AND VIRTUAL REALITY HARDWARE market,
    125. 2018–2030 (USD MILLION) 84
      1. Middle East & AfricaAUGMENTED REALITY
    126. AND VIRTUAL REALITY HARDWARE market,
    127. BY Industry Vertical, 2018–2030
    128. (USD MILLION) 85
      1. Latin America 86
        1. Latin AmericaAugmented Reality
    129. MILLION) 87
      1. Latin AmericaAUGMENTED REALITY AND VIRTUAL REALITY HARDWARE
    130. 2018–2030 (USD MILLION) 88
      1. Latin
    131. AmericaAUGMENTED REALITY AND VIRTUAL REALITY HARDWARE market, BY Industry
    132. 2018–2030 (USD MILLION) 89
    133. Competitive Landscape 90
      1. Competitive
    134. benchmarking 91
      1. Vendor share analysis 92
      2. recent developments
    135. 92
      1. Partnerships/Agreements/contracts/Collaborations 92
        1. Business
    136. Expansions/AcquisItions 93
      1. Product Launches/developments 93
    137. 11
    138. Company Profiles 95
      1. oculus vr (meta) 95
        1. COMPANY OVERVIEW 95
        2. FINANCIAL OVERVIEW 96
        3. Products/Solutions/Services OFFERed 96
        4. KEY DEVELOPMENTS 97
        5. SWOT ANALYSIS 97
        6. KEY STRATEGIES
    139. 97
      1. samsung electronics co., ltd 98
        1. COMPANY OVERVIEW 98
        2. FINANCIAL OVERVIEW 99
        3. Products/Solutions/Services Offered 99
        4. KEY DEVELOPMENTS 100
        5. SWOT ANALYSIS 100
        6. KEY STRATEGIES
    140. 100
      1. WORLDVIZ 101
        1. COMPANY OVERVIEW 101
    141. FINANCIAL OVERVIEW 101
      1. Products/Solutions/Services Offered 101
    142. KEY DEVELOPMENTS 101
      1. nxp semiconductor n.v 102
        1. COMPANY OVERVIEW
    143. 102
      1. FINANCIAL OVERVIEW 103
        1. Products/Solutions/Services Offered
    144. 103
      1. KEY DEVELOPMENTS 104
        1. SWOT ANALYSIS 104
        2. KEY
    145. STRATEGIES 104
      1. bosch sensortec gmbh (bosch group) 105
        1. COMPANY
    146. OVERVIEW 105
      1. FINANCIAL OVERVIEW 106
        1. Products/Solutions/Services
    147. Offered 106
      1. KEY DEVELOPMENTS 107
        1. SWOT ANALYSIS 107
    148. KEY STRATEGIES 108
      1. inertial labs 109
        1. COMPANY OVERVIEW 109
        2. FINANCIAL OVERVIEW 109
        3. Products/Solutions/Services OFFERed
    149. 109
      1. KEY DEVELOPMENTS 109
      2. sony corporation 110
    150. COMPANY OVERVIEW 110
      1. FINANCIAL OVERVIEW 111
        1. Products/Solutions/Services
    151. OFFERed 112
      1. KEY DEVELOPMENTS 112
        1. SWOT ANALYSIS 112
    152. KEY STRATEGIES 113
      1. valve corporation 114
        1. COMPANY OVERVIEW
    153. 114
      1. FINANCIAL OVERVIEW 114
        1. Products/Solutions/Services OFFERed
        2. KEY DEVELOPMENTS 114
      2. htc corproation 115
        1. COMPANY OVERVIEW 115
        2. FINANCIAL OVERVIEW 115
        3. Products/Solutions/Services
    154. OFFERed 116
      1. KEY DEVELOPMENTS 116
        1. SWOT ANALYSIS 117
    155. KEY STRATEGIES 117
      1. tcl technology 118
        1. COMPANY OVERVIEW 118
        2. FINANCIAL OVERVIEW 119
        3. Products/Solutions/Services OFFERed
    156. 119
      1. KEY DEVELOPMENTS 120
        1. SWOT ANALYSIS 120
    157. KEY STRATEGIES 120
      1. dpvr. 121
        1. COMPANY OVERVIEW 121
    158. FINANCIAL OVERVIEW 121
      1. Products/Solutions/Services OFFERed 121
    159. KEY DEVELOPMENTS 121
      1. VUZIX 122
        1. COMPANY OVERVIEW 122
    160. FINANCIAL OVERVIEW 123
      1. Products/Solutions/Services OFFERed 123
    161. KEY DEVELOPMENTS 124
      1. SWOT ANALYSIS 124
        1. KEY STRATEGIES
    162. 124
      1. qualcomm technologies inc. 125
        1. COMPANY OVERVIEW 125
        2. FINANCIAL OVERVIEW 126
        3. Products/Solutions/Services OFFERed
    163. 126
      1. KEY DEVELOPMENTS 127
        1. SWOT ANALYSIS 127
    164. KEY STRATEGIES 127
      1. sieko epson corporation 128
    165. COMPANY OVERVIEW 128
      1. FINANCIAL OVERVIEW 128
        1. Products/Solutions/Services
    166. OFFERed 129
      1. KEY DEVELOPMENTS 129
        1. SWOT ANALYSIS 129
        2. KEY STRATEGIES 130
      2. penumbra, inc. 131
        1. COMPANY
    167. OVERVIEW 131
      1. FINANCIAL OVERVIEW 131
        1. Products/Solutions/Services
    168. OFFERed 132
      1. KEY DEVELOPMENTS 132
        1. SWOT ANALYSIS 132
        2. KEY STRATEGIES 133
      2. Arm Limited 134
        1. COMPANY OVERVIEW
    169. 134
      1. FINANCIAL OVERVIEW 134
        1. Products/Solutions/Services
    170. OFFERed 134
      1. KEY DEVELOPMENTS 134
      2. LEKE VR 135
    171. COMPANY OVERVIEW 135
      1. FINANCIAL OVERVIEW 135
        1. Products/Solutions/Services
    172. OFFERed 135
      1. KEY DEVELOPMENTS 135
      2. google llc 136
    173. COMPANY OVERVIEW 136
      1. FINANCIAL OVERVIEW 137
        1. Products/Solutions/Services
    174. OFFERed 137
      1. KEY DEVELOPMENTS 138
        1. SWOT ANALYSIS 138
        2. KEY STRATEGIES 138
    175. LIST OF TABLES
    176. TABLE 1 MARKET
    177. SYNOPSIS 20
    178. TABLE 2 GLOBAL AUGMENTED REALITY AND VIRTUAL REALITY HARDWARE MARKET,
    179. BY HARDWARE TYPE, 2018–2030 (USD MILLION) 40
    180. TABLE 3 GLOBAL AUGMENTED
    181. REALITY AND VIRTUAL REALITY HARDWARE MARKET, BY APPLICATION, 2018–2030 (USD
    182. MILLION) 43
    183. TABLE 4 GLOBAL AUGMENTED REALITY AND VIRTUAL REALITY HARDWARE MARKET,
    184. TABLE 5 GLOBAL
    185. AUGMENTED REALITY AND VIRTUAL REALITY HARDWARE MARKET, BY REGION, 2018–2030
    186. TABLE 6 NORTH AMERICA AUGMENTED REALITY AND VIRTUAL REALITY
    187. HARDWARE MARKET, BY COUNTRY, 2018–2030
    188. (USD MILLION) 50
    189. TABLE 7
    190. NORTH AMERICA AUGMENTED REALITY AND VIRTUAL REALITY HARDWARE MARKET, BY HARDWARE
    191. TYPE, 2018–2030
    192. (USD MILLION) 51
    193. TABLE 8 NORTH AMERICA AUGMENTED
    194. REALITY AND VIRTUAL REALITY HARDWARE MARKET, BY APPLICATION, 2019–2030
    195. (USD MILLION) 52
    196. TABLE 9 NORTH AMERICA AUGMENTED REALITY AND VIRTUAL REALITY
    197. HARDWARE MARKET, BY INDUSTRY VERTICAL, 2018–2030
    198. (USD MILLION) 53
    199. TABLE 10 US AUGMENTED REALITY AND VIRTUAL REALITY HARDWARE MARKET, BY HARDWARE
    200. TYPE, 2018–2030 (USD MILLION) 54
    201. TABLE 11 US AUGMENTED REALITY AND VIRTUAL
    202. REALITY HARDWARE MARKET, BY APPLICATION, 2018–2030 (USD MILLION) 54
    203. TABLE
    204. US AUGMENTED REALITY AND VIRTUAL REALITY HARDWARE MARKET, BY INDUSTRY VERTICAL,
    205. 2018–2030 (USD MILLION) 55
    206. TABLE 13 CANADA AUGMENTED REALITY AND VIRTUAL
    207. REALITY HARDWARE MARKET, BY HARDWARE TYPE, 2018–2030
    208. TABLE 14 CANADA AUGMENTED REALITY AND VIRTUAL REALITY HARDWARE MARKET, BY APPLICATION,
    209. TABLE 15 CANADA AUGMENTED REALITY AND VIRTUAL
    210. REALITY HARDWARE MARKET, BY INDUSTRY VERTICAL, 2018–2030
    211. 56
    212. TABLE 16 EUROPE AUGMENTED REALITY AND VIRTUAL REALITY HARDWARE MARKET, BY
    213. COUNTRY, 2018–2030 (USD MILLION) 58
    214. TABLE 17 EUROPE AUGMENTED REALITY
    215. AND VIRTUAL REALITY HARDWARE MARKET, BY HARDWARE TYPE, 2018–2030 (USD MILLION)
    216. 59
    217. TABLE 18 EUROPE AUGMENTED REALITY AND VIRTUAL REALITY HARDWARE MARKET, BY
    218. APPLICATION, 2019–2030 (USD MILLION) 60
    219. TABLE 19 EUROPE AUGMENTED REALITY
    220. AND VIRTUAL REALITY HARDWARE MARKET, BY INDUSTRY VERTICAL, 2018–2030
    221. (USD
    222. MILLION) 61
    223. TABLE 20 UK AUGMENTED REALITY AND VIRTUAL REALITY HARDWARE MARKET,
    224. BY HARDWARE TYPE, 2018–2030 (USD MILLION) 62
    225. TABLE 21 UK AUGMENTED REALITY
    226. AND VIRTUAL REALITY HARDWARE MARKET, BY APPLICATION, 2018–2030 (USD MILLION)
    227. 62
    228. TABLE 22 UK AUGMENTED REALITY AND VIRTUAL REALITY HARDWARE MARKET, BY INDUSTRY
    229. VERTICAL, 2018–2030 (USD MILLION) 63
    230. TABLE 23 GERMANY AUGMENTED REALITY
    231. AND VIRTUAL REALITY HARDWARE MARKET, BY HARDWARE TYPE, 2018–2030
    232. MILLION) 63
    233. TABLE 24 GERMANY AUGMENTED REALITY AND VIRTUAL REALITY HARDWARE
    234. MARKET, BY APPLICATION, 2018–2030 (USD MILLION) 64
    235. TABLE 25 GERMANY AUGMENTED
    236. REALITY AND VIRTUAL REALITY HARDWARE MARKET, BY INDUSTRY VERTICAL, 2018–2030
    237. TABLE 26 FRANCE AUGMENTED REALITY AND VIRTUAL REALITY
    238. HARDWARE MARKET, BY HARDWARE TYPE, 2018–2030 (USD MILLION) 65
    239. TABLE 27
    240. FRANCE AUGMENTED REALITY AND VIRTUAL REALITY HARDWARE MARKET, BY APPLICATION, 2018–2030
    241. (USD MILLION) 65
    242. TABLE 28 FRANCE AUGMENTED REALITY AND VIRTUAL REALITY HARDWARE
    243. MARKET, BY INDUSTRY VERTICAL, 2018–2030
    244. ITALY AUGMENTED REALITY AND VIRTUAL REALITY HARDWARE MARKET, BY HARDWARE TYPE,
    245. TABLE 30 ITALY AUGMENTED REALITY AND VIRTUAL
    246. REALITY HARDWARE MARKET, BY APPLICATION, 2018–2030 (USD MILLION) 67
    247. ITALY AUGMENTED REALITY AND VIRTUAL REALITY HARDWARE MARKET, BY INDUSTRY VERTICAL,
    248. TABLE 32 REST OF EUROPE AUGMENTED REALITY
    249. TABLE 33 REST OF EUROPE AUGMENTED REALITY AND VIRTUAL REALITY HARDWARE
    250. (USD MILLION) 68
    251. TABLE 34 REST
    252. OF EUROPE AUGMENTED REALITY AND VIRTUAL REALITY HARDWARE MARKET, BY INDUSTRY VERTICAL,
    253. (USD MILLION) 69
    254. TABLE 35 ASIA-PACIFIC AUGMENTED REALITY
    255. AND VIRTUAL REALITY HARDWARE MARKET, BY COUNTRY, 2018–2030 (USD MILLION) 71
    256. TABLE 36 ASIA-PACIFIC AUGMENTED REALITY AND VIRTUAL REALITY HARDWARE MARKET, BY
    257. HARDWARE TYPE, 2018–2030
    258. (USD MILLION) 72
    259. TABLE 37 ASIA-PACIFIC
    260. AUGMENTED REALITY AND VIRTUAL REALITY HARDWARE MARKET, BY APPLICATION, 2019–2030
    261. (USD MILLION) 73
    262. TABLE 38 ASIA-PACIFIC AUGMENTED REALITY AND VIRTUAL
    263. 74
    264. TABLE 39 CHINA AUGMENTED REALITY AND VIRTUAL REALITY HARDWARE MARKET, BY
    265. HARDWARE TYPE, 2018–2030 (USD MILLION) 75
    266. TABLE 40 CHINA AUGMENTED REALITY
    267. 75
    268. TABLE 41 CHINA AUGMENTED REALITY AND VIRTUAL REALITY HARDWARE MARKET, BY
    269. INDUSTRY VERTICAL, 2018–2030
    270. TABLE 42 JAPAN AUGMENTED
    271. REALITY AND VIRTUAL REALITY HARDWARE MARKET, BY HARDWARE TYPE, 2018–2030 (USD
    272. MILLION) 76
    273. TABLE 43 JAPAN AUGMENTED REALITY AND VIRTUAL REALITY HARDWARE MARKET,
    274. BY APPLICATION, 2018–2030 (USD MILLION) 77
    275. TABLE 44 JAPAN AUGMENTED REALITY
    276. MILLION) 77
    277. TABLE 45 INDIA AUGMENTED REALITY AND VIRTUAL REALITY HARDWARE MARKET,
    278. BY HARDWARE TYPE, 2018–2030 (USD MILLION) 78
    279. TABLE 46 INDIA AUGMENTED
    280. MILLION) 78
    281. TABLE 47 INDIA AUGMENTED REALITY AND VIRTUAL REALITY HARDWARE MARKET,
    282. (USD MILLION) 79
    283. TABLE 48 SOUTH
    284. KOREA AUGMENTED REALITY AND VIRTUAL REALITY HARDWARE MARKET, BY HARDWARE TYPE, 2018–2030
    285. TABLE 49 SOUTH KOREA AUGMENTED REALITY AND VIRTUAL REALITY
    286. HARDWARE MARKET, BY APPLICATION, 2018–2030
    287. (USD MILLION) 80
    288. SOUTH KOREA AUGMENTED REALITY AND VIRTUAL REALITY HARDWARE MARKET, BY INDUSTRY
    289. VERTICAL, 2018–2030
    290. TABLE 51 REST OF ASIA-PACIFIC
    291. (USD MILLION) 81
    292. TABLE 52 REST OF ASIA-PACIFIC AUGMENTED REALITY AND
    293. VIRTUAL REALITY HARDWARE MARKET, BY APPLICATION, 2018–2030
    294. 81
    295. TABLE 53 REST OF ASIA-PACIFIC AUGMENTED REALITY AND VIRTUAL REALITY HARDWARE
    296. MARKET, BY INDUSTRY VERTICAL,
    297. MIDDLE EAST & AFRICAAUGMENTED REALITY AND VIRTUAL REALITY HARDWARE MARKET,
    298. BY HARDWARE TYPE, 2018–2030
    299. (USD MILLION) 83
    300. TABLE 55 MIDDLE EAST
    301. & AFRICAAUGMENTED REALITY AND VIRTUAL REALITY HARDWARE MARKET, BY APPLICATION,
    302. 2019–2030
    303. (USD MILLION) 84
    304. TABLE 56 MIDDLE EAST & AFRICAAUGMENTED
    305. TABLE 57 LATIN AMERICAAUGMENTED REALITY AND VIRTUAL REALITY
    306. HARDWARE MARKET, BY HARDWARE TYPE, 2018–2030
    307. (USD MILLION) 87
    308. LATIN AMERICAAUGMENTED REALITY AND VIRTUAL REALITY HARDWARE MARKET, BY APPLICATION,
    309. (USD MILLION) 88
    310. TABLE 59 LATIN AMERICA AUGMENTED REALITY
    311. MILLION) 89
    312. TABLE 60 PARTNERSHIPS/AGREEMENTS/CONTRACTS/COLLABORATIONS 92
    313. TABLE 61 BUSINESS EXPANSIONS/ACQUISITIONS 93
    314. TABLE 62 PRODUCT LAUNCHES/DEVELOPMENTS
    315. 93
    316. TABLE 63 OCULUS VR (META): PRODUCTS/SOLUTIONS/SERVICES OFFERED 96
    317. OCULUS VR (META): KEY DEVELOPMENTS 97
    318. TABLE 65 SAMSUNG ELECTRONICS CO.,
    319. LTD: PRODUCTS/SOLUTIONS/SERVICES OFFERED 99
    320. TABLE 66 SAMSUNG ELECTRONICS CO.,
    321. LTD: KEY DEVELOPMENTS 100
    322. TABLE 67 WORLDVIZ: PRODUCTS/SOLUTIONS/SERVICES OFFERED
    323. 101
    324. TABLE 68 NXP SEMICONDUCTORS N.V: PRODUCTS/SOLUTIONS/SERVICES OFFERED 103
    325. TABLE 69 NXP SEMICONDUCTORS N.V: KEY DEVELOPMENTS 104
    326. TABLE 70 BOSCH SENSORTEC
    327. GMBH (BOSCH GROUP): PRODUCTS/SOLUTIONS/SERVICES OFFERED 106
    328. TABLE 71 BOSCH
    329. SENSORTEC GMBH (BOSCH GROUP): KEY DEVELOPMENTS 107
    330. TABLE 72 INERTIAL LABS:
    331. PRODUCTS/SOLUTIONS/SERVICES OFFERED 109
    332. TABLE 73 INERTIAL LABS: KEY DEVELOPMENTS
    333. TABLE 74 SONY CORPORATION: PRODUCTS/SOLUTIONS/SERVICES OFFERED 112
    334. SONY CORPORATION: KEY DEVELOPMENTS 112
    335. TABLE 76 VALVE CORPORATION: PRODUCTS/SOLUTIONS/SERVICES
    336. OFFERED 114
    337. TABLE 77 VALVE CORPORATION: KEY DEVELOPMENTS 114
    338. TABLE 78
    339. HTC CORPORATION: PRODUCTS/SOLUTIONS/SERVICES OFFERED 116
    340. TABLE 79 HTC CORPORATION:
    341. KEY DEVELOPMENTS 116
    342. TABLE 80 TCL TECHNOLOGY: PRODUCTS/SOLUTIONS/SERVICES OFFERED
    343. TABLE 81 TCL TECHNOLOGY: KEY DEVELOPMENTS 120
    344. TABLE 82 DPVR.: PRODUCTS/SOLUTIONS/SERVICES
    345. OFFERED 121
    346. TABLE 83 VUZIX: PRODUCTS/SOLUTIONS/SERVICES OFFERED 123
    347. VUZIX: KEY DEVELOPMENTS 124
    348. TABLE 85 QUALCOM TECHNOLOGIES INC.: PRODUCTS/SOLUTIONS/SERVICES
    349. OFFERED 126
    350. TABLE 86 QUALCOM TECHNOLOGIES INC.: KEY DEVELOPMENTS 127
    351. SEIKO EPSON CORPORATION: PRODUCTS/SOLUTIONS/SERVICES OFFERED 129
    352. TABLE 88
    353. SEIKO EPSON CORPORATION: KEY DEVELOPMENTS 129
    354. TABLE 89 PENUMBRA, INC: PRODUCTS/SOLUTIONS/SERVICES
    355. TABLE 90 PENUMBRA, INC: KEY DEVELOPMENTS 132
    356. TABLE 91 ARM
    357. LIMITED: PRODUCTS/SOLUTIONS/SERVICES OFFERED 134
    358. TABLE 92 LEKE VR: PRODUCTS/SOLUTIONS/SERVICES
    359. TABLE 93 GOOGLE LLC: PRODUCTS/SOLUTIONS/SERVICES OFFERED 137
    360. TABLE 94 GOOGLE LLC: KEY DEVELOPMENTS 138
    361. LIST OF FIGURES
    362. FIGURE 1 MARKET ATTRACTIVENESS ANALYSIS: GLOBAL AUGMENTED REALITY AND VIRTUAL
    363. REALITY HARDWARE MARKET 20
    364. FIGURE 2 GLOBAL AUGMENTED REALITY AND VIRTUAL REALITY
    365. HARDWARE MARKET: MARKET STRUCTURE 22
    366. FIGURE 3 BOTTOM-UP AND TOP-DOWN APPROACHES
    367. 27
    368. FIGURE 4 MARKET DYNAMICS: ANALYSIS OF THE GLOBAL AUGMENTED REALITY AND VIRTUAL
    369. REALITY HARDWARE MARKET 30
    370. FIGURE 5 DRIVERS IMPACT ANALYSIS: GLOBAL AUGMENTED
    371. REALITY AND VIRTUAL REALITY HARDWARE MARKET 32
    372. FIGURE 6 RESTRAINTS IMPACT ANALYSIS:
    373. GLOBAL AUGMENTED REALITY AND VIRTUAL REALITY HARDWARE MARKET 33
    374. FIGURE 7 SUPPLY
    375. CHAIN ANALYSIS: GLOBAL AUGMENTED REALITY AND VIRTUAL REALITY HARDWARE MARKET 36
    376. FIGURE 8 Porter's Five Forces Analysis: GLOBAL AUGMENTED REALITY AND VIRTUAL REALITY
    377. HARDWARE MARKET 37
    378. FIGURE 9 GLOBAL AUGMENTED REALITY AND VIRTUAL REALITY HARDWARE
    379. MARKET, BY HARDWARE TYPE, 2021 (% SHARE) 39
    380. FIGURE 10 GLOBAL AUGMENTED REALITY
    381. AND VIRTUAL REALITY HARDWARE MARKET, BY HARDWARE TYPE, 2021 VS 2030
    382. 39
    383. FIGURE 11 GLOBAL AUGMENTED REALITY AND VIRTUAL REALITY HARDWARE MARKET,
    384. BY APPLICATION, 2021 (% SHARE) 42
    385. FIGURE 12 GLOBAL AUGMENTED REALITY AND VIRTUAL
    386. REALITY HARDWARE MARKET, BY APPLICATION, 2021 VS 2030 (USD MILLION) 42
    387. FIGURE
    388. GLOBAL AUGMENTED REALITY AND VIRTUAL REALITY HARDWARE MARKET, BY INDUSTRY VERTICAL,
    389. (% SHARE) 44
    390. FIGURE 14 GLOBAL AUGMENTED REALITY AND VIRTUAL REALITY HARDWARE
    391. MARKET, BY INDUSTRY VERTICAL, 2021 VS 2030
    392. (USD MILLION) 44
    393. FIGURE 15
    394. GLOBAL AUGMENTED REALITY AND VIRTUAL REALITY HARDWARE MARKET, BY REGION, 2021 (%
    395. SHARE) 47
    396. FIGURE 16 GLOBAL AUGMENTED REALITY AND VIRTUAL REALITY HARDWARE MARKET,
    397. BY REGION, 2021 VS 2030 (USD MILLION) 48
    398. FIGURE 17 NORTH AMERICA AUGMENTED
    399. REALITY AND VIRTUAL REALITY HARDWARE MARKET, BY COUNTRY, 2021 (% SHARE) 49
    400. NORTH AMERICA AUGMENTED REALITY AND VIRTUAL REALITY HARDWARE MARKET, BY COUNTRY,
    401. VS 2030
    402. FIGURE 19 NORTH AMERICA AUGMENTED REALITY
    403. AND VIRTUAL REALITY HARDWARE MARKET, BY HARDWARE TYPE, 2018-2030
    404. FIGURE 20 NORTH AMERICA AUGMENTED REALITY AND VIRTUAL REALITY HARDWARE MARKET,
    405. BY APPLICATION, 2018-2030
    406. FIGURE 21 NORTH AMERICA AUGMENTED
    407. REALITY AND VIRTUAL REALITY HARDWARE MARKET, BY INDUSTRY VERTICAL, 2018-2030
    408. FIGURE 22 EUROPE AUGMENTED REALITY AND VIRTUAL REALITY HARDWARE
    409. MARKET, BY COUNTRY, 2021 (% SHARE) 57
    410. FIGURE 23 EUROPE AUGMENTED REALITY AND
    411. VIRTUAL REALITY HARDWARE MARKET, BY COUNTRY, 2021 VS 2030 (USD MILLION) 58
    412. EUROPE AUGMENTED REALITY AND VIRTUAL REALITY HARDWARE MARKET, BY HARDWARE TYPE,
    413. 2030 (USD MILLION) 59
    414. FIGURE 25 EUROPE AUGMENTED REALITY AND VIRTUAL REALITY
    415. HARDWARE MARKET, BY APPLICATION, 2018-2030 (USD MILLION) 60
    416. FIGURE 26 EUROPE
    417. AUGMENTED REALITY AND VIRTUAL REALITY HARDWARE MARKET, BY INDUSTRY VERTICAL, 2018-2030
    418. (USD MILLION) 61
    419. FIGURE 27 ASIA-PACIFIC AUGMENTED REALITY AND VIRTUAL
    420. REALITY HARDWARE MARKET, BY COUNTRY, 2021 (% SHARE) 70
    421. FIGURE 28 ASIA-PACIFIC
    422. AUGMENTED REALITY AND VIRTUAL REALITY HARDWARE MARKET, BY COUNTRY, 2021 VS 2030
    423. (USD MILLION) 71
    424. FIGURE 29 ASIA-PACIFIC AUGMENTED REALITY AND VIRTUAL REALITY
    425. HARDWARE MARKET, BY HARDWARE TYPE, 2018-2030
    426. ASIA-PACIFIC AUGMENTED REALITY AND VIRTUAL REALITY HARDWARE MARKET, BY APPLICATION,
    427. 2030 (USD MILLION) 73
    428. FIGURE 31 ASIA-PACIFIC AUGMENTED REALITY AND VIRTUAL
    429. REALITY HARDWARE MARKET, BY INDUSTRY VERTICAL, 2018-2030
    430. (USD MILLION) 74
    431. FIGURE 32 MIDDLE EAST & AFRICAAUGMENTED REALITY AND VIRTUAL REALITY HARDWARE
    432. MARKET, BY HARDWARE TYPE, 2018-2030
    433. FIGURE 33 MIDDLE
    434. EAST & AFRICAAUGMENTED REALITY AND VIRTUAL REALITY HARDWARE MARKET, BY APPLICATION,
    435. 2030
    436. FIGURE 34 MIDDLE EAST & AFRICAAUGMENTED
    437. FIGURE 35 LATIN AMERICAAUGMENTED REALITY AND VIRTUAL REALITY
    438. LATIN AMERICAAUGMENTED REALITY AND VIRTUAL REALITY HARDWARE MARKET, BY APPLICATION,
    439. FIGURE 37 LATIN AMERICAAUGMENTED REALITY AND
    440. 2030 (USD MILLION)
    441. 89
    442. FIGURE 38 GLOBAL AUGMENTED AND VIRTUAL REALITY MARKET: COMPETITIVE BENCHMARKING
    443. 91
    444. FIGURE 39 VENDOR SHARE ANALYSIS, 2021 (%) 92
    445. FIGURE 40 OCULUS VR (META):
    446. FINANCIAL OVERVIEW SNAPSHOT 96
    447. FIGURE 41 OCULUS VR (META): SWOT ANALYSIS 97
    448. FIGURE 42 SAMSUNG ELECTRONICS CO., LTD: FINANCIAL OVERVIEW SNAPSHOT 99
    449. SAMSUNG ELECTRONICS CO., LTD: SWOT ANALYSIS 100
    450. FIGURE 44 NXP SEMICONDUCTORS
    451. N.V: FINANCIAL OVERVIEW SNAPSHOT 103
    452. FIGURE 45 NXP SEMICONDUCTORS N.V: SWOT
    453. ANALYSIS 104
    454. FIGURE 46 BOSCH SENSORTEC GMBH (BOSCH GROUP): FINANCIAL OVERVIEW
    455. SNAPSHOT 106
    456. FIGURE 47 BOSCH SENSORTEC GMBH (BOSCH GROUP): SWOT ANALYSIS 107
    457. FIGURE 48 SONY CORPORATION: FINANCIAL OVERVIEW SNAPSHOT 111
    458. FIGURE 49 SONY
    459. CORPORATION: SWOT ANALYSIS 112
    460. FIGURE 50 HTC CORPORATION: FINANCIAL OVERVIEW
    461. SNAPSHOT 115
    462. FIGURE 51 HTC CORPORATION: SWOT ANALYSIS 117
    463. FIGURE 52 TCL
    464. TECHNOLOGY: FINANCIAL OVERVIEW SNAPSHOT 119
    465. FIGURE 53 TCL TECHNOLOGY: SWOT
    466. ANALYSIS 120
    467. FIGURE 54 VUZIX: FINANCIAL OVERVIEW SNAPSHOT 123
    468. FIGURE 55
    469. VUZIX: SWOT ANALYSIS 124
    470. FIGURE 56 QUALCOM TECHNOLOGIES INC.: FINANCIAL OVERVIEW
    471. SNAPSHOT 126
    472. FIGURE 57 QUALCOM TECHNOLOGIES INC.: SWOT ANALYSIS 127
    473. SEIKO EPSON CORPORATION: FINANCIAL OVERVIEW SNAPSHOT 128
    474. FIGURE 59 SEIKO
    475. EPSON CORPORATION: SWOT ANALYSIS 129
    476. FIGURE 60 PENUMBRA, INC: FINANCIAL OVERVIEW
    477. SNAPSHOT 131
    478. FIGURE 61 PENUMBRA, INC: SWOT ANALYSIS 132
    479. FIGURE 62 GOOGLE
    480. LLC: FINANCIAL OVERVIEW SNAPSHOT 137
    481. FIGURE 63 GOOGLE LLC: SWOT ANALYSIS 138

    AR/VR Hardware Market Segmentation

    • Global AR/VR Hardware, By Hardware Type Outlook (USD Million, 2018-2030)

      • Sensors
      • Processors
      • Controllers
      • Cameras
      • Headphones
      • Display Monitors
      • Others
    • Global AR/VR Hardware, By Application (USD Million, 2018-2030)

      • Head Mounted Display
      • Head Up Display
      • Handheld Devices
    • Global AR/VR Hardware, By Industry Vertical Outlook (USD Million, 2018-2030)

      • Aerospace & Defense
      • Gaming & Entertainment
      • Education & Training
      • Healthcare
      • Automotive
      • Others

    Global AR/VR Hardware Regional Outlook (USD Million, 2018-2030)

    • North America Outlook (USD Million, 2018-2030)

      • North America AR/VR Hardware, By Hardware Type Outlook (USD Million, 2018-2030)

        • Sensors
        • Processors
        • Controllers
        • Cameras
        • Headphones
        • Display Monitors
        • Others
      • North America AR/VR Hardware, By Application (USD Million, 2018-2030)

        • Head Mounted Display
        • Head Up Display
        • Handheld Devices
      • North America AR/VR Hardware, By Industry Vertical Outlook (USD Million, 2018-2030)

        • Aerospace & Defense
        • Gaming & Entertainment
        • Education & Training
        • Healthcare
        • Automotive
        • Others
        • US Outlook (USD Million, 2018-2030)

        • US AR/VR Hardware, By Hardware Type Outlook (USD Million, 2018-2030)

          • Sensors
          • Processors
          • Controllers
          • Cameras
          • Headphones
          • Display Monitors
          • Others
        • US AR/VR Hardware, By Application (USD Million, 2018-2030)

          • Head Mounted Display
          • Head Up Display
          • Handheld Devices
        • US AR/VR Hardware, By Industry Vertical Outlook (USD Million, 2018-2030)

          • Aerospace & Defense
          • Gaming & Entertainment
          • Education & Training
          • Healthcare
          • Automotive
          • Others
        • Canada Outlook (USD Million, 2018-2030)

        • Canada AR/VR Hardware, By Hardware Type Outlook (USD Million, 2018-2030)

          • Sensors
          • Processors
          • Controllers
          • Cameras
          • Headphones
          • Display Monitors
          • Others
        • Canada AR/VR Hardware, By Application (USD Million, 2018-2030)

          • Head Mounted Display
          • Head Up Display
          • Handheld Devices
        • Canada AR/VR Hardware, By Industry Vertical Outlook (USD Million, 2018-2030)

          • Aerospace & Defense
          • Gaming & Entertainment
          • Education & Training
          • Healthcare
          • Automotive
          • Others
        • Mexico Outlook (USD Million, 2018-2030)

        • Mexico AR/VR Hardware, By Hardware Type Outlook (USD Million, 2018-2030)

          • Sensors
          • Processors
          • Controllers
          • Cameras
          • Headphones
          • Display Monitors
          • Others
        • Mexico AR/VR Hardware, By Application (USD Million, 2018-2030)

          • Head Mounted Display
          • Head Up Display
          • Handheld Devices
        • Mexico AR/VR Hardware, By Industry Vertical Outlook (USD Million, 2018-2030)

          • Aerospace & Defense
          • Gaming & Entertainment
          • Education & Training
          • Healthcare
          • Automotive
          • Others
    • Europe Outlook (USD Million, 2018-2030)

      • Europe AR/VR Hardware, By Hardware Type Outlook (USD Million, 2018-2030)

        • Sensors
        • Processors
        • Controllers
        • Cameras
        • Headphones
        • Display Monitors
        • Others
      • Europe AR/VR Hardware, By Application (USD Million, 2018-2030)

        • Head Mounted Display
        • Head Up Display
        • Handheld Devices
      • Europe AR/VR Hardware, By Industry Vertical Outlook (USD Million, 2018-2030)

        • Aerospace & Defense
        • Gaming & Entertainment
        • Education & Training
        • Healthcare
        • Automotive
        • Others
        • Germany Outlook (USD Million, 2018-2030)

        • Germany AR/VR Hardware, By Hardware Type Outlook (USD Million, 2018-2030)

          • Sensors
          • Processors
          • Controllers
          • Cameras
          • Headphones
          • Display Monitors
          • Others
        • Germany AR/VR Hardware, By Application (USD Million, 2018-2030)

          • Head Mounted Display
          • Head Up Display
          • Handheld Devices
        • Germany AR/VR Hardware, By Industry Vertical Outlook (USD Million, 2018-2030)

          • Aerospace & Defense
          • Gaming & Entertainment
          • Education & Training
          • Healthcare
          • Automotive
          • Others
        • France Outlook (USD Million, 2018-2030)

        • France AR/VR Hardware, By Hardware Type Outlook (USD Million, 2018-2030)

          • Sensors
          • Processors
          • Controllers
          • Cameras
          • Headphones
          • Display Monitors
          • Others
        • France AR/VR Hardware, By Application (USD Million, 2018-2030)

          • Head Mounted Display
          • Head Up Display
          • Handheld Devices
        • France AR/VR Hardware, By Industry Vertical Outlook (USD Million, 2018-2030)

          • Aerospace & Defense
          • Gaming & Entertainment
          • Education & Training
          • Healthcare
          • Automotive
          • Others
        • UK Outlook (USD Million, 2018-2030)

        • UK AR/VR Hardware, By Hardware Type Outlook (USD Million, 2018-2030)

          • Sensors
          • Processors
          • Controllers
          • Cameras
          • Headphones
          • Display Monitors
          • Others
        • UK AR/VR Hardware, By Application (USD Million, 2018-2030)

          • Head Mounted Display
          • Head Up Display
          • Handheld Devices
        • UK AR/VR Hardware, By Industry Vertical Outlook (USD Million, 2018-2030)

          • Aerospace & Defense
          • Gaming & Entertainment
          • Education & Training
          • Healthcare
          • Automotive
          • Others
        • Rest of Europe Outlook (USD Million, 2018-2030)

        • Rest of Europe AR/VR Hardware, By Hardware Type Outlook (USD Million, 2018-2030)

          • Sensors
          • Processors
          • Controllers
          • Cameras
          • Headphones
          • Display Monitors
          • Others
        • Rest of Europe AR/VR Hardware, By Application (USD Million, 2018-2030)

          • Head Mounted Display
          • Head Up Display
          • Handheld Devices
        • Rest of Europe AR/VR Hardware, By Industry Vertical Outlook (USD Million, 2018-2030)

          • Aerospace & Defense
          • Gaming & Entertainment
          • Education & Training
          • Healthcare
          • Automotive
          • Others
    • Asia-Pacific Outlook (USD Million, 2018-2030)

      • Asia-Pacific AR/VR Hardware, By Hardware Type Outlook (USD Million, 2018-2030)

        • Sensors
        • Processors
        • Controllers
        • Cameras
        • Headphones
        • Display Monitors
        • Others
      • Asia-Pacific AR/VR Hardware, By Application (USD Million, 2018-2030)

        • Head Mounted Display
        • Head Up Display
        • Handheld Devices
      • Asia-Pacific AR/VR Hardware, By Industry Vertical Outlook (USD Million, 2018-2030)

        • Aerospace & Defense
        • Gaming & Entertainment
        • Education & Training
        • Healthcare
        • Automotive
        • Others
        • China Outlook (USD Million, 2018-2030)

        • China AR/VR Hardware, By Hardware Type Outlook (USD Million, 2018-2030)

          • Sensors
          • Processors
          • Controllers
          • Cameras
          • Headphones
          • Display Monitors
          • Others
        • China AR/VR Hardware, By Application (USD Million, 2018-2030)

          • Head Mounted Display
          • Head Up Display
          • Handheld Devices
        • China AR/VR Hardware, By Industry Vertical Outlook (USD Million, 2018-2030)

          • Aerospace & Defense
          • Gaming & Entertainment
          • Education & Training
          • Healthcare
          • Automotive
          • Others
        • India Outlook (USD Million, 2018-2030)

        • India AR/VR Hardware, By Hardware Type Outlook (USD Million, 2018-2030)

          • Sensors
          • Processors
          • Controllers
          • Cameras
          • Headphones
          • Display Monitors
          • Others
        • India AR/VR Hardware, By Application (USD Million, 2018-2030)

          • Head Mounted Display
          • Head Up Display
          • Handheld Devices
        • India AR/VR Hardware, By Industry Vertical Outlook (USD Million, 2018-2030)

          • Aerospace & Defense
          • Gaming & Entertainment
          • Education & Training
          • Healthcare
          • Automotive
          • Others
        • Japan Outlook (USD Million, 2018-2030)

        • Japan AR/VR Hardware, By Hardware Type Outlook (USD Million, 2018-2030)

          • Sensors
          • Processors
          • Controllers
          • Cameras
          • Headphones
          • Display Monitors
          • Others
        • Japan AR/VR Hardware, By Application (USD Million, 2018-2030)

          • Head Mounted Display
          • Head Up Display
          • Handheld Devices
        • Japan AR/VR Hardware, By Industry Vertical Outlook (USD Million, 2018-2030)

          • Aerospace & Defense
          • Gaming & Entertainment
          • Education & Training
          • Healthcare
          • Automotive
          • Others
        • Rest of Asia-Pacific Outlook (USD Million, 2018-2030)

        • Rest of Asia-Pacific AR/VR Hardware, By Hardware Type Outlook (USD Million, 2018-2030)

          • Sensors
          • Processors
          • Controllers
          • Cameras
          • Headphones
          • Display Monitors
          • Others
        • Rest of Asia-Pacific AR/VR Hardware, By Application (USD Million, 2018-2030)

          • Head Mounted Display
          • Head Up Display
          • Handheld Devices
        • Rest of Asia-Pacific AR/VR Hardware, By Industry Vertical Outlook (USD Million, 2018-2030)

          • Aerospace & Defense
          • Gaming & Entertainment
          • Education & Training
          • Healthcare
          • Automotive
          • Others
    • Rest of the World Outlook (USD Million, 2018-2030)

      • Rest of the World AR/VR Hardware, By Hardware Type Outlook (USD Million, 2018-2030)

        • Sensors
        • Processors
        • Controllers
        • Cameras
        • Headphones
        • Display Monitors
        • Others
      • Rest of the World AR/VR Hardware, By Application (USD Million, 2018-2030)

        • Head Mounted Display
        • Head Up Display
        • Handheld Devices
      • Rest of the World AR/VR Hardware, By Industry Vertical Outlook (USD Million, 2018-2030)

        • Aerospace & Defense
        • Gaming & Entertainment
        • Education & Training
        • Healthcare
        • Automotive
        • Others
      • Middle East & Africa Outlook (USD Million, 2018-2030)

      • Middle East & Africa AR/VR Hardware, By Hardware Type Outlook (USD Million, 2018-2030)

        • Sensors
        • Processors
        • Controllers
        • Cameras
        • Headphones
        • Display Monitors
        • Others
      • Middle East & Africa AR/VR Hardware, By Application (USD Million, 2018-2030)

        • Head Mounted Display
        • Head Up Display
        • Handheld Devices
      • Middle East & Africa AR/VR Hardware, By Industry Vertical Outlook (USD Million, 2018-2030)

        • Aerospace & Defense
        • Gaming & Entertainment
        • Education & Training
        • Healthcare
        • Automotive
        • Others
    • South America Outlook (USD Million, 2018-2030)

      • South America AR/VR Hardware, By Hardware Type Outlook (USD Million, 2018-2030)

        • Sensors
        • Processors
        • Controllers
        • Cameras
        • Headphones
        • Display Monitors
        • Others
      • South America AR/VR Hardware, By Application (USD Million, 2018-2030)

        • Head Mounted Display
        • Head Up Display
        • Handheld Devices
      • South America AR/VR Hardware, By Industry Vertical Outlook (USD Million, 2018-2030)

        • Aerospace & Defense
        • Gaming & Entertainment
        • Education & Training
        • Healthcare
        • Automotive
        • Others
    Infographic

    Free Sample Request

    Kindly complete the form below to receive a free sample of this Report

    Get Free Sample

    Customer Strories

    “I am very pleased with how market segments have been defined in a relevant way for my purposes (such as "Portable Freezers & refrigerators" and "last-mile"). In general the report is well structured. Thanks very much for your efforts.”

    Victoria Milne

    Founder
    Case Study
    Chemicals and Materials