• Cat-intel
  • MedIntelliX
  • Resources
  • About Us
  • English
    Chinese
    French
    Japanese
    Korean
    German
    Spanish

    Analytics of Things Market Trends

    ID: MRFR/ICT/2610-HCR
    100 Pages
    Ankit Gupta
    September 2025

    Analytics of Things Market Research Report Information By Type (Descriptive Analytics, Predictive Analytics, and Prescriptive Analytics), Application (Sales & Customer Management, Predictive Maintenance & Asset Management, Energy Management, Inventory Management, Security & Emergency Management, Building Automation, IT, Remote Monitoring), Component (Software and Services), Vertical...

    Share:
    Download PDF ×

    We do not share your information with anyone. However, we may send you emails based on your report interest from time to time. You may contact us at any time to opt-out.

    Analytics of Things Market Infographic
    $ 4,950.0
    $ 5,950.0
    $ 7,250.0

    Market Trends

    Key Emerging Trends in the Analytics of Things Market

    The Analytics of Things (AoT) market has witnessed significant growth and evolution in recent years, driven by the increasing adoption of IoT (Internet of Things) devices across various industries. The integration of analytics with IoT has given rise to Analytics of Things, enabling organizations to derive valuable insights from the vast amounts of data generated by connected devices. One prominent market trend is the growing emphasis on real-time analytics capabilities. Businesses are increasingly recognizing the importance of extracting actionable insights from IoT data in real-time to make informed decisions and respond promptly to changing conditions.

    Moreover, the Analytics of Things market is experiencing a surge in demand for advanced analytics solutions, such as machine learning and artificial intelligence (AI). These technologies enhance the ability to analyze complex data sets, identify patterns, and predict future trends. As organizations seek more sophisticated and accurate insights, the integration of machine learning and AI into Analytics of Things platforms is becoming a standard practice

    Another notable trend is the rising adoption of edge analytics in the Analytics of Things ecosystem. Edge analytics involves processing data closer to the source, reducing latency and bandwidth requirements. This approach is particularly crucial in scenarios where real-time insights are paramount, such as in industrial settings or smart cities. By analyzing data at the edge, organizations can optimize operational efficiency and respond swiftly to events as they unfold.

    The Analytics of Things market is also witnessing a shift towards cloud-based solutions. Cloud platforms offer scalability, flexibility, and cost-effectiveness, making them an attractive option for businesses looking to deploy analytics solutions seamlessly. Cloud-based AoT solutions enable organizations to manage and analyze data efficiently, regardless of the scale of their IoT deployments. This trend aligns with the broader industry movement towards cloud adoption across various technology domains.

    Interoperability and standardization are emerging as critical considerations in the Analytics of Things market. As the number of IoT devices continues to grow, ensuring compatibility and seamless communication between different devices and platforms becomes imperative. Standardization efforts are underway to establish common protocols and frameworks, fostering a more cohesive and interconnected AoT ecosystem. This trend is essential for promoting collaboration among diverse IoT devices and ensuring the interoperability of analytics solutions.

    Security remains a top concern in the Analytics of Things market. With the proliferation of connected devices, the attack surface for potential cyber threats expands. Organizations are increasingly prioritizing robust security measures to safeguard sensitive IoT data and prevent unauthorized access. As the AoT market evolves, the integration of advanced security features and encryption technologies is becoming standard practice to address these concerns.
    Market Summary

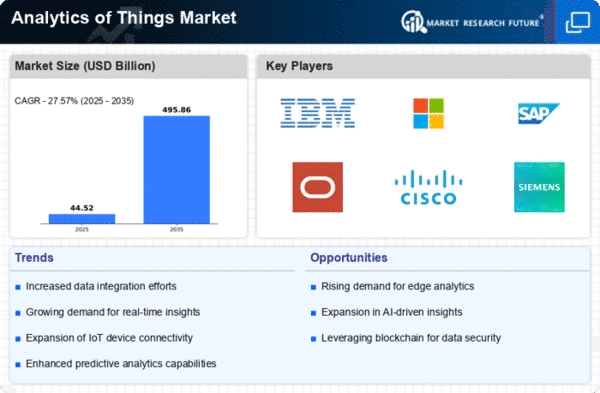
    The Global Analytics of Things Market is projected to grow from 34.9 USD Billion in 2024 to 508.6 USD Billion by 2035.

    Key Market Trends & Highlights

    Analytics of Things Key Trends and Highlights

    • The market is expected to experience a compound annual growth rate of 27.57 percent from 2025 to 2035.
    • By 2035, the market valuation is anticipated to reach 508.6 USD Billion, indicating robust growth potential.
    • In 2024, the market is valued at 34.9 USD Billion, reflecting a strong foundation for future expansion.
    • Growing adoption of analytics technologies due to increasing demand for data-driven decision making is a major market driver.

    Market Size & Forecast

    2024 Market Size 34.9 (USD Billion)
    2035 Market Size 508.6 (USD Billion)
    CAGR (2025-2035) 27.57%
    Largest Regional Market Share in 2024 latin_america)

    Major Players

    Amazon Web Services, Inc., Cisco Systems, Inc., Dell INC, Goolara, Hewlett Packard Enterprise Development LP, IBM Corporation, Microsoft, Oracle, Salesforce, SAP SE, Teradata, Google, Inc., PTC, Hitachi, Ltd, Greenwave Systems

    Market Trends

    The integration of advanced analytics with IoT devices is poised to transform industries by enabling real-time decision-making and enhancing operational efficiency.

    U.S. Department of Commerce

    Analytics of Things Market Market Drivers

    Market Growth Charts

    Rapid Growth of IoT Devices

    The proliferation of Internet of Things devices is a primary driver of the Global Analytics of Things Market Industry. As of 2024, the number of connected devices is projected to reach approximately 34.9 billion, significantly enhancing data generation. This surge in devices necessitates advanced analytics to derive actionable insights from the vast amounts of data collected. Organizations across various sectors, including healthcare and manufacturing, are increasingly leveraging these analytics to optimize operations and improve decision-making processes. The anticipated growth in the number of IoT devices is expected to contribute substantially to the market's expansion, with projections indicating a market value of 508.6 billion USD by 2035.

    Expansion of Smart Cities Initiatives

    The expansion of smart cities initiatives is a pivotal driver of the Global Analytics of Things Market Industry. Governments worldwide are investing in smart infrastructure to enhance urban living through improved transportation, energy management, and public safety. For instance, cities are deploying sensors to monitor traffic patterns and optimize public transport systems, generating vast amounts of data that require sophisticated analytics for effective management. This trend is expected to accelerate market growth, as the demand for analytics solutions that can process and interpret urban data continues to rise. The anticipated market value of 508.6 billion USD by 2035 underscores the potential of smart city projects in driving analytics adoption.

    Growing Focus on Data Security and Privacy

    The heightened emphasis on data security and privacy is influencing the Global Analytics of Things Market Industry. As organizations collect and analyze vast amounts of data, concerns regarding data breaches and compliance with regulations such as GDPR have intensified. Companies are investing in robust analytics solutions that prioritize security measures to protect sensitive information. This trend is particularly evident in sectors like finance and healthcare, where data integrity is paramount. The focus on data security is likely to drive the adoption of advanced analytics tools, contributing to the market's growth trajectory as organizations seek to mitigate risks associated with data handling.

    Increased Demand for Real-Time Data Analytics

    The demand for real-time data analytics is reshaping the Global Analytics of Things Market Industry. Businesses are increasingly recognizing the value of immediate insights to enhance operational efficiency and customer satisfaction. For instance, retail companies utilize real-time analytics to monitor inventory levels and consumer behavior, allowing for timely adjustments to marketing strategies. This trend is expected to drive market growth, as organizations seek to implement analytics solutions that provide instantaneous feedback. The growing reliance on real-time data is likely to propel the market forward, with a projected compound annual growth rate of 27.57% from 2025 to 2035.

    Integration of Artificial Intelligence and Machine Learning

    The integration of artificial intelligence and machine learning technologies into analytics platforms is a significant catalyst for the Global Analytics of Things Market Industry. These technologies enhance the ability to process and analyze large datasets, enabling organizations to uncover patterns and trends that may not be immediately apparent. For example, predictive maintenance in manufacturing leverages AI to analyze equipment data, reducing downtime and operational costs. As businesses increasingly adopt AI-driven analytics solutions, the market is poised for substantial growth, with forecasts suggesting a market value of 508.6 billion USD by 2035, reflecting the transformative impact of these technologies.

    Market Segment Insights

    Analytics of Things Market Research (MRFR Insights)

    COVID-19 Impact Analysis

    The analytics of things market size is projected to reach approximately USD 120.4 billion by 2030, at a CAGR of 33.40% from 2022 to 2030. Analytics of things is used to analyze the data generated by the Internet of things devices. It further helps to provide the required data and insights for different devices and organizations. As per the market research, the growth of the analytics of things market can be attributed to the constant introduction of innovative smart watches, smart glasses, and smart cities worldwide.

    In addition, the growing emphasis on real-time data, time and cost management, and soaring demand for automation in various industries is further impacting the market's growth in the forecasted years.

    The market analysis suggests that the COVID-19 pandemic has positively impacted the market because of giant players' rapid adoption of online solutions in numerous countries. Additionally, due to strict lockdown measures, a paradigm shift was observed from offline to online platforms, subsequently influencing the adoption of analytical solutions across the globe.

    The growing number of connected devices, technological advancements in the analytics of things system, and increasing need for data analytics services are boosting the market for analytics of things in the upcoming years. Moreover, rapidly expanding real-time viewing services and the cost-efficiency of the market for analytics of things is further escalating the market's growth in the forecasted years.

    Get more detailed insights about Analytics of Things Market Research Report - Global Forecast till 2030

    Regional Insights

    Key Companies in the Analytics of Things Market market include

    Industry Developments

    In October 2022: KTD SYNNEX unveiled Data-IoTSolv in the Americas, empowering partners with IoT and data analytics tools for business growth. The solution includes AI and advanced analytics technologies for resellers.

    In August 2022: Amazon Web Services (AWS) revealed CEAT LTD's utilization of AWS for smart manufacturing. CEAT employs IoT, analytics, and machine learning to produce intelligent, sensor-equipped tires, enhancing manufacturing efficiency and enabling data-driven decisions with SAP on AWS. This development signifies CEAT's innovative strides in digitizing factories and launching new digital services.

    In May 2022: Kajeet, a top wireless solutions provider, launched Sentinel Insights, a cloud-based analytics tool enhancing its IoT management platform, Sentinel. The product ensures secure and reliable IoT solutions for businesses, schools, governments.

    In May 2020: Intel and SAS joined forces to enhance global analytics solutions, enabling rapid access to precise insights for users. This collaboration leverages advanced AI, machine learning, and IoT technologies.

    Objectives of the Study

    The objectives of the study are summarized in 5 stages. They are as mentioned below:

    Analytics of Things Market Forecast and Size

    To identify and estimate the market size for the analytics of things market report segmented by type, application, component, and vertical by value (in US dollars). Also, to understand the consumption/ demand created by consumers in the  analytics of things market forecast between 2022 and 2030

    Market Landscape and Trends:

    To identify and infer the drivers, restraints, opportunities, and challenges for the  analytics of things market growth

    Market Influencing Factors:

    To find out the factors which are affecting the  analytics of things market size among consumers

    Impact of COVID-19

    To identify and understand the various factors involved in the  market affected by the pandemic

    Company Profiling

    To provide a detailed market analysis of the major companies operating in the market. The profiling will include the financial health of the company's past 2-3 years with segmental and regional revenue breakup, product offering, recent developments, SWOT analysis, and key strategies.

    Intended Audience

      • Analytics of things Manufacturer
      • Raw Material Suppliers
      • Retailers, Wholesalers, and Distributors
      • Governments, Associations, and Industrial Bodies
      • Investors and Trade Experts

    Future Outlook

    Analytics of Things Market Future Outlook

    The Analytics of Things Market is projected to grow at a 27.57% CAGR from 2024 to 2035, driven by advancements in IoT, AI integration, and data analytics capabilities.

    New opportunities lie in:

    • Develop AI-driven analytics platforms for real-time data processing in smart cities.
    • Create tailored solutions for predictive maintenance in manufacturing sectors.
    • Leverage edge computing to enhance data processing speed and reduce latency in IoT devices.

    By 2035, the Analytics of Things Market is expected to achieve substantial growth, positioning itself as a cornerstone of digital transformation.

    Market Segmentation

    Type Outlook

    • Descriptive Analytics
    • Predictive Analytics
    • Prescriptive Analytics

    Region Outlook

    North America
    • US
    • Canada
    • Mexico

    Vertical Outlook

    • Telecommunications & IT
    • Manufacturing
    • Transportation & Logistics
    • Healthcare & Life Sciences
    • Retail & E-commerce
    • Government & Defense
    • Energy & Utilities
    • Others

    Component Outlook

    • Software
    • Services

    Application Outlook

    • Sales & Customer Management
    • Predictive Maintenance and Asset Management
    • Energy Management
    • Inventory Management
    • Security and Emergency Management
    • Building Automation
    • IT Infrastructure Management
    • Remote Monitoring
    • Others

    Report Scope

    Attribute/Metric Details
      Market Size   USD 120.4 Billion (2030)
      CAGR   33.40% (2030)
      Base Year   2021
      Forecast Period   2022-2030
      Historical Data   2018
      Forecast Units   Value (USD Billion)
      Report Coverage Revenue Forecast, Competitive Landscape, Growth Factors, and Trends
      Segments Covered Type, Application, Component, Vertical
      Geographies Covered North America, Europe, Asia-Pacific, and the Rest of the World (RoW)
      Key Vendors Amazon Web Services, Inc., Cisco Systems, Inc., Dell INC, Goolara, Hewlett Packard Enterprise Development LP, IBM Corporation, Microsoft, Oracle, Salesforce., SAP SE, Teradata Google, Inc., PTC, Hitachi, Ltd, Teradata, Salesforce, Greenwave Systems among other domestic and players
      Key Market Opportunities Rising number of connected devices
      Key Market Drivers The increasing reliance on big data management

    Market Highlights

    Author

    Ankit Gupta
    Senior Research Analyst

    She holds an experience of about 6+ years in market research and business consulting, working under the spectrum of information communication technology, telecommunications and semiconductor domains. aarti conceptualizes and implements a scalable business strategy and provides strategic leadership to the clients. her expertise lies in market estimation, competitive intelligence, pipeline analysis, customer assessment, etc.

    Leave a Comment

    Latest Comments

    John Doe
    john@example.com

    This is a great article! Really helped me understand the topic better.

    Posted on July 23, 2025, 10:15 AM
    Jane Smith
    jane@domain.com

    Thanks for sharing this. I’ve bookmarked it for later reference.

    Posted on July 22, 2025, 7:45 PM

    FAQs

    How big is the analytics of things market?

    The global analytics of things market will be valued at USD 120.4 billion by 2030.

    What is the analytics of things market growth rate?

    According to the analytics of things market research, the market is growing at a CAGR of 33.40% over the next 10 years.

    Which region has the highest market growth rate?

    Asia-Pacific is projected to register the highest CAGR during 2022 - 2030

    Which region has the largest share of the market?

    North America held the largest market share in 2021

    What is the expected analytics of things market size by 2030?

    The market size is expected to be USD 120.4 billion by 2030.

    Who are the key players in the market?

    Amazon Web Services, Inc., Cisco Systems, Inc., Dell INC, Goolara, Hewlett Packard Enterprise Development LP, IBM Corporation, Microsoft, Oracle, Salesforce., SAP SE, Teradata Google, Inc., PTC, Hitachi, Ltd, Teradata, Salesforce, Greenwave Systems among other domestic and players domestic and players are the prominent companies operating in the market.

    1. Table of Contents
    2.     Executive Summary
      1.     Market Attractiveness Analysis
        1.     Global Analytics of Things Market, by Type
        2.     Global Analytics of Things Market, by Application
        3.     Global Analytics of Things Market, by Component
        4.     Global Analytics of Things Market, by Vertical
        5.     Global Analytics of Things Market, by Region
    3.     Market Introduction
      1.     Definition
      2.     Scope of the Study
      3.     Market Structure
    4.     Research Methodology
      1.     Research Process
      2.     Primary Research
      3.     Secondary Research
      4.     Market Size Estimation
      5.     Forecast Application
      6.     List of Assumptions
    5.     MARKET DYNAMICS
      1.     Introduction
      2.     Drivers
        1.     Tremendous Growth of IoT data
        2.     Increasing Need for Advanced Analytics
      3.     Restraints
        1.     Concerns Regarding Data Security
      4.     Opportunities
        1.     Increasing Application Across Industry Verticals
      5.     Challenges
    6.     MARKET FACTOR ANALYSIS
      1.     Value Chain Analysis/Supply Chain Analysis
      2.     Porter’s Five Forces Application
        1.     Bargaining Power of Suppliers
        2.     Bargaining Power of Buyers
        3.     Threat of New Entrants
        4.     Threat of Substitutes
        5.     Intensity of Rivalry
    7.     GLOBAL ANALYTICS OF THINGS MARKET, BY TYPE 
      1.     Introduction
        1.     Descriptive Analytics
        2.     Predictive Analytics 
        3.     Prescriptive Analytics
    8.     GLOBAL ANALYTICS OF THINGS MARKET, BY APPLICATION 
      1.     Introduction
      2.     Sales and Customer Management
      3.     Predictive Maintenance and Asset Management
      4.     Energy Management 
      5.     Inventory Management
      6.     Security and Emergency Management 
      7.     Building Automation 
      8.     IT Infrastructure Management 
      9.     Remote Monitoring 
      10.     Others
    9.     GLOBAL ANALYTICS OF THINGS MARKET, BY COMPONENT 
      1.     Introduction
      2.     Software
      3.     Services
    10.     GLOBAL ANALYTICS OF THINGS MARKET, BY VERTICAL 
      1.     Introduction
      2.     Telecommunications and IT
      3.     Manufacturing
      4.     Transportation and Logistics
      5.     Healthcare and Life Sciences 
      6.     Retail and Ecommerce 
      7.     Government and Defense 
      8.     Energy and Utilities 
      9.     Others
    11.     GLOBAL ANALYTICS OF THINGS MARKET, BY REGION
      1.     Overview
      2.     North America
        1.     US
        2.     Canada
        3.     Mexico
      3.     Europe
        1.     Germany
        2.     UK
        3.     France
        4.     Rest of Europe
      4.     Asia-Pacific
        1.     China
        2.     Japan
        3.     India
        4.     Rest of Asia-Pacific
      5.     Middle East & Africa
      6.     South America
    12.     Competitive Landscape
      1.     Introduction
      2.     Competitive Benchmarking
      3.     Key Developments & Growth Strategies
      4.     Vendor Share Analysis
    13.     COMPANY PROFILES
      1.     Hewlett Packard Enterprise Company
        1.     Company Overview
        2.     Financial Overview
        3.     Products Offered
        4.     Key Developments
        5.     SWOT Analysis
        6.     Key Strategies
      2.     Cisco Systems, Inc.
        1.     Company Overview
        2.     Financial Overview
        3.     Products Offered
        4.     Key Developments
        5.     SWOT Analysis
        6.     Key Strategies
      3.     Dell Technologies, Inc.
        1.     Company Overview
        2.     Financial Overview
        3.     Products Offered
        4.     Key Developments
        5.     SWOT Analysis
        6.     Key Strategies
      4.     Google, Inc.
        1.     Company Overview
        2.     Financial Overview
        3.     Products Offered
        4.     Key Developments
        5.     SWOT Analysis
        6.     Key Strategies
      5.     Amazon Web Services
        1.     Company Overview
        2.     Financial Overview
        3.     Products Offered
        4.     Key Developments
        5.     SWOT Analysis
        6.     Key Strategies
      6.     Salesforce.com, Inc.
        1.     Company Overview
        2.     Financial Overview
        3.     Products Offered
        4.     Key Developments
        5.     SWOT Analysis
        6.     Key Strategies
      7.     Teradata Corporation
        1.     Company Overview
        2.     Financial Overview
        3.     Products Offered
        4.     Key Developments
        5.     SWOT Analysis
        6.     Key Strategies
      8.     IBM Corporation
        1.     Company Overview
        2.     Financial Overview
        3.     Products Offered
        4.     Key Developments
        5.     SWOT Analysis
        6.     Key Strategies
      9.     Microsoft Corporation
        1.     Company Overview
        2.     Financial Overview
        3.     Products Offered
        4.     Key Developments
        5.     SWOT Analysis
        6.     Key Strategies
      10.     Oracle Corporation
        1.     Company Overview
        2.     Financial Overview
        3.     Products Offered
        4.     Key Developments
        5.     SWOT Analysis
        6.     Key Strategies
      11.     Hitachi, Ltd.
        1.     Company Overview
        2.     Financial Overview
        3.     Products Offered
        4.     Key Developments
        5.     SWOT Analysis
        6.     Key Strategies
      12.     PTC
        1.     Company Overview
        2.     Financial Overview
        3.     Products Offered
        4.     Key Developments
        5.     SWOT Analysis
        6.     Key Strategies
      13.     Greenwave Systems
        1.     Company Overview
        2.     Financial Overview
        3.     Products Offered
        4.     Key Developments
        5.     SWOT Analysis
        6.     Key Strategies
      14.     MNUBO
        1.     Company Overview
        2.     Financial Overview
        3.     Products Offered
        4.     Key Developments
        5.     SWOT Analysis
        6.     Key Strategies 
    14. List of Tables and Figures
      1. List of Tables
      2. TABLE 1        LIST OF ASSUMPTIONS
      3. TABLE 2        GLOBAL ANALYTICS OF THINGS MARKET, BY TYPE, 2020–2027 (USD MILLION)
      4. TABLE 3        GLOBAL ANALYTICS OF THINGS MARKET, BY APPLICATION, 2020–2027 (USD MILLION)
      5. TABLE 4        GLOBAL ANALYTICS OF THINGS MARKET, BY COMPONENT, 2020–2027 (USD MILLION)
      6. TABLE 6        GLOBAL ANALYTICS OF THINGS MARKET, BY VERTICAL, 2020–2027 (USD MILLION)
      7. TABLE 7        GLOBAL ANALYTICS OF THINGS MARKET, BY REGION, 2020–2027 (USD MILLION)
      8. TABLE 8        NORTH AMERICA: ANALYTICS OF THINGS MARKET, BY COUNTRY, 2020–2027 (USD MILLION)
      9. TABLE 9        NORTH AMERICA: ANALYTICS OF THINGS MARKET, BY TYPE, 2020–2027 (USD MILLION)
      10. TABLE 10    NORTH AMERICA: ANALYTICS OF THINGS MARKET, BY APPLICATION, 2020–2027 (USD MILLION)
      11. TABLE 11    NORTH AMERICA: ANALYTICS OF THINGS MARKET, BY COMPONENT, 2020–2027 (USD MILLION)
      12. TABLE 13    NORTH AMERICA: ANALYTICS OF THINGS MARKET, BY VERTICAL, 2020–2027 (USD MILLION)
      13. TABLE 14    US: ANALYTICS OF THINGS MARKET, BY TYPE, 2020–2027 (USD MILLION)
      14. TABLE 15    US: ANALYTICS OF THINGS MARKET, BY APPLICATION, 2020–2027 (USD MILLION)
      15. TABLE 16    US: ANALYTICS OF THINGS MARKET, BY COMPONENT, 2020–2027 (USD MILLION)
      16. TABLE 18    US: ANALYTICS OF THINGS MARKET, BY VERTICAL, 2020–2027 (USD MILLION)
      17. TABLE 19    CANADA: ANALYTICS OF THINGS MARKET, BY TYPE, 2020–2027 (USD MILLION)
      18. TABLE 20    CANADA: ANALYTICS OF THINGS MARKET, BY APPLICATION, 2020–2027 (USD MILLION)
      19. TABLE 21    CANADA: ANALYTICS OF THINGS MARKET, BY COMPONENT, 2020–2027 (USD MILLION)
      20. TABLE 23    CANADA: ANALYTICS OF THINGS MARKET, BY VERTICAL, 2020–2027 (USD MILLION)
      21. TABLE 24    MEXICO: ANALYTICS OF THINGS MARKET, BY TYPE, 2020–2027 (MEXICOD MILLION)
      22. TABLE 25    MEXICO: ANALYTICS OF THINGS MARKET, BY APPLICATION, 2020–2027 (MEXICOD MILLION)
      23. TABLE 26    MEXICO: ANALYTICS OF THINGS MARKET, BY COMPONENT, 2020–2027 (MEXICOD MILLION)
      24. TABLE 28    MEXICO: ANALYTICS OF THINGS MARKET, BY VERTICAL, 2020–2027 (MEXICOD MILLION)
      25. TABLE 29    EUROPE: ANALYTICS OF THINGS MARKET, BY COUNTRY, 2020–2027 (USD MILLION)
      26. TABLE 30    EUROPE: ANALYTICS OF THINGS MARKET, BY TYPE, 2020–2027 (USD MILLION)
      27. TABLE 31    EUROPE: ANALYTICS OF THINGS MARKET, BY APPLICATION, 2020–2027 (USD MILLION)
      28. TABLE 32    EUROPE: ANALYTICS OF THINGS MARKET, BY COMPONENT, 2020–2027 (USD MILLION)
      29. TABLE 34    EUROPE: ANALYTICS OF THINGS MARKET, BY VERTICAL, 2020–2027 (USD MILLION)
      30. TABLE 35    UK: ANALYTICS OF THINGS MARKET, BY TYPE, 2020–2027 (USD MILLION)
      31. TABLE 36    UK: ANALYTICS OF THINGS MARKET, BY APPLICATION, 2020–2027 (USD MILLION)
      32. TABLE 37    UK: ANALYTICS OF THINGS MARKET, BY COMPONENT, 2020–2027 (USD MILLION)
      33. TABLE 39    UK: ANALYTICS OF THINGS MARKET, BY VERTICAL, 2020–2027 (USD MILLION)
      34. TABLE 40    GERMANY: ANALYTICS OF THINGS MARKET, BY TYPE, 2020–2027 (USD MILLION)
      35. TABLE 41    GERMANY: ANALYTICS OF THINGS MARKET, BY APPLICATION, 2020–2027 (USD MILLION)
      36. TABLE 42    GERMANY: ANALYTICS OF THINGS MARKET, BY COMPONENT, 2020–2027 (USD MILLION)
      37. TABLE 44    GERMANY: ANALYTICS OF THINGS MARKET, BY VERTICAL, 2020–2027 (USD MILLION)
      38. TABLE 45    FRANCE: ANALYTICS OF THINGS MARKET, BY TYPE, 2020–2027 (USD MILLION)
      39. TABLE 46    FRANCE: ANALYTICS OF THINGS MARKET, BY APPLICATION, 2020–2027 (USD MILLION)
      40. TABLE 47    FRANCE: ANALYTICS OF THINGS MARKET, BY COMPONENT, 2020–2027 (USD MILLION)
      41. TABLE 49    FRANCE: ANALYTICS OF THINGS MARKET, BY VERTICAL, 2020–2027 (USD MILLION)
      42. TABLE 50    REST OF EUROPE: ANALYTICS OF THINGS MARKET, BY TYPE, 2020–2027 (USD MILLION)
      43. TABLE 51    REST OF EUROPE: ANALYTICS OF THINGS MARKET, BY APPLICATION, 2020–2027 (USD MILLION)
      44. TABLE 52    REST OF EUROPE: ANALYTICS OF THINGS MARKET, BY COMPONENT, 2020–2027 (USD MILLION)
      45. TABLE 54    REST OF EUROPE: ANALYTICS OF THINGS MARKET, BY VERTICAL, 2020–2027 (USD MILLION)
      46. TABLE 55    ASIA-PACIFIC: ANALYTICS OF THINGS MARKET, BY COUNTRY, 2020–2027 (USD MILLION)
      47. TABLE 56    ASIA-PACIFIC: ANALYTICS OF THINGS MARKET, BY TYPE, 2020–2027 (USD MILLION)
      48. TABLE 57    ASIA-PACIFIC: ANALYTICS OF THINGS MARKET, BY APPLICATION, 2020–2027 (USD MILLION)
      49. TABLE 58    ASIA-PACIFIC: ANALYTICS OF THINGS MARKET, BY COMPONENT, 2020–2027 (USD MILLION)
      50. TABLE 60    ASIA-PACIFIC: ANALYTICS OF THINGS MARKET, BY VERTICAL, 2020–2027 (USD MILLION)
      51. TABLE 61    CHINA: ANALYTICS OF THINGS MARKET, BY TYPE, 2020–2027 (USD MILLION)
      52. TABLE 62    CHINA: ANALYTICS OF THINGS MARKET, BY APPLICATION, 2020–2027 (USD MILLION)
      53. TABLE 63    CHINA: ANALYTICS OF THINGS MARKET, BY COMPONENT, 2020–2027 (USD MILLION)
      54. TABLE 65    CHINA: ANALYTICS OF THINGS MARKET, BY VERTICAL, 2020–2027 (USD MILLION)
      55. TABLE 66    INDIA: ANALYTICS OF THINGS MARKET, BY TYPE, 2020–2027 (USD MILLION)
      56. TABLE 67    INDIA: ANALYTICS OF THINGS MARKET, BY APPLICATION, 2020–2027 (USD MILLION)
      57. TABLE 68    INDIA: ANALYTICS OF THINGS MARKET, BY COMPONENT, 2020–2027 (USD MILLION)
      58. TABLE 70    INDIA: ANALYTICS OF THINGS MARKET, BY VERTICAL, 2020–2027 (USD MILLION)
      59. TABLE 71    JAPAN: ANALYTICS OF THINGS MARKET, BY TYPE, 2020–2027 (USD MILLION)
      60. TABLE 72    JAPAN: ANALYTICS OF THINGS MARKET, BY APPLICATION, 2020–2027 (USD MILLION)
      61. TABLE 73    JAPAN: ANALYTICS OF THINGS MARKET, BY COMPONENT, 2020–2027 (USD MILLION)
      62. TABLE 75    JAPAN: ANALYTICS OF THINGS MARKET, BY VERTICAL, 2020–2027 (USD MILLION)
      63. TABLE 76    REST OF ASIA-PACIFIC: ANALYTICS OF THINGS MARKET, BY TYPE, 2020–2027 (USD MILLION)
      64. TABLE 77    REST OF ASIA-PACIFIC: ANALYTICS OF THINGS MARKET, BY APPLICATION, 2020–2027 (USD MILLION)
      65. TABLE 78    REST OF ASIA-PACIFIC: ANALYTICS OF THINGS MARKET, BY COMPONENT, 2020–2027 (USD MILLION)
      66. TABLE 80    REST OF ASIA-PACIFIC: ANALYTICS OF THINGS MARKET, BY VERTICAL, 2020–2027 (USD MILLION)
      67. TABLE 81    MIDDLE EAST & AFRICA: ANALYTICS OF THINGS MARKET, BY TYPE, 2020–2027 (USD MILLION)
      68. TABLE 82    MIDDLE EAST & AFRICA: ANALYTICS OF THINGS MARKET, BY APPLICATION, 2020–2027 (USD MILLION)
      69. TABLE 83    MIDDLE EAST & AFRICA: ANALYTICS OF THINGS MARKET, BY COMPONENT, 2020–2027 (USD MILLION)
      70. TABLE 85    MIDDLE EAST & AFRICA: ANALYTICS OF THINGS MARKET, BY VERTICAL, 2020–2027 (USD MILLION)
      71. TABLE 86    SOUTH AMERICA: ANALYTICS OF THINGS MARKET, BY TYPE, 2020–2027 (USD MILLION)
      72. TABLE 87    SOUTH AMERICA: ANALYTICS OF THINGS MARKET, BY APPLICATION, 2020–2027 (USD MILLION)
      73. TABLE 88    SOUTH AMERICA: ANALYTICS OF THINGS MARKET, BY COMPONENT, 2020–2027 (USD MILLION)
      74. TABLE 90    SOUTH AMERICA: ANALYTICS OF THINGS MARKET, BY VERTICAL, 2020–2027 (USD MILLION)     LIST OF FIGURES
      75. FIGURE 1    MARKET SYNOPSIS
      76. FIGURE 2    RESEARCH PROCESS OF MRFR
      77. FIGURE 3    TOP-DOWN AND Bottom-up Approach
      78. FIGURE 4    GLOBAL ANALYTICS OF THINGS MARKET, BY TYPE, 2020–2027 (USD MILLION)
      79. FIGURE 5    GLOBAL ANALYTICS OF THINGS MARKET, BY APPLICATION, 2020–2027 (USD MILLION)
      80. FIGURE 6    GLOBAL ANALYTICS OF THINGS MARKET, BY COMPONENT, 2020–2027 (USD MILLION)
      81. FIGURE 8    GLOBAL ANALYTICS OF THINGS MARKET, BY VERTICAL, 2020–2027 (USD MILLION)
      82. FIGURE 9    GLOBAL ANALYTICS OF THINGS MARKET, BY REGION, 2020–2027 (USD MILLION)
      83. FIGURE 10    GLOBAL ANALYTICS OF THINGS MARKET, BY REGION, 2020–2027 (USD MILLION)
      84. FIGURE 11    NORTH AMERICA: ANALYTICS OF THINGS MARKET, BY COUNTRY, 2020–2027 (USD MILLION)
      85. FIGURE 12    NORTH AMERICA: ANALYTICS OF THINGS MARKET, BY TYPE, 2020–2027 (USD MILLION)
      86. FIGURE 13    NORTH AMERICA: ANALYTICS OF THINGS MARKET, BY APPLICATION, 2020–2027 (USD MILLION)
      87. FIGURE 14    NORTH AMERICA: ANALYTICS OF THINGS MARKET, BY COMPONENT, 2020–2027 (USD MILLION)
      88. FIGURE 16    NORTH AMERICA: ANALYTICS OF THINGS MARKET, BY VERTICAL, 2020–2027 (USD MILLION)
      89. FIGURE 17    EUROPE: ANALYTICS OF THINGS MARKET, BY COUNTRY, 2020–2027 (USD MILLION)
      90. FIGURE 18    EUROPE: ANALYTICS OF THINGS MARKET, BY TYPE, 2020–2027 (USD MILLION)
      91. FIGURE 19    EUROPE: ANALYTICS OF THINGS MARKET, BY APPLICATION, 2020–2027 (USD MILLION)
      92. FIGURE 20    EUROPE: ANALYTICS OF THINGS MARKET, BY COMPONENT, 2020–2027 (USD MILLION)
      93. FIGURE 22    EUROPE: ANALYTICS OF THINGS MARKET, BY VERTICAL, 2020–2027 (USD MILLION)
      94. FIGURE 23    ASIA-PACIFIC: ANALYTICS OF THINGS MARKET, BY COUNTRY, 2020–2027 (USD MILLION)
      95. FIGURE 24    ASIA-PACIFIC: ANALYTICS OF THINGS MARKET, BY TYPE, 2020–2027 (USD MILLION)
      96. FIGURE 25    ASIA-PACIFIC: ANALYTICS OF THINGS MARKET, BY APPLICATION, 2020–2027 (USD MILLION)
      97. FIGURE 26    ASIA-PACIFIC: ANALYTICS OF THINGS MARKET, BY COMPONENT, 2020–2027 (USD MILLION)
      98. FIGURE 28    ASIA-PACIFIC: ANALYTICS OF THINGS MARKET, BY VERTICAL, 2020–2027 (USD MILLION)
      99. FIGURE 29    MIDDLE EAST & AFRICA: ANALYTICS OF THINGS MARKET, BY TYPE, 2020–2027 (USD MILLION)
      100. FIGURE 30    MIDDLE EAST & AFRICA: ANALYTICS OF THINGS MARKET, BY APPLICATION, 2020–2027 (USD MILLION)
      101. FIGURE 31    MIDDLE EAST & AFRICA: ANALYTICS OF THINGS MARKET, BY COMPONENT, 2020–2027 (USD MILLION)
      102. FIGURE 33    MIDDLE EAST & AFRICA: ANALYTICS OF THINGS MARKET, BY VERTICAL, 2020–2027 (USD MILLION)
      103. FIGURE 34    SOUTH AMERICA: ANALYTICS OF THINGS MARKET, BY TYPE, 2020–2027 (USD MILLION)
      104. FIGURE 35    SOUTH AMERICA: ANALYTICS OF THINGS MARKET, BY APPLICATION, 2020–2027 (USD MILLION)
      105. FIGURE 36    SOUTH AMERICA: ANALYTICS OF THINGS MARKET, BY COMPONENT, 2020–2027 (USD MILLION)
      106. FIGURE 38    SOUTH AMERICA: ANALYTICS OF THINGS MARKET, BY VERTICAL, 2020–2027 (USD MILLION)

    Analytics of Things Market Segmentation

    Market Segmentation Overview

    • Detailed segmentation data will be available in the full report
    • Comprehensive analysis by multiple parameters
    • Regional and country-level breakdowns
    • Market size forecasts by segment
    Infographic

    Free Sample Request

    Kindly complete the form below to receive a free sample of this Report

    Get Free Sample

    Customer Strories

    “I am very pleased with how market segments have been defined in a relevant way for my purposes (such as "Portable Freezers & refrigerators" and "last-mile"). In general the report is well structured. Thanks very much for your efforts.”

    Victoria Milne

    Founder
    Case Study
    Chemicals and Materials