Request Free Sample ×

Kindly complete the form below to receive a free sample of this Report

* Please use a valid business email

Leading companies partner with us for data-driven Insights

clients tt-cursor
Hero Background

Vertriebskraftautomatisierungsmarkt

ID: MRFR/ICT/2759-HCR
100 Pages
Ankit Gupta
Last Updated: April 06, 2026

Marktforschungsbericht zur Vertriebsautomatisierung Informationen nach Software (Die Software On-Premise Vertriebsautomatisierungssystem, Software-as-a-Service (SaaS) Vertriebsautomatisierungssystem, Cloud-basiertes Vertriebsautomatisierungssystem), nach Organisationstyp (Klein- und Mittelstandsunternehmen, Großunternehmen) und nach Region (Nordamerika, Europa, Asien-Pazifik und Rest der Welt) – Marktforschung bis 2035.

Teilen
Download PDF ×

We do not share your information with anyone. However, we may send you emails based on your report interest from time to time. You may contact us at any time to opt-out.

Sales Force Automation Market Infographic
Purchase Options
  1. 1 ABSCHNITT I: ZUSAMMENFASSUNG UND WICHTIGE HIGHLIGHTS
    1. 1.1 ZUSAMMENFASSUNG
      1. 1.1.1 Marktübersicht
      2. 1.1.2 Wichtige Ergebnisse
      3. 1.1.3 Marktsegmentierung
      4. 1.1.4 Wettbewerbslandschaft
      5. 1.1.5 Herausforderungen und Chancen
      6. 1.1.6 Zukünftige Aussichten
  2. 2 ABSCHNITT II: ABGRENZUNG, METHODOLOGIE UND MARKTSTRUKTUR
    1. 2.1 MARKTEINFÜHRUNG
      1. 2.1.1 Definition
      2. 2.1.2 Umfang der Studie
        1. 2.1.2.1 Forschungsziel
        2. 2.1.2.2 Annahme
        3. 2.1.2.3 Einschränkungen
    2. 2.2 FORSCHUNGSMETHODOLOGIE
      1. 2.2.1 Überblick
      2. 2.2.2 Datenanalyse
      3. 2.2.3 Sekundärforschung
      4. 2.2.4 Primärforschung
        1. 2.2.4.1 Primärinterviews und Informationssammlungsprozess
        2. 2.2.4.2 Aufschlüsselung der primären Befragten
      5. 2.2.5 Prognosemodell
      6. 2.2.6 Marktschätzung
        1. 2.2.6.1 Bottom-Up-Ansatz
        2. 2.2.6.2 Top-Down-Ansatz
      7. 2.2.7 Daten-Triangulation
      8. 2.2.8 Validierung
  3. 3 ABSCHNITT III: QUALITATIVE ANALYSE
    1. 3.1 MARKTDYNAMIK
      1. 3.1.1 Überblick
      2. 3.1.2 Treiber
      3. 3.1.3 Einschränkungen
      4. 3.1.4 Chancen
    2. 3.2 MARKTFACHT ANALYSE
      1. 3.2.1 Wertschöpfungskettenanalyse
      2. 3.2.2 Porters Fünf Kräfte Analyse
        1. 3.2.2.1 Verhandlungsmacht der Lieferanten
        2. 3.2.2.2 Verhandlungsmacht der Käufer
        3. 3.2.2.3 Bedrohung durch neue Anbieter
        4. 3.2.2.4 Bedrohung durch Substitute
        5. 3.2.2.5 Intensität der Rivalität
      3. 3.2.3 COVID-19 Auswirkungen Analyse
        1. 3.2.3.1 Markt Auswirkungen Analyse
        2. 3.2.3.2 Regionale Auswirkungen
        3. 3.2.3.3 Chancen- und Bedrohungsanalyse
  4. 4 ABSCHNITT IV: QUANTITATIVE ANALYSE
    1. 4.1 Informations- und Kommunikationstechnologie, NACH Software (Milliarden USD)
      1. 4.1.1 On-Premises Salesforce-Automatisierungssystem
      2. 4.1.2 Software-as-a-Service (SaaS) Salesforce-Automatisierungssystem
      3. 4.1.3 Cloud-basiertes Salesforce-Automatisierungssystem
    2. 4.2 Informations- und Kommunikationstechnologie, NACH Organisationstyp (Milliarden USD)
      1. 4.2.1 Klein- und Mittelstandsunternehmen
      2. 4.2.2 Großunternehmen
    3. 4.3 Informations- und Kommunikationstechnologie, NACH Region (Milliarden USD)
      1. 4.3.1 Nordamerika
        1. 4.3.1.1 USA
        2. 4.3.1.2 Kanada
      2. 4.3.2 Europa
        1. 4.3.2.1 Deutschland
        2. 4.3.2.2 UK
        3. 4.3.2.3 Frankreich
        4. 4.3.2.4 Russland
        5. 4.3.2.5 Italien
        6. 4.3.2.6 Spanien
        7. 4.3.2.7 Rest von Europa
      3. 4.3.3 APAC
        1. 4.3.3.1 China
        2. 4.3.3.2 Indien
        3. 4.3.3.3 Japan
        4. 4.3.3.4 Südkorea
        5. 4.3.3.5 Malaysia
        6. 4.3.3.6 Thailand
        7. 4.3.3.7 Indonesien
        8. 4.3.3.8 Rest von APAC
      4. 4.3.4 Südamerika
        1. 4.3.4.1 Brasilien
        2. 4.3.4.2 Mexiko
        3. 4.3.4.3 Argentinien
        4. 4.3.4.4 Rest von Südamerika
      5. 4.3.5 MEA
        1. 4.3.5.1 GCC-Länder
        2. 4.3.5.2 Südafrika
        3. 4.3.5.3 Rest von MEA
  5. 5 ABSCHNITT V: WETTBEWERBSANALYSE
    1. 5.1 Wettbewerbslandschaft
      1. 5.1.1 Überblick
      2. 5.1.2 Wettbewerbsanalyse
      3. 5.1.3 Marktanteilsanalyse
      4. 5.1.4 Hauptwachstumsstrategie in der Informations- und Kommunikationstechnologie
      5. 5.1.5 Wettbewerbsbenchmarking
      6. 5.1.6 Führende Akteure in Bezug auf die Anzahl der Entwicklungen in der Informations- und Kommunikationstechnologie
      7. 5.1.7 Wichtige Entwicklungen und Wachstumsstrategien
        1. 5.1.7.1 Neue Produkteinführungen/Dienstleistungsbereitstellungen
        2. 5.1.7.2 Fusionen & Übernahmen
        3. 5.1.7.3 Joint Ventures
      8. 5.1.8 Finanzmatrix der Hauptakteure
        1. 5.1.8.1 Umsatz und Betriebseinkommen
        2. 5.1.8.2 F&E-Ausgaben der Hauptakteure. 2023
    2. 5.2 Unternehmensprofile
      1. 5.2.1 Salesforce (USA)
        1. 5.2.1.1 Finanzübersicht
        2. 5.2.1.2 Angebotene Produkte
        3. 5.2.1.3 Wichtige Entwicklungen
        4. 5.2.1.4 SWOT-Analyse
        5. 5.2.1.5 Schlüsselstrategien
      2. 5.2.2 Microsoft (USA)
        1. 5.2.2.1 Finanzübersicht
        2. 5.2.2.2 Angebotene Produkte
        3. 5.2.2.3 Wichtige Entwicklungen
        4. 5.2.2.4 SWOT-Analyse
        5. 5.2.2.5 Schlüsselstrategien
      3. 5.2.3 Oracle (USA)
        1. 5.2.3.1 Finanzübersicht
        2. 5.2.3.2 Angebotene Produkte
        3. 5.2.3.3 Wichtige Entwicklungen
        4. 5.2.3.4 SWOT-Analyse
        5. 5.2.3.5 Schlüsselstrategien
      4. 5.2.4 SAP (DE)
        1. 5.2.4.1 Finanzübersicht
        2. 5.2.4.2 Angebotene Produkte
        3. 5.2.4.3 Wichtige Entwicklungen
        4. 5.2.4.4 SWOT-Analyse
        5. 5.2.4.5 Schlüsselstrategien
      5. 5.2.5 HubSpot (USA)
        1. 5.2.5.1 Finanzübersicht
        2. 5.2.5.2 Angebotene Produkte
        3. 5.2.5.3 Wichtige Entwicklungen
        4. 5.2.5.4 SWOT-Analyse
        5. 5.2.5.5 Schlüsselstrategien
      6. 5.2.6 Zoho (IN)
        1. 5.2.6.1 Finanzübersicht
        2. 5.2.6.2 Angebotene Produkte
        3. 5.2.6.3 Wichtige Entwicklungen
        4. 5.2.6.4 SWOT-Analyse
        5. 5.2.6.5 Schlüsselstrategien
      7. 5.2.7 Pipedrive (EE)
        1. 5.2.7.1 Finanzübersicht
        2. 5.2.7.2 Angebotene Produkte
        3. 5.2.7.3 Wichtige Entwicklungen
        4. 5.2.7.4 SWOT-Analyse
        5. 5.2.7.5 Schlüsselstrategien
      8. 5.2.8 Freshworks (IN)
        1. 5.2.8.1 Finanzübersicht
        2. 5.2.8.2 Angebotene Produkte
        3. 5.2.8.3 Wichtige Entwicklungen
        4. 5.2.8.4 SWOT-Analyse
        5. 5.2.8.5 Schlüsselstrategien
      9. 5.2.9 SugarCRM (USA)
        1. 5.2.9.1 Finanzübersicht
        2. 5.2.9.2 Angebotene Produkte
        3. 5.2.9.3 Wichtige Entwicklungen
        4. 5.2.9.4 SWOT-Analyse
        5. 5.2.9.5 Schlüsselstrategien
    3. 5.3 Anhang
      1. 5.3.1 Referenzen
      2. 5.3.2 Verwandte Berichte
  6. 6 LISTE DER ABBILDUNGEN
    1. 6.1 MARKTSYNOPSIS
    2. 6.2 NORDAMERIKA MARKTANALYSE
    3. 6.3 USA MARKTANALYSE NACH SOFTWARE
    4. 6.4 USA MARKTANALYSE NACH ORGANISATIONSTYP
    5. 6.5 KANADA MARKTANALYSE NACH SOFTWARE
    6. 6.6 KANADA MARKTANALYSE NACH ORGANISATIONSTYP
    7. 6.7 EUROPA MARKTANALYSE
    8. 6.8 DEUTSCHLAND MARKTANALYSE NACH SOFTWARE
    9. 6.9 DEUTSCHLAND MARKTANALYSE NACH ORGANISATIONSTYP
    10. 6.10 UK MARKTANALYSE NACH SOFTWARE
    11. 6.11 UK MARKTANALYSE NACH ORGANISATIONSTYP
    12. 6.12 FRANKREICH MARKTANALYSE NACH SOFTWARE
    13. 6.13 FRANKREICH MARKTANALYSE NACH ORGANISATIONSTYP
    14. 6.14 RUSSLAND MARKTANALYSE NACH SOFTWARE
    15. 6.15 RUSSLAND MARKTANALYSE NACH ORGANISATIONSTYP
    16. 6.16 ITALIEN MARKTANALYSE NACH SOFTWARE
    17. 6.17 ITALIEN MARKTANALYSE NACH ORGANISATIONSTYP
    18. 6.18 SPANIEN MARKTANALYSE NACH SOFTWARE
    19. 6.19 SPANIEN MARKTANALYSE NACH ORGANISATIONSTYP
    20. 6.20 REST VON EUROPA MARKTANALYSE NACH SOFTWARE
    21. 6.21 REST VON EUROPA MARKTANALYSE NACH ORGANISATIONSTYP
    22. 6.22 APAC MARKTANALYSE
    23. 6.23 CHINA MARKTANALYSE NACH SOFTWARE
    24. 6.24 CHINA MARKTANALYSE NACH ORGANISATIONSTYP
    25. 6.25 INDIEN MARKTANALYSE NACH SOFTWARE
    26. 6.26 INDIEN MARKTANALYSE NACH ORGANISATIONSTYP
    27. 6.27 JAPAN MARKTANALYSE NACH SOFTWARE
    28. 6.28 JAPAN MARKTANALYSE NACH ORGANISATIONSTYP
    29. 6.29 SÜDKOREA MARKTANALYSE NACH SOFTWARE
    30. 6.30 SÜDKOREA MARKTANALYSE NACH ORGANISATIONSTYP
    31. 6.31 MALAYSIA MARKTANALYSE NACH SOFTWARE
    32. 6.32 MALAYSIA MARKTANALYSE NACH ORGANISATIONSTYP
    33. 6.33 THAILAND MARKTANALYSE NACH SOFTWARE
    34. 6.34 THAILAND MARKTANALYSE NACH ORGANISATIONSTYP
    35. 6.35 INDONESIEN MARKTANALYSE NACH SOFTWARE
    36. 6.36 INDONESIEN MARKTANALYSE NACH ORGANISATIONSTYP
    37. 6.37 REST VON APAC MARKTANALYSE NACH SOFTWARE
    38. 6.38 REST VON APAC MARKTANALYSE NACH ORGANISATIONSTYP
    39. 6.39 SÜDAMERIKA MARKTANALYSE
    40. 6.40 BRASILIEN MARKTANALYSE NACH SOFTWARE
    41. 6.41 BRASILIEN MARKTANALYSE NACH ORGANISATIONSTYP
    42. 6.42 MEXIKO MARKTANALYSE NACH SOFTWARE
    43. 6.43 MEXIKO MARKTANALYSE NACH ORGANISATIONSTYP
    44. 6.44 ARGENTINIEN MARKTANALYSE NACH SOFTWARE
    45. 6.45 ARGENTINIEN MARKTANALYSE NACH ORGANISATIONSTYP
    46. 6.46 REST VON SÜDAMERIKA MARKTANALYSE NACH SOFTWARE
    47. 6.47 REST VON SÜDAMERIKA MARKTANALYSE NACH ORGANISATIONSTYP
    48. 6.48 MEA MARKTANALYSE
    49. 6.49 GCC-LÄNDER MARKTANALYSE NACH SOFTWARE
    50. 6.50 GCC-LÄNDER MARKTANALYSE NACH ORGANISATIONSTYP
    51. 6.51 SÜDAFRIKA MARKTANALYSE NACH SOFTWARE
    52. 6.52 SÜDAFRIKA MARKTANALYSE NACH ORGANISATIONSTYP
    53. 6.53 REST VON MEA MARKTANALYSE NACH SOFTWARE
    54. 6.54 REST VON MEA MARKTANALYSE NACH ORGANISATIONSTYP
    55. 6.55 WICHTIGE KAUFKRITERIEN DER INFORMATIONEN UND KOMMUNIKATIONSTECHNOLOGIE
    56. 6.56 FORSCHUNGSPROZESS VON MRFR
    57. 6.57 DRO ANALYSE DER INFORMATIONEN UND KOMMUNIKATIONSTECHNOLOGIE
    58. 6.58 TREIBERWIRKUNGSANALYSE: INFORMATIONEN UND KOMMUNIKATIONSTECHNOLOGIE
    59. 6.59 EINSCHRÄNKUNGENWIRKUNGSANALYSE: INFORMATIONEN UND KOMMUNIKATIONSTECHNOLOGIE
    60. 6.60 LIEFER-/WERTSCHÖPFUNGSKETTE: INFORMATIONEN UND KOMMUNIKATIONSTECHNOLOGIE
    61. 6.61 INFORMATIONEN UND KOMMUNIKATIONSTECHNOLOGIE, NACH SOFTWARE, 2024 (% ANTEIL)
    62. 6.62 INFORMATIONEN UND KOMMUNIKATIONSTECHNOLOGIE, NACH SOFTWARE, 2024 BIS 2035 (Milliarden USD)
    63. 6.63 INFORMATIONEN UND KOMMUNIKATIONSTECHNOLOGIE, NACH ORGANISATIONSTYP, 2024 (% ANTEIL)
    64. 6.64 INFORMATIONEN UND KOMMUNIKATIONSTECHNOLOGIE, NACH ORGANISATIONSTYP, 2024 BIS 2035 (Milliarden USD)
    65. 6.65 BENCHMARKING DER HAUPTWETTBEWERBER
  7. 7 LISTE DER TABELLEN
    1. 7.1 LISTE DER ANNAHMEN
    2. 7.2 NORDAMERIKA MARKTGRÖSSENSCHÄTZUNGEN; PROGNOSE
      1. 7.2.1 NACH SOFTWARE, 2025-2035 (Milliarden USD)
      2. 7.2.2 NACH ORGANISATIONSTYP, 2025-2035 (Milliarden USD)
    3. 7.3 USA MARKTGRÖSSENSCHÄTZUNGEN; PROGNOSE
      1. 7.3.1 NACH SOFTWARE, 2025-2035 (Milliarden USD)
      2. 7.3.2 NACH ORGANISATIONSTYP, 2025-2035 (Milliarden USD)
    4. 7.4 KANADA MARKTGRÖSSENSCHÄTZUNGEN; PROGNOSE
      1. 7.4.1 NACH SOFTWARE, 2025-2035 (Milliarden USD)
      2. 7.4.2 NACH ORGANISATIONSTYP, 2025-2035 (Milliarden USD)
    5. 7.5 EUROPA MARKTGRÖSSENSCHÄTZUNGEN; PROGNOSE
      1. 7.5.1 NACH SOFTWARE, 2025-2035 (Milliarden USD)
      2. 7.5.2 NACH ORGANISATIONSTYP, 2025-2035 (Milliarden USD)
    6. 7.6 DEUTSCHLAND MARKTGRÖSSENSCHÄTZUNGEN; PROGNOSE
      1. 7.6.1 NACH SOFTWARE, 2025-2035 (Milliarden USD)
      2. 7.6.2 NACH ORGANISATIONSTYP, 2025-2035 (Milliarden USD)
    7. 7.7 UK MARKTGRÖSSENSCHÄTZUNGEN; PROGNOSE
      1. 7.7.1 NACH SOFTWARE, 2025-2035 (Milliarden USD)
      2. 7.7.2 NACH ORGANISATIONSTYP, 2025-2035 (Milliarden USD)
    8. 7.8 FRANKREICH MARKTGRÖSSENSCHÄTZUNGEN; PROGNOSE
      1. 7.8.1 NACH SOFTWARE, 2025-2035 (Milliarden USD)
      2. 7.8.2 NACH ORGANISATIONSTYP, 2025-2035 (Milliarden USD)
    9. 7.9 RUSSLAND MARKTGRÖSSENSCHÄTZUNGEN; PROGNOSE
      1. 7.9.1 NACH SOFTWARE, 2025-2035 (Milliarden USD)
      2. 7.9.2 NACH ORGANISATIONSTYP, 2025-2035 (Milliarden USD)
    10. 7.10 ITALIEN MARKTGRÖSSENSCHÄTZUNGEN; PROGNOSE
      1. 7.10.1 NACH SOFTWARE, 2025-2035 (Milliarden USD)
      2. 7.10.2 NACH ORGANISATIONSTYP, 2025-2035 (Milliarden USD)
    11. 7.11 SPANIEN MARKTGRÖSSENSCHÄTZUNGEN; PROGNOSE
      1. 7.11.1 NACH SOFTWARE, 2025-2035 (Milliarden USD)
      2. 7.11.2 NACH ORGANISATIONSTYP, 2025-2035 (Milliarden USD)
    12. 7.12 REST VON EUROPA MARKTGRÖSSENSCHÄTZUNGEN; PROGNOSE
      1. 7.12.1 NACH SOFTWARE, 2025-2035 (Milliarden USD)
      2. 7.12.2 NACH ORGANISATIONSTYP, 2025-2035 (Milliarden USD)
    13. 7.13 APAC MARKTGRÖSSENSCHÄTZUNGEN; PROGNOSE
      1. 7.13.1 NACH SOFTWARE, 2025-2035 (Milliarden USD)
      2. 7.13.2 NACH ORGANISATIONSTYP, 2025-2035 (Milliarden USD)
    14. 7.14 CHINA MARKTGRÖSSENSCHÄTZUNGEN; PROGNOSE
      1. 7.14.1 NACH SOFTWARE, 2025-2035 (Milliarden USD)
      2. 7.14.2 NACH ORGANISATIONSTYP, 2025-2035 (Milliarden USD)
    15. 7.15 INDIEN MARKTGRÖSSENSCHÄTZUNGEN; PROGNOSE
      1. 7.15.1 NACH SOFTWARE, 2025-2035 (Milliarden USD)
      2. 7.15.2 NACH ORGANISATIONSTYP, 2025-2035 (Milliarden USD)
    16. 7.16 JAPAN MARKTGRÖSSENSCHÄTZUNGEN; PROGNOSE
      1. 7.16.1 NACH SOFTWARE, 2025-2035 (Milliarden USD)
      2. 7.16.2 NACH ORGANISATIONSTYP, 2025-2035 (Milliarden USD)
    17. 7.17 SÜDKOREA MARKTGRÖSSENSCHÄTZUNGEN; PROGNOSE
      1. 7.17.1 NACH SOFTWARE, 2025-2035 (Milliarden USD)
      2. 7.17.2 NACH ORGANISATIONSTYP, 2025-2035 (Milliarden USD)
    18. 7.18 MALAYSIA MARKTGRÖSSENSCHÄTZUNGEN; PROGNOSE
      1. 7.18.1 NACH SOFTWARE, 2025-2035 (Milliarden USD)
      2. 7.18.2 NACH ORGANISATIONSTYP, 2025-2035 (Milliarden USD)
    19. 7.19 THAILAND MARKTGRÖSSENSCHÄTZUNGEN; PROGNOSE
      1. 7.19.1 NACH SOFTWARE, 2025-2035 (Milliarden USD)
      2. 7.19.2 NACH ORGANISATIONSTYP, 2025-2035 (Milliarden USD)
    20. 7.20 INDONESIEN MARKTGRÖSSENSCHÄTZUNGEN; PROGNOSE
      1. 7.20.1 NACH SOFTWARE, 2025-2035 (Milliarden USD)
      2. 7.20.2 NACH ORGANISATIONSTYP, 2025-2035 (Milliarden USD)
    21. 7.21 REST VON APAC MARKTGRÖSSENSCHÄTZUNGEN; PROGNOSE
      1. 7.21.1 NACH SOFTWARE, 2025-2035 (Milliarden USD)
      2. 7.21.2 NACH ORGANISATIONSTYP, 2025-2035 (Milliarden USD)
    22. 7.22 SÜDAMERIKA MARKTGRÖSSENSCHÄTZUNGEN; PROGNOSE
      1. 7.22.1 NACH SOFTWARE, 2025-2035 (Milliarden USD)
      2. 7.22.2 NACH ORGANISATIONSTYP, 2025-2035 (Milliarden USD)
    23. 7.23 BRASILIEN MARKTGRÖSSENSCHÄTZUNGEN; PROGNOSE
      1. 7.23.1 NACH SOFTWARE, 2025-2035 (Milliarden USD)
      2. 7.23.2 NACH ORGANISATIONSTYP, 2025-2035 (Milliarden USD)
    24. 7.24 MEXIKO MARKTGRÖSSENSCHÄTZUNGEN; PROGNOSE
      1. 7.24.1 NACH SOFTWARE, 2025-2035 (Milliarden USD)
      2. 7.24.2 NACH ORGANISATIONSTYP, 2025-2035 (Milliarden USD)
    25. 7.25 ARGENTINIEN MARKTGRÖSSENSCHÄTZUNGEN; PROGNOSE
      1. 7.25.1 NACH SOFTWARE, 2025-2035 (Milliarden USD)
      2. 7.25.2 NACH ORGANISATIONSTYP, 2025-2035 (Milliarden USD)
    26. 7.26 REST VON SÜDAMERIKA MARKTGRÖSSENSCHÄTZUNGEN; PROGNOSE
      1. 7.26.1 NACH SOFTWARE, 2025-2035 (Milliarden USD)
      2. 7.26.2 NACH ORGANISATIONSTYP, 2025-2035 (Milliarden USD)
    27. 7.27 MEA MARKTGRÖSSENSCHÄTZUNGEN; PROGNOSE
      1. 7.27.1 NACH SOFTWARE, 2025-2035 (Milliarden USD)
      2. 7.27.2 NACH ORGANISATIONSTYP, 2025-2035 (Milliarden USD)
    28. 7.28 GCC-LÄNDER MARKTGRÖSSENSCHÄTZUNGEN; PROGNOSE
      1. 7.28.1 NACH SOFTWARE, 2025-2035 (Milliarden USD)
      2. 7.28.2 NACH ORGANISATIONSTYP, 2025-2035 (Milliarden USD)
    29. 7.29 SÜDAFRIKA MARKTGRÖSSENSCHÄTZUNGEN; PROGNOSE
      1. 7.29.1 NACH SOFTWARE, 2025-2035 (Milliarden USD)
      2. 7.29.2 NACH ORGANISATIONSTYP, 2025-2035 (Milliarden USD)
    30. 7.30 REST VON MEA MARKTGRÖSSENSCHÄTZUNGEN; PROGNOSE
      1. 7.30.1 NACH SOFTWARE, 2025-2035 (Milliarden USD)
      2. 7.30.2 NACH ORGANISATIONSTYP, 2025-2035 (Milliarden USD)
    31. 7.31 PRODUKTEINFÜHRUNG/PRODUKTENTWICKLUNG/GENEHMIGUNG
    32. 7.32 AKQUISITION/PARTNERSCHAFT

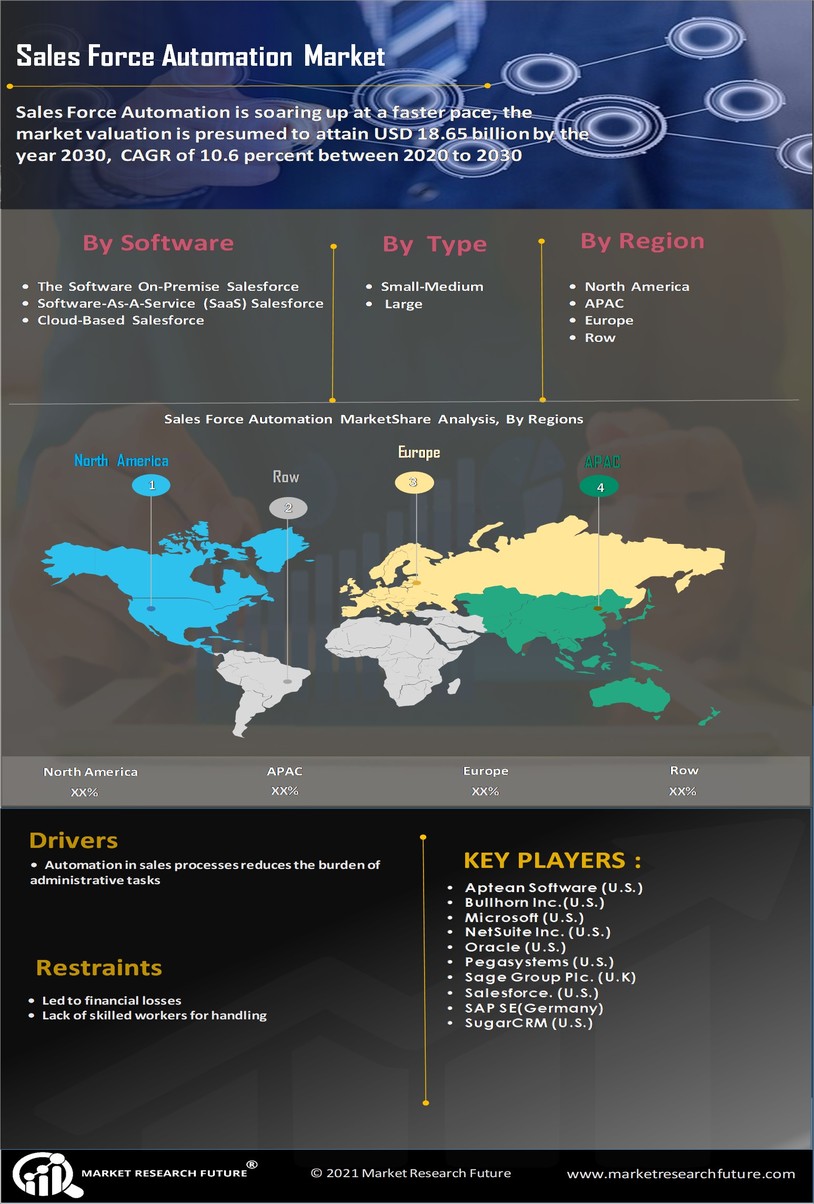
Sales Force Automation SoftwareMarktsegmentierung

Ausblick für Sales Force Automation Software (Mrd. USD, 2018–2032)

  • Das On-Premises-Salesforce-Automatisierungssystem

  • Software-as-a-Service (SaaS)-Salesforce-Automatisierungssystem

  • Cloudbasiertes Salesforce-Automatisierungssystem

Ausblick für die Organisationstypen der Sales Force Automation (Mrd. USD, 2018–2032)

  • Kleine und mittlere Unternehmen

  • Großunternehmen

Regionaler Ausblick für Sales Force Automation (Mrd. USD, 2018-2032)

  • Ausblick Nordamerika (Mrd. USD, 2018–2032)

    • Vertriebsautomatisierung in Nordamerika durch Software

      • Das On-Premises-Salesforce-Automatisierungssystem

      • Software-as-a-Service (SaaS)-Salesforce-Automatisierungssystem

      • Cloudbasiertes Salesforce-Automatisierungssystem

    • Vertriebsautomatisierung in Nordamerika nach Organisationstyp

      • Kleine und mittlere Unternehmen

      • Große Unternehmen

    • US-Ausblick(Mrd. USD, 2018–2032)

    • US-Vertriebsautomatisierung durch Software

      • Das On-Premises-Salesforce-Automatisierungssystem

      • Software-as-a-Service (SaaS)-Salesforce-Automatisierungssystem

      • Cloudbasiertes Salesforce-Automatisierungssystem

    • US-Vertriebsautomatisierung nach Organisationstyp

      • Kleine und mittlere Unternehmen

      • Große Unternehmen

    • Kanada Ausblick (Mrd. USD, 2018–2032)

    • Vertriebsautomatisierung in Kanada durch Software

      • Das On-Premises-Salesforce-Automatisierungssystem

      • Software-as-a-Service (SaaS)-Salesforce-Automatisierungssystem

      • Cloudbasiertes Salesforce-Automatisierungssystem

    • Vertriebsautomatisierung in Kanada nach Organisationstyp

      • Kleine und mittlere Unternehmen

      • Große Unternehmen

  • Ausblick Europa (Mrd. USD, 2018–2032)

    • Vertriebsautomatisierung in Europa durch Software

      • Das On-Premises-Salesforce-Automatisierungssystem

      • Software-as-a-Service (SaaS)-Salesforce-Automatisierungssystem

      • Cloudbasiertes Salesforce-Automatisierungssystem

    • Vertriebsautomatisierung in Europa nach Organisationstyp

      • Kleine und mittlere Unternehmen

      • Große Unternehmen

    • Deutschland Ausblick (Mrd. USD, 2018–2032)

    • Vertriebsautomatisierung in Deutschland durch Software

      • Das On-Premises-Salesforce-Automatisierungssystem

      • Software-as-a-Service (SaaS)-Salesforce-Automatisierungssystem

      • Cloudbasiertes Salesforce-Automatisierungssystem

    • Vertriebsautomatisierung in Deutschland nach Organisationstyp

      • Kleine und mittlere Unternehmen

      • Große Unternehmen

    • Ausblick für Frankreich (Mrd. USD, 2018–2032)

    • Vertriebsautomatisierung in Frankreich durch Software

      • Das On-Premises-Salesforce-Automatisierungssystem

      • Software-as-a-Service (SaaS)-Salesforce-Automatisierungssystem

      • Cloudbasiertes Salesforce-Automatisierungssystem

    • Vertriebsautomatisierung in Frankreich nach Organisationstyp

      • Kleine und mittlere Unternehmen

      • Große Unternehmen

    • Ausblick für Großbritannien(Mrd. USD, 2018–2032)

    • Vertriebsautomatisierung in Großbritannien durch Software

      • Das On-Premises-Salesforce-Automatisierungssystem

      • Software-as-a-Service (SaaS)-Salesforce-Automatisierungssystem

      • Cloudbasiertes Salesforce-Automatisierungssystem

    • Vertriebsautomatisierung in Großbritannien nach Organisationstyp

      • Kleine und mittlere Unternehmen

      • Große Unternehmen

    • ItalienAusblick (Mrd. USD, 2018–2032)

    • Vertriebsautomatisierung in Italien durch Software

      • Das On-Premises-Salesforce-Automatisierungssystem

      • Software-as-a-Service (SaaS)-Salesforce-Automatisierungssystem

      • Cloudbasiertes Salesforce-Automatisierungssystem

    • Vertriebsautomatisierung in Italien nach Organisationstyp

      • Kleine und mittlere Unternehmen

      • Große Unternehmen

    • SpanienAusblick (Mrd. USD, 2018–2032)

    • Salesforce-Automatisierung in Spanien durch Software

      • Das On-Premises-Salesforce-Automatisierungssystem

      • Software-as-a-Service (SaaS)-Salesforce-Automatisierungssystem

      • Cloudbasiertes Salesforce-Automatisierungssystem

    • Salesforce-Automatisierung in Spanien nach Organisationstyp

      • Kleine und mittlere Unternehmen

      • Große Unternehmen

    • Restliches EuropaAusblick (Mrd. USD, 2018–2032)

    • Salesforce-Automatisierung im Restlichen Europa durch Software

      • Das On-Premises-Salesforce-Automatisierungssystem

      • Software-as-a-Service (SaaS)-Salesforce-Automatisierungssystem

      • Cloudbasiertes Salesforce-Automatisierungssystem

    • Salesforce-Automatisierung im Restlichen Europa nach Organisationstyp

      • Kleine und mittlere Unternehmen Unternehmen

      • Großunternehmen

  • Ausblick Asien-Pazifik (Mrd. USD, 2018–2032)

    • Softwarebasierte Vertriebsautomatisierung im asiatisch-pazifischen Raum

      • Das On-Premises-Salesforce-Automatisierungssystem

      • Software-as-a-Service (SaaS)-Salesforce-Automatisierungssystem

      • Cloudbasiertes Salesforce-Automatisierungssystem

    • Vertriebsautomatisierung im asiatisch-pazifischen Raum nach Unternehmen Typ

      • Kleine und mittlere Unternehmen

      • Große Unternehmen

    • China Ausblick (Mrd. USD, 2018–2032)

    • Vertriebsautomatisierung in China durch Software

      • Das On-Premises-Salesforce-Automatisierungssystem

      • Software-as-a-Service (SaaS)-Salesforce-Automatisierungssystem

      • Cloudbasiertes Salesforce-Automatisierungssystem

    • Vertriebsautomatisierung in China nach Unternehmen Typ

      • Kleine und mittlere Unternehmen

      • Großunternehmen

    • JapanAusblick (Mrd. USD, 2018–2032)

    • Vertriebsautomatisierung in Japan durch Software

      • Das On-Premises-Salesforce-Automatisierungssystem

      • Software-as-a-Service (SaaS)-Salesforce-Automatisierungssystem

      • Cloudbasiertes Salesforce-Automatisierungssystem

    • Vertriebsautomatisierung in Japan nach Organisation Typ

      • Kleine und mittlere Unternehmen

      • Großunternehmen

    • IndienAusblick (Mrd. USD, 2018–2032)

    • Vertriebsautomatisierung in Indien durch Software

      • Das On-Premises-Salesforce-Automatisierungssystem

      • Software-as-a-Service (SaaS)-Salesforce-Automatisierungssystem

      • Cloudbasiertes Salesforce-Automatisierungssystem

    • Vertriebsautomatisierung in Indien nach Unternehmen Typ

      • Kleine und mittlere Unternehmen

      • Große Unternehmen

    • AustralienAusblick (Mrd. USD, 2018–2032)

    • Australien: Vertriebsautomatisierung durch Software

      • Das On-Premises-Salesforce-Automatisierungssystem

      • Software-as-a-Service (SaaS)-Salesforce-Automatisierungssystem

      • Cloudbasiertes Salesforce-Automatisierungssystem

    • Australien: Vertriebsautomatisierung nach Unternehmen Typ

      • Kleine und mittlere Unternehmen

      • Großunternehmen

    • Ausblick für den restlichen Asien-Pazifik-Raum (Mrd. USD, 2018–2032)

    • Softwarebasierte Vertriebsautomatisierung im restlichen Asien-Pazifik-Raum

      • Das On-Premises-Salesforce-Automatisierungssystem

      • Software-as-a-Service (SaaS)-Salesforce-Automatisierungssystem

      • Cloudbasierte Salesforce-Automatisierung System

    • Vertriebsautomatisierung im Rest der Asien-Pazifik-Region nach Organisationstyp

      • Kleine und mittlere Unternehmen

      • Großunternehmen

  • Ausblick für den Rest der Welt (Mrd. USD, 2018–2032)

    • Vertriebsautomatisierung im Rest der Welt durch Software

      • Das On-Premises-Salesforce-Automatisierungssystem

      • Software-as-a-Service (SaaS) Salesforce-Automatisierung System

      • Cloudbasiertes Salesforce-Automatisierungssystem

    • Salesforce-Automatisierung im Rest der Welt nach Organisationstyp

      • Kleine und mittlere Unternehmen

      • Großunternehmen

    • Naher OstenAusblick (Mrd. USD, 2018–2032)

    • Salesforce-Automatisierung im Nahen Osten per Software

      • Das On-Premises-Salesforce-Automatisierungssystem

      • Software-as-a-Service (SaaS) Salesforce-Automatisierung System

      • Cloudbasiertes Salesforce-Automatisierungssystem

    • Vertriebsautomatisierung im Nahen Osten nach Organisationstyp

      • Kleine und mittlere Unternehmen

      • Großunternehmen

    • AfrikaAusblick (Mrd. USD, 2018–2032)

    • Afrika-Vertriebsautomatisierung per Software

      • Das On-Premises-Salesforce-Automatisierungssystem

      • Software-as-a-Service (SaaS) Salesforce-Automatisierung System

      • Cloudbasiertes Salesforce-Automatisierungssystem

    • Vertriebsautomatisierung in Afrika nach Organisationstyp

      • Kleine und mittlere Unternehmen

      • Großunternehmen

    • LateinamerikaAusblick (Mrd. USD, 2018–2032)

    • Vertriebsautomatisierung in Lateinamerika durch Software

      • Das On-Premises-Salesforce-Automatisierungssystem

      • Software-as-a-Service (SaaS) Salesforce-Automatisierung System

      • Cloudbasiertes Salesforce-Automatisierungssystem

    • Vertriebsautomatisierung in Lateinamerika nach Organisationstyp

      • Kleine und mittlere Unternehmen

      • Großunternehmen

Compare Licence

×
Features License Type
Single User Multiuser License Enterprise User
Price $4,950 $5,950 $7,250
Maximum User Access Limit 1 User Upto 10 Users Unrestricted Access Throughout the Organization
Free Customization
Direct Access to Analyst
Deliverable Format
Platform Access
Discount on Next Purchase 10% 15% 15%
Printable Versions