Rising Demand for Automation
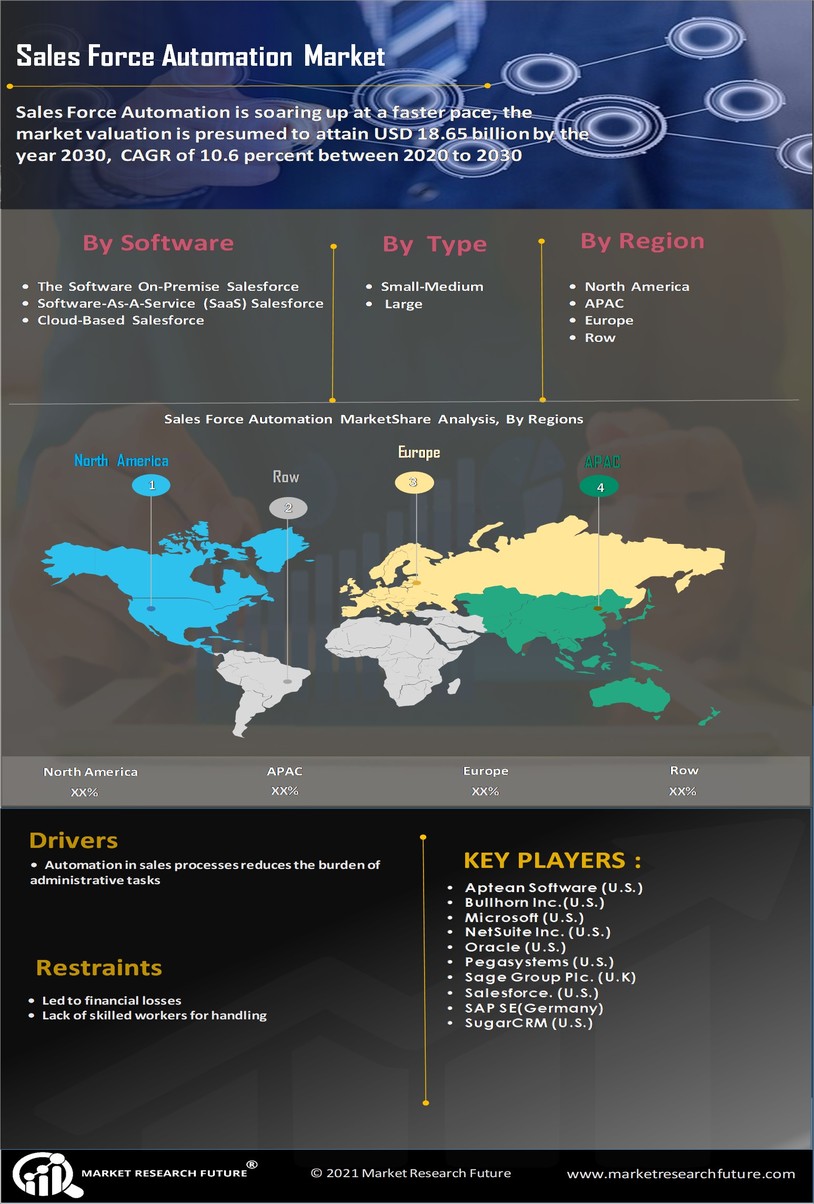
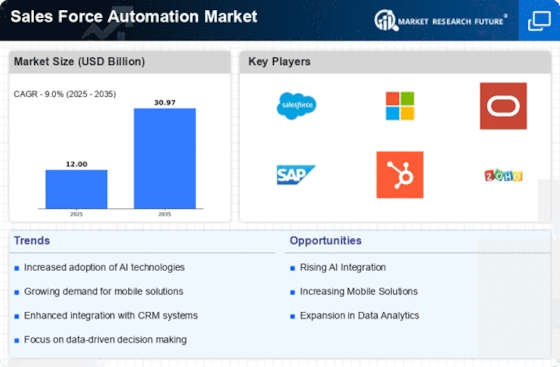
The Sales Force Automation Market is experiencing a notable surge in demand for automation solutions. Organizations are increasingly recognizing the need to streamline their sales processes, enhance productivity, and improve customer engagement. According to recent data, the market is projected to grow at a compound annual growth rate of approximately 10% over the next five years. This growth is driven by the need for businesses to adapt to rapidly changing market conditions and consumer preferences. Automation tools enable sales teams to focus on strategic activities rather than mundane tasks, thereby increasing efficiency. As companies seek to optimize their operations, the Sales Force Automation Market is likely to witness a significant influx of investments aimed at developing innovative automation technologies.
Shift Towards Cloud-Based Solutions
The Sales Force Automation Market is experiencing a significant shift towards cloud-based solutions. Organizations are increasingly adopting cloud technologies to enhance flexibility, scalability, and accessibility of sales automation tools. This transition allows sales teams to access critical information and collaborate in real-time, regardless of their location. Recent data indicates that the cloud-based segment of the Sales Force Automation Market is expected to grow at a rate of 15% annually. As businesses recognize the advantages of cloud solutions, including cost-effectiveness and ease of integration, the Sales Force Automation Market is likely to witness a continued expansion in cloud-based offerings, catering to the evolving needs of modern sales teams.
Enhanced Data Analytics Capabilities
In the Sales Force Automation Market, the integration of advanced data analytics capabilities is becoming increasingly critical. Organizations are leveraging data analytics to gain insights into customer behavior, sales trends, and market dynamics. This analytical approach allows sales teams to make informed decisions, tailor their strategies, and ultimately drive revenue growth. Recent statistics indicate that companies utilizing data-driven sales strategies can achieve up to 20% higher sales productivity. As the demand for actionable insights continues to rise, the Sales Force Automation Market is expected to evolve, with a focus on providing sophisticated analytics tools that empower sales professionals to optimize their performance.
Integration with Emerging Technologies
The Sales Force Automation Market is evolving through the integration of emerging technologies such as artificial intelligence, machine learning, and the Internet of Things. These technologies are enhancing the capabilities of sales automation tools, enabling organizations to automate complex tasks and improve decision-making processes. For instance, AI-driven solutions can analyze vast amounts of data to identify potential leads and predict customer behavior. This integration is expected to drive market growth, as businesses seek to leverage technology to gain a competitive edge. The Sales Force Automation Market is likely to see increased investments in research and development to create innovative solutions that harness the power of these technologies.
Growing Importance of Customer Experience
The Sales Force Automation Market is witnessing a paradigm shift towards prioritizing customer experience. Businesses are increasingly aware that exceptional customer service is a key differentiator in a competitive landscape. As a result, sales automation tools are being designed to enhance customer interactions and foster long-term relationships. Research suggests that organizations that prioritize customer experience can achieve a 10-15% increase in customer retention rates. This trend is prompting companies to invest in Sales Force Automation Market solutions that not only streamline sales processes but also enhance the overall customer journey. Consequently, the Sales Force Automation Market is likely to see a rise in demand for tools that facilitate personalized communication and engagement.
