Request Free Sample ×

Kindly complete the form below to receive a free sample of this Report

* Please use a valid business email

Leading companies partner with us for data-driven Insights

clients tt-cursor
Hero Background

Mdpe-Rohrmarkt

ID: MRFR/CnM/34579-HCR
111 Pages
Chitranshi Jaiswal
Last Updated: April 06, 2026

Marktforschungsbericht über MDPE-Rohre: Nach Anwendung (Wasserversorgung, Gasverteilung, Abwasser und Entwässerung, Bewässerung, industrielle Anwendungen), nach Endverbrauch (Wohnbereich, Gewerbe, Industrie, Landwirtschaft), nach Typ (PE 80, PE 100, PE 63), nach Wandstärke (Dünnwandig, Mittelwandig, Dickwandig) und nach Region (Nordamerika, Europa, Südamerika, Asien-Pazifik, Naher Osten und Afrika) - Prognose bis 2035

Teilen
Download PDF ×

We do not share your information with anyone. However, we may send you emails based on your report interest from time to time. You may contact us at any time to opt-out.

Mdpe Pipe Market Infographic
Purchase Options
  1. 1 ABSCHNITT I: ZUSAMMENFASSUNG UND WICHTIGE HIGHLIGHTS
    1. 1.1 ZUSAMMENFASSUNG
      1. 1.1.1 MarktĂĽbersicht
      2. 1.1.2 Wichtige Ergebnisse
      3. 1.1.3 Marktsegmentierung
      4. 1.1.4 Wettbewerbslandschaft
      5. 1.1.5 Herausforderungen und Chancen
      6. 1.1.6 ZukĂĽnftige Aussichten
  2. 2 ABSCHNITT II: ABGRENZUNG, METHODOLOGIE UND MARKTSTRUKTUR
    1. 2.1 MARKTEINFĂśHRUNG
      1. 2.1.1 Definition
      2. 2.1.2 Umfang der Studie
        1. 2.1.2.1 Forschungsziel
        2. 2.1.2.2 Annahme
        3. 2.1.2.3 Einschränkungen
    2. 2.2 FORSCHUNGSMETHODOLOGIE
      1. 2.2.1 Ăśberblick
      2. 2.2.2 Datenanalyse
      3. 2.2.3 Sekundärforschung
      4. 2.2.4 Primärforschung
        1. 2.2.4.1 Primärinterviews und Informationssammlungsprozess
        2. 2.2.4.2 Aufschlüsselung der primären Befragten
      5. 2.2.5 Prognosemodell
      6. 2.2.6 Marktschätzung
        1. 2.2.6.1 Bottom-Up-Ansatz
        2. 2.2.6.2 Top-Down-Ansatz
      7. 2.2.7 Daten-Triangulation
      8. 2.2.8 Validierung
  3. 3 ABSCHNITT III: QUALITATIVE ANALYSE
    1. 3.1 MARKTDYNAMIK
      1. 3.1.1 Ăśberblick
      2. 3.1.2 Treiber
      3. 3.1.3 Einschränkungen
      4. 3.1.4 Chancen
    2. 3.2 MARKTFACHT ANALYSE
      1. 3.2.1 Wertschöpfungskettenanalyse
      2. 3.2.2 Porters Fünf Kräfte Analyse
        1. 3.2.2.1 Verhandlungsmacht der Lieferanten
        2. 3.2.2.2 Verhandlungsmacht der Käufer
        3. 3.2.2.3 Bedrohung durch neue Anbieter
        4. 3.2.2.4 Bedrohung durch Substitute
        5. 3.2.2.5 Intensität der Rivalität
      3. 3.2.3 COVID-19 Auswirkungen Analyse
        1. 3.2.3.1 Markt Auswirkungen Analyse
        2. 3.2.3.2 Regionale Auswirkungen
        3. 3.2.3.3 Chancen- und Bedrohungsanalyse
  4. 4 ABSCHNITT IV: QUANTITATIVE ANALYSE
    1. 4.1 Chemikalien und Materialien, NACH Anwendung (Milliarden USD)
      1. 4.1.1 Wasserversorgung
      2. 4.1.2 Gasverteilung
      3. 4.1.3 Abwasser und Entwässerung
      4. 4.1.4 Bewässerung
      5. 4.1.5 Industrielle Anwendungen
    2. 4.2 Chemikalien und Materialien, NACH Endverwendung (Milliarden USD)
      1. 4.2.1 Wohnbereich
      2. 4.2.2 Gewerbe
      3. 4.2.3 Industrie
      4. 4.2.4 Landwirtschaft
    3. 4.3 Chemikalien und Materialien, NACH Typ (Milliarden USD)
      1. 4.3.1 PE 80
      2. 4.3.2 PE 100
      3. 4.3.3 PE 63
    4. 4.4 Chemikalien und Materialien, NACH Wandstärke (Milliarden USD)
      1. 4.4.1 DĂĽnnwandig
      2. 4.4.2 Mittelwandig
      3. 4.4.3 Dickwandig
    5. 4.5 Chemikalien und Materialien, NACH Region (Milliarden USD)
      1. 4.5.1 Nordamerika
        1. 4.5.1.1 USA
        2. 4.5.1.2 Kanada
      2. 4.5.2 Europa
        1. 4.5.2.1 Deutschland
        2. 4.5.2.2 UK
        3. 4.5.2.3 Frankreich
        4. 4.5.2.4 Russland
        5. 4.5.2.5 Italien
        6. 4.5.2.6 Spanien
        7. 4.5.2.7 Rest von Europa
      3. 4.5.3 APAC
        1. 4.5.3.1 China
        2. 4.5.3.2 Indien
        3. 4.5.3.3 Japan
        4. 4.5.3.4 SĂĽdkorea
        5. 4.5.3.5 Malaysia
        6. 4.5.3.6 Thailand
        7. 4.5.3.7 Indonesien
        8. 4.5.3.8 Rest von APAC
      4. 4.5.4 SĂĽdamerika
        1. 4.5.4.1 Brasilien
        2. 4.5.4.2 Mexiko
        3. 4.5.4.3 Argentinien
        4. 4.5.4.4 Rest von SĂĽdamerika
      5. 4.5.5 MEA
        1. 4.5.5.1 GCC-Länder
        2. 4.5.5.2 SĂĽdafrika
        3. 4.5.5.3 Rest von MEA
  5. 5 ABSCHNITT V: WETTBEWERBSANALYSE
    1. 5.1 Wettbewerbslandschaft
      1. 5.1.1 Ăśberblick
      2. 5.1.2 Wettbewerbsanalyse
      3. 5.1.3 Marktanteilsanalyse
      4. 5.1.4 Hauptwachstumsstrategie in den Chemikalien und Materialien
      5. 5.1.5 Wettbewerbsbenchmarking
      6. 5.1.6 FĂĽhrende Akteure in Bezug auf die Anzahl der Entwicklungen in den Chemikalien und Materialien
      7. 5.1.7 Wichtige Entwicklungen und Wachstumsstrategien
        1. 5.1.7.1 Neue ProdukteinfĂĽhrungen/Dienstleistungsbereitstellungen
        2. 5.1.7.2 Fusionen & Ăśbernahmen
        3. 5.1.7.3 Joint Ventures
      8. 5.1.8 Finanzmatrix der Hauptakteure
        1. 5.1.8.1 Umsatz und Betriebseinkommen
        2. 5.1.8.2 F&E-Ausgaben der Hauptakteure. 2023
    2. 5.2 Unternehmensprofile
      1. 5.2.1 Polypipe (GB)
        1. 5.2.1.1 FinanzĂĽbersicht
        2. 5.2.1.2 Angebotene Produkte
        3. 5.2.1.3 Wichtige Entwicklungen
        4. 5.2.1.4 SWOT-Analyse
        5. 5.2.1.5 SchlĂĽsselstrategien
      2. 5.2.2 Wavin (NL)
        1. 5.2.2.1 FinanzĂĽbersicht
        2. 5.2.2.2 Angebotene Produkte
        3. 5.2.2.3 Wichtige Entwicklungen
        4. 5.2.2.4 SWOT-Analyse
        5. 5.2.2.5 SchlĂĽsselstrategien
      3. 5.2.3 IPEX (CA)
        1. 5.2.3.1 FinanzĂĽbersicht
        2. 5.2.3.2 Angebotene Produkte
        3. 5.2.3.3 Wichtige Entwicklungen
        4. 5.2.3.4 SWOT-Analyse
        5. 5.2.3.5 SchlĂĽsselstrategien
      4. 5.2.4 Aquatherm (DE)
        1. 5.2.4.1 FinanzĂĽbersicht
        2. 5.2.4.2 Angebotene Produkte
        3. 5.2.4.3 Wichtige Entwicklungen
        4. 5.2.4.4 SWOT-Analyse
        5. 5.2.4.5 SchlĂĽsselstrategien
      5. 5.2.5 Georg Fischer (CH)
        1. 5.2.5.1 FinanzĂĽbersicht
        2. 5.2.5.2 Angebotene Produkte
        3. 5.2.5.3 Wichtige Entwicklungen
        4. 5.2.5.4 SWOT-Analyse
        5. 5.2.5.5 SchlĂĽsselstrategien
      6. 5.2.6 Vinidex (AU)
        1. 5.2.6.1 FinanzĂĽbersicht
        2. 5.2.6.2 Angebotene Produkte
        3. 5.2.6.3 Wichtige Entwicklungen
        4. 5.2.6.4 SWOT-Analyse
        5. 5.2.6.5 SchlĂĽsselstrategien
      7. 5.2.7 National Pipe and Plastics (US)
        1. 5.2.7.1 FinanzĂĽbersicht
        2. 5.2.7.2 Angebotene Produkte
        3. 5.2.7.3 Wichtige Entwicklungen
        4. 5.2.7.4 SWOT-Analyse
        5. 5.2.7.5 SchlĂĽsselstrategien
      8. 5.2.8 SABIC (SA)
        1. 5.2.8.1 FinanzĂĽbersicht
        2. 5.2.8.2 Angebotene Produkte
        3. 5.2.8.3 Wichtige Entwicklungen
        4. 5.2.8.4 SWOT-Analyse
        5. 5.2.8.5 SchlĂĽsselstrategien
      9. 5.2.9 Reliance Industries (IN)
        1. 5.2.9.1 FinanzĂĽbersicht
        2. 5.2.9.2 Angebotene Produkte
        3. 5.2.9.3 Wichtige Entwicklungen
        4. 5.2.9.4 SWOT-Analyse
        5. 5.2.9.5 SchlĂĽsselstrategien
    3. 5.3 Anhang
      1. 5.3.1 Referenzen
      2. 5.3.2 Verwandte Berichte
  6. 6 LISTE DER ABBILDUNGEN
    1. 6.1 MARKTSYNOPSIS
    2. 6.2 NORDAMERIKA MARKTANALYSE
    3. 6.3 USA MARKTANALYSE NACH ANWENDUNG
    4. 6.4 USA MARKTANALYSE NACH ENDEINSATZ
    5. 6.5 USA MARKTANALYSE NACH TYP
    6. 6.6 USA MARKTANALYSE NACH WANDSTÄRKE
    7. 6.7 KANADA MARKTANALYSE NACH ANWENDUNG
    8. 6.8 KANADA MARKTANALYSE NACH ENDEINSATZ
    9. 6.9 KANADA MARKTANALYSE NACH TYP
    10. 6.10 KANADA MARKTANALYSE NACH WANDSTÄRKE
    11. 6.11 EUROPA MARKTANALYSE
    12. 6.12 DEUTSCHLAND MARKTANALYSE NACH ANWENDUNG
    13. 6.13 DEUTSCHLAND MARKTANALYSE NACH ENDEINSATZ
    14. 6.14 DEUTSCHLAND MARKTANALYSE NACH TYP
    15. 6.15 DEUTSCHLAND MARKTANALYSE NACH WANDSTÄRKE
    16. 6.16 UK MARKTANALYSE NACH ANWENDUNG
    17. 6.17 UK MARKTANALYSE NACH ENDEINSATZ
    18. 6.18 UK MARKTANALYSE NACH TYP
    19. 6.19 UK MARKTANALYSE NACH WANDSTÄRKE
    20. 6.20 FRANKREICH MARKTANALYSE NACH ANWENDUNG
    21. 6.21 FRANKREICH MARKTANALYSE NACH ENDEINSATZ
    22. 6.22 FRANKREICH MARKTANALYSE NACH TYP
    23. 6.23 FRANKREICH MARKTANALYSE NACH WANDSTÄRKE
    24. 6.24 RUSSLAND MARKTANALYSE NACH ANWENDUNG
    25. 6.25 RUSSLAND MARKTANALYSE NACH ENDEINSATZ
    26. 6.26 RUSSLAND MARKTANALYSE NACH TYP
    27. 6.27 RUSSLAND MARKTANALYSE NACH WANDSTÄRKE
    28. 6.28 ITALIEN MARKTANALYSE NACH ANWENDUNG
    29. 6.29 ITALIEN MARKTANALYSE NACH ENDEINSATZ
    30. 6.30 ITALIEN MARKTANALYSE NACH TYP
    31. 6.31 ITALIEN MARKTANALYSE NACH WANDSTÄRKE
    32. 6.32 SPANIEN MARKTANALYSE NACH ANWENDUNG
    33. 6.33 SPANIEN MARKTANALYSE NACH ENDEINSATZ
    34. 6.34 SPANIEN MARKTANALYSE NACH TYP
    35. 6.35 SPANIEN MARKTANALYSE NACH WANDSTÄRKE
    36. 6.36 REST VON EUROPA MARKTANALYSE NACH ANWENDUNG
    37. 6.37 REST VON EUROPA MARKTANALYSE NACH ENDEINSATZ
    38. 6.38 REST VON EUROPA MARKTANALYSE NACH TYP
    39. 6.39 REST VON EUROPA MARKTANALYSE NACH WANDSTÄRKE
    40. 6.40 APAC MARKTANALYSE
    41. 6.41 CHINA MARKTANALYSE NACH ANWENDUNG
    42. 6.42 CHINA MARKTANALYSE NACH ENDEINSATZ
    43. 6.43 CHINA MARKTANALYSE NACH TYP
    44. 6.44 CHINA MARKTANALYSE NACH WANDSTÄRKE
    45. 6.45 INDIEN MARKTANALYSE NACH ANWENDUNG
    46. 6.46 INDIEN MARKTANALYSE NACH ENDEINSATZ
    47. 6.47 INDIEN MARKTANALYSE NACH TYP
    48. 6.48 INDIEN MARKTANALYSE NACH WANDSTÄRKE
    49. 6.49 JAPAN MARKTANALYSE NACH ANWENDUNG
    50. 6.50 JAPAN MARKTANALYSE NACH ENDEINSATZ
    51. 6.51 JAPAN MARKTANALYSE NACH TYP
    52. 6.52 JAPAN MARKTANALYSE NACH WANDSTÄRKE
    53. 6.53 SĂĽDKOREA MARKTANALYSE NACH ANWENDUNG
    54. 6.54 SĂĽDKOREA MARKTANALYSE NACH ENDEINSATZ
    55. 6.55 SĂĽDKOREA MARKTANALYSE NACH TYP
    56. 6.56 SüDKOREA MARKTANALYSE NACH WANDSTÄRKE
    57. 6.57 MALAYSIA MARKTANALYSE NACH ANWENDUNG
    58. 6.58 MALAYSIA MARKTANALYSE NACH ENDEINSATZ
    59. 6.59 MALAYSIA MARKTANALYSE NACH TYP
    60. 6.60 MALAYSIA MARKTANALYSE NACH WANDSTÄRKE
    61. 6.61 THAILAND MARKTANALYSE NACH ANWENDUNG
    62. 6.62 THAILAND MARKTANALYSE NACH ENDEINSATZ
    63. 6.63 THAILAND MARKTANALYSE NACH TYP
    64. 6.64 THAILAND MARKTANALYSE NACH WANDSTÄRKE
    65. 6.65 INDONESIEN MARKTANALYSE NACH ANWENDUNG
    66. 6.66 INDONESIEN MARKTANALYSE NACH ENDEINSATZ
    67. 6.67 INDONESIEN MARKTANALYSE NACH TYP
    68. 6.68 INDONESIEN MARKTANALYSE NACH WANDSTÄRKE
    69. 6.69 REST VON APAC MARKTANALYSE NACH ANWENDUNG
    70. 6.70 REST VON APAC MARKTANALYSE NACH ENDEINSATZ
    71. 6.71 REST VON APAC MARKTANALYSE NACH TYP
    72. 6.72 REST VON APAC MARKTANALYSE NACH WANDSTÄRKE
    73. 6.73 SĂśDAMERIKA MARKTANALYSE
    74. 6.74 BRASILIEN MARKTANALYSE NACH ANWENDUNG
    75. 6.75 BRASILIEN MARKTANALYSE NACH ENDEINSATZ
    76. 6.76 BRASILIEN MARKTANALYSE NACH TYP
    77. 6.77 BRASILIEN MARKTANALYSE NACH WANDSTÄRKE
    78. 6.78 MEXIKO MARKTANALYSE NACH ANWENDUNG
    79. 6.79 MEXIKO MARKTANALYSE NACH ENDEINSATZ
    80. 6.80 MEXIKO MARKTANALYSE NACH TYP
    81. 6.81 MEXIKO MARKTANALYSE NACH WANDSTÄRKE
    82. 6.82 ARGENTINIEN MARKTANALYSE NACH ANWENDUNG
    83. 6.83 ARGENTINIEN MARKTANALYSE NACH ENDEINSATZ
    84. 6.84 ARGENTINIEN MARKTANALYSE NACH TYP
    85. 6.85 ARGENTINIEN MARKTANALYSE NACH WANDSTÄRKE
    86. 6.86 REST VON SĂśDAMERIKA MARKTANALYSE NACH ANWENDUNG
    87. 6.87 REST VON SĂśDAMERIKA MARKTANALYSE NACH ENDEINSATZ
    88. 6.88 REST VON SĂśDAMERIKA MARKTANALYSE NACH TYP
    89. 6.89 REST VON SÜDAMERIKA MARKTANALYSE NACH WANDSTÄRKE
    90. 6.90 MEA MARKTANALYSE
    91. 6.91 GCC-LÄNDER MARKTANALYSE NACH ANWENDUNG
    92. 6.92 GCC-LÄNDER MARKTANALYSE NACH ENDEINSATZ
    93. 6.93 GCC-LÄNDER MARKTANALYSE NACH TYP
    94. 6.94 GCC-LÄNDER MARKTANALYSE NACH WANDSTÄRKE
    95. 6.95 SĂśDAFRIKA MARKTANALYSE NACH ANWENDUNG
    96. 6.96 SĂśDAFRIKA MARKTANALYSE NACH ENDEINSATZ
    97. 6.97 SĂśDAFRIKA MARKTANALYSE NACH TYP
    98. 6.98 REST VON MEA MARKTANALYSE NACH ANWENDUNG
    99. 6.99 REST VON MEA MARKTANALYSE NACH ENDEINSATZ
    100. 6.100 REST VON MEA MARKTANALYSE NACH TYP
    101. 6.101 REST VON MEA MARKTANALYSE NACH WANDSTÄRKE
    102. 6.102 WICHTIGE KAUFKRITERIEN FĂśR CHEMIKALIEN UND MATERIALIEN
    103. 6.103 FORSCHUNGSPROZESS VON MRFR
    104. 6.104 DRO ANALYSE FĂśR CHEMIKALIEN UND MATERIALIEN
    105. 6.105 TREIBERWIRKUNGSANALYSE: CHEMIKALIEN UND MATERIALIEN
    106. 6.106 EINSCHRÄNKUNGENWIRKUNGSANALYSE: CHEMIKALIEN UND MATERIALIEN
    107. 6.107 LIEFER-/WERTSCHĂ–PFUNGSKETTE: CHEMIKALIEN UND MATERIALIEN
    108. 6.108 CHEMIKALIEN UND MATERIALIEN, NACH ANWENDUNG, 2024 (% ANTEIL)
    109. 6.109 CHEMIKALIEN UND MATERIALIEN, NACH ANWENDUNG, 2024 BIS 2035 (Milliarden USD)
    110. 6.110 CHEMIKALIEN UND MATERIALIEN, NACH ENDEINSATZ, 2024 (% ANTEIL)
    111. 6.111 CHEMIKALIEN UND MATERIALIEN, NACH ENDEINSATZ, 2024 BIS 2035 (Milliarden USD)
    112. 6.112 CHEMIKALIEN UND MATERIALIEN, NACH TYP, 2024 (% ANTEIL)
    113. 6.113 CHEMIKALIEN UND MATERIALIEN, NACH TYP, 2024 BIS 2035 (Milliarden USD)
    114. 6.114 CHEMIKALIEN UND MATERIALIEN, NACH WANDSTÄRKE, 2024 (% ANTEIL)
    115. 6.115 CHEMIKALIEN UND MATERIALIEN, NACH WANDSTÄRKE, 2024 BIS 2035 (Milliarden USD)
    116. 6.116 BENCHMARKING DER HAUPTWETTBEWERBER
  7. 7 LISTE DER TABELLEN
    1. 7.1 LISTE DER ANNAHMEN
    2. 7.2 NORDAMERIKA MARKTGRÖSSENSCHÄTZUNGEN; PROGNOSE
      1. 7.2.1 NACH ANWENDUNG, 2025-2035 (Milliarden USD)
      2. 7.2.2 NACH ENDEINSATZ, 2025-2035 (Milliarden USD)
      3. 7.2.3 NACH TYP, 2025-2035 (Milliarden USD)
      4. 7.2.4 NACH WANDSTÄRKE, 2025-2035 (Milliarden USD)
    3. 7.3 USA MARKTGRÖSSENSCHÄTZUNGEN; PROGNOSE
      1. 7.3.1 NACH ANWENDUNG, 2025-2035 (Milliarden USD)
      2. 7.3.2 NACH ENDEINSATZ, 2025-2035 (Milliarden USD)
      3. 7.3.3 NACH TYP, 2025-2035 (Milliarden USD)
      4. 7.3.4 NACH WANDSTÄRKE, 2025-2035 (Milliarden USD)
    4. 7.4 KANADA MARKTGRÖSSENSCHÄTZUNGEN; PROGNOSE
      1. 7.4.1 NACH ANWENDUNG, 2025-2035 (Milliarden USD)
      2. 7.4.2 NACH ENDEINSATZ, 2025-2035 (Milliarden USD)
      3. 7.4.3 NACH TYP, 2025-2035 (Milliarden USD)
      4. 7.4.4 NACH WANDSTÄRKE, 2025-2035 (Milliarden USD)
    5. 7.5 EUROPA MARKTGRÖSSENSCHÄTZUNGEN; PROGNOSE
      1. 7.5.1 NACH ANWENDUNG, 2025-2035 (Milliarden USD)
      2. 7.5.2 NACH ENDEINSATZ, 2025-2035 (Milliarden USD)
      3. 7.5.3 NACH TYP, 2025-2035 (Milliarden USD)
      4. 7.5.4 NACH WANDSTÄRKE, 2025-2035 (Milliarden USD)
    6. 7.6 DEUTSCHLAND MARKTGRÖSSENSCHÄTZUNGEN; PROGNOSE
      1. 7.6.1 NACH ANWENDUNG, 2025-2035 (Milliarden USD)
      2. 7.6.2 NACH ENDEINSATZ, 2025-2035 (Milliarden USD)
      3. 7.6.3 NACH TYP, 2025-2035 (Milliarden USD)
      4. 7.6.4 NACH WANDSTÄRKE, 2025-2035 (Milliarden USD)
    7. 7.7 UK MARKTGRÖSSENSCHÄTZUNGEN; PROGNOSE
      1. 7.7.1 NACH ANWENDUNG, 2025-2035 (Milliarden USD)
      2. 7.7.2 NACH ENDEINSATZ, 2025-2035 (Milliarden USD)
      3. 7.7.3 NACH TYP, 2025-2035 (Milliarden USD)
      4. 7.7.4 NACH WANDSTÄRKE, 2025-2035 (Milliarden USD)
    8. 7.8 FRANKREICH MARKTGRÖSSENSCHÄTZUNGEN; PROGNOSE
      1. 7.8.1 NACH ANWENDUNG, 2025-2035 (Milliarden USD)
      2. 7.8.2 NACH ENDEINSATZ, 2025-2035 (Milliarden USD)
      3. 7.8.3 NACH TYP, 2025-2035 (Milliarden USD)
      4. 7.8.4 NACH WANDSTÄRKE, 2025-2035 (Milliarden USD)
    9. 7.9 RUSSLAND MARKTGRÖSSENSCHÄTZUNGEN; PROGNOSE
      1. 7.9.1 NACH ANWENDUNG, 2025-2035 (Milliarden USD)
      2. 7.9.2 NACH ENDEINSATZ, 2025-2035 (Milliarden USD)
      3. 7.9.3 NACH TYP, 2025-2035 (Milliarden USD)
      4. 7.9.4 NACH WANDSTÄRKE, 2025-2035 (Milliarden USD)
    10. 7.10 ITALIEN MARKTGRÖSSENSCHÄTZUNGEN; PROGNOSE
      1. 7.10.1 NACH ANWENDUNG, 2025-2035 (Milliarden USD)
      2. 7.10.2 NACH ENDEINSATZ, 2025-2035 (Milliarden USD)
      3. 7.10.3 NACH TYP, 2025-2035 (Milliarden USD)
      4. 7.10.4 NACH WANDSTÄRKE, 2025-2035 (Milliarden USD)
    11. 7.11 SPANIEN MARKTGRÖSSENSCHÄTZUNGEN; PROGNOSE
      1. 7.11.1 NACH ANWENDUNG, 2025-2035 (Milliarden USD)
      2. 7.11.2 NACH ENDEINSATZ, 2025-2035 (Milliarden USD)
      3. 7.11.3 NACH TYP, 2025-2035 (Milliarden USD)
      4. 7.11.4 NACH WANDSTÄRKE, 2025-2035 (Milliarden USD)
    12. 7.12 REST VON EUROPA MARKTGRÖSSENSCHÄTZUNGEN; PROGNOSE
      1. 7.12.1 NACH ANWENDUNG, 2025-2035 (Milliarden USD)
      2. 7.12.2 NACH ENDEINSATZ, 2025-2035 (Milliarden USD)
      3. 7.12.3 NACH TYP, 2025-2035 (Milliarden USD)
      4. 7.12.4 NACH WANDSTÄRKE, 2025-2035 (Milliarden USD)
    13. 7.13 APAC MARKTGRÖSSENSCHÄTZUNGEN; PROGNOSE
      1. 7.13.1 NACH ANWENDUNG, 2025-2035 (Milliarden USD)
      2. 7.13.2 NACH ENDEINSATZ, 2025-2035 (Milliarden USD)
      3. 7.13.3 NACH TYP, 2025-2035 (Milliarden USD)
      4. 7.13.4 NACH WANDSTÄRKE, 2025-2035 (Milliarden USD)
    14. 7.14 CHINA MARKTGRÖSSENSCHÄTZUNGEN; PROGNOSE
      1. 7.14.1 NACH ANWENDUNG, 2025-2035 (Milliarden USD)
      2. 7.14.2 NACH ENDEINSATZ, 2025-2035 (Milliarden USD)
      3. 7.14.3 NACH TYP, 2025-2035 (Milliarden USD)
      4. 7.14.4 NACH WANDSTÄRKE, 2025-2035 (Milliarden USD)
    15. 7.15 INDIEN MARKTGRÖSSENSCHÄTZUNGEN; PROGNOSE
      1. 7.15.1 NACH ANWENDUNG, 2025-2035 (Milliarden USD)
      2. 7.15.2 NACH ENDEINSATZ, 2025-2035 (Milliarden USD)
      3. 7.15.3 NACH TYP, 2025-2035 (Milliarden USD)
      4. 7.15.4 NACH WANDSTÄRKE, 2025-2035 (Milliarden USD)
    16. 7.16 JAPAN MARKTGRÖSSENSCHÄTZUNGEN; PROGNOSE
      1. 7.16.1 NACH ANWENDUNG, 2025-2035 (Milliarden USD)
      2. 7.16.2 NACH ENDEINSATZ, 2025-2035 (Milliarden USD)
      3. 7.16.3 NACH TYP, 2025-2035 (Milliarden USD)
      4. 7.16.4 NACH WANDSTÄRKE, 2025-2035 (Milliarden USD)
    17. 7.17 SüDKOREA MARKTGRÖSSENSCHÄTZUNGEN; PROGNOSE
      1. 7.17.1 NACH ANWENDUNG, 2025-2035 (Milliarden USD)
      2. 7.17.2 NACH ENDEINSATZ, 2025-2035 (Milliarden USD)
      3. 7.17.3 NACH TYP, 2025-2035 (Milliarden USD)
      4. 7.17.4 NACH WANDSTÄRKE, 2025-2035 (Milliarden USD)
    18. 7.18 MALAYSIA MARKTGRÖSSENSCHÄTZUNGEN; PROGNOSE
      1. 7.18.1 NACH ANWENDUNG, 2025-2035 (Milliarden USD)
      2. 7.18.2 NACH ENDEINSATZ, 2025-2035 (Milliarden USD)
      3. 7.18.3 NACH TYP, 2025-2035 (Milliarden USD)
      4. 7.18.4 NACH WANDSTÄRKE, 2025-2035 (Milliarden USD)
    19. 7.19 THAILAND MARKTGRÖSSENSCHÄTZUNGEN; PROGNOSE
      1. 7.19.1 NACH ANWENDUNG, 2025-2035 (Milliarden USD)
      2. 7.19.2 NACH ENDEINSATZ, 2025-2035 (Milliarden USD)
      3. 7.19.3 NACH TYP, 2025-2035 (Milliarden USD)
      4. 7.19.4 NACH WANDSTÄRKE, 2025-2035 (Milliarden USD)
    20. 7.20 INDONESIEN MARKTGRÖSSENSCHÄTZUNGEN; PROGNOSE
      1. 7.20.1 NACH ANWENDUNG, 2025-2035 (Milliarden USD)
      2. 7.20.2 NACH ENDEINSATZ, 2025-2035 (Milliarden USD)
      3. 7.20.3 NACH TYP, 2025-2035 (Milliarden USD)
      4. 7.20.4 NACH WANDSTÄRKE, 2025-2035 (Milliarden USD)
    21. 7.21 REST VON APAC MARKTGRÖSSENSCHÄTZUNGEN; PROGNOSE
      1. 7.21.1 NACH ANWENDUNG, 2025-2035 (Milliarden USD)
      2. 7.21.2 NACH ENDEINSATZ, 2025-2035 (Milliarden USD)
      3. 7.21.3 NACH TYP, 2025-2035 (Milliarden USD)
      4. 7.21.4 NACH WANDSTÄRKE, 2025-2035 (Milliarden USD)
    22. 7.22 SÜDAMERIKA MARKTGRÖSSENSCHÄTZUNGEN; PROGNOSE
      1. 7.22.1 NACH ANWENDUNG, 2025-2035 (Milliarden USD)
      2. 7.22.2 NACH ENDEINSATZ, 2025-2035 (Milliarden USD)
      3. 7.22.3 NACH TYP, 2025-2035 (Milliarden USD)
      4. 7.22.4 NACH WANDSTÄRKE, 2025-2035 (Milliarden USD)
    23. 7.23 BRASILIEN MARKTGRÖSSENSCHÄTZUNGEN; PROGNOSE
      1. 7.23.1 NACH ANWENDUNG, 2025-2035 (Milliarden USD)
      2. 7.23.2 NACH ENDEINSATZ, 2025-2035 (Milliarden USD)
      3. 7.23.3 NACH TYP, 2025-2035 (Milliarden USD)
      4. 7.23.4 NACH WANDSTÄRKE, 2025-2035 (Milliarden USD)
    24. 7.24 MEXIKO MARKTGRÖSSENSCHÄTZUNGEN; PROGNOSE
      1. 7.24.1 NACH ANWENDUNG, 2025-2035 (Milliarden USD)
      2. 7.24.2 NACH ENDEINSATZ, 2025-2035 (Milliarden USD)
      3. 7.24.3 NACH TYP, 2025-2035 (Milliarden USD)
      4. 7.24.4 NACH WANDSTÄRKE, 2025-2035 (Milliarden USD)
    25. 7.25 ARGENTINIEN MARKTGRÖSSENSCHÄTZUNGEN; PROGNOSE
      1. 7.25.1 NACH ANWENDUNG, 2025-2035 (Milliarden USD)
      2. 7.25.2 NACH ENDEINSATZ, 2025-2035 (Milliarden USD)
      3. 7.25.3 NACH TYP, 2025-2035 (Milliarden USD)
      4. 7.25.4 NACH WANDSTÄRKE, 2025-2035 (Milliarden USD)
    26. 7.26 REST VON SÜDAMERIKA MARKTGRÖSSENSCHÄTZUNGEN; PROGNOSE
      1. 7.26.1 NACH ANWENDUNG, 2025-2035 (Milliarden USD)
      2. 7.26.2 NACH ENDEINSATZ, 2025-2035 (Milliarden USD)
      3. 7.26.3 NACH TYP, 2025-2035 (Milliarden USD)
      4. 7.26.4 NACH WANDSTÄRKE, 2025-2035 (Milliarden USD)
    27. 7.27 MEA MARKTGRÖSSENSCHÄTZUNGEN; PROGNOSE
      1. 7.27.1 NACH ANWENDUNG, 2025-2035 (Milliarden USD)
      2. 7.27.2 NACH ENDEINSATZ, 2025-2035 (Milliarden USD)
      3. 7.27.3 NACH TYP, 2025-2035 (Milliarden USD)
      4. 7.27.4 NACH WANDSTÄRKE, 2025-2035 (Milliarden USD)
    28. 7.28 GCC-LÄNDER MARKTGRÖSSENSCHÄTZUNGEN; PROGNOSE
      1. 7.28.1 NACH ANWENDUNG, 2025-2035 (Milliarden USD)
      2. 7.28.2 NACH ENDEINSATZ, 2025-2035 (Milliarden USD)
      3. 7.28.3 NACH TYP, 2025-2035 (Milliarden USD)
      4. 7.28.4 NACH WANDSTÄRKE, 2025-2035 (Milliarden USD)
    29. 7.29 SÜDAFRIKA MARKTGRÖSSENSCHÄTZUNGEN; PROGNOSE
      1. 7.29.1 NACH ANWENDUNG, 2025-2035 (Milliarden USD)
      2. 7.29.2 NACH ENDEINSATZ, 2025-2035 (Milliarden USD)
      3. 7.29.3 NACH TYP, 2025-2035 (Milliarden USD)
      4. 7.29.4 NACH WANDSTÄRKE, 2025-2035 (Milliarden USD)
    30. 7.30 REST VON MEA MARKTGRÖSSENSCHÄTZUNGEN; PROGNOSE
      1. 7.30.1 NACH ANWENDUNG, 2025-2035 (Milliarden USD)
      2. 7.30.2 NACH ENDEINSATZ, 2025-2035 (Milliarden USD)
      3. 7.30.3 NACH TYP, 2025-2035 (Milliarden USD)
      4. 7.30.4 NACH WANDSTÄRKE, 2025-2035 (Milliarden USD)
    31. 7.31 PRODUKTEINFĂśHRUNG/PRODUKTENTWICKLUNG/GENEHMIGUNG
    32. 7.32 AKQUISITION/PARTNERSCHAFT

Marktsegmentierung fĂĽr MDPE-Rohre

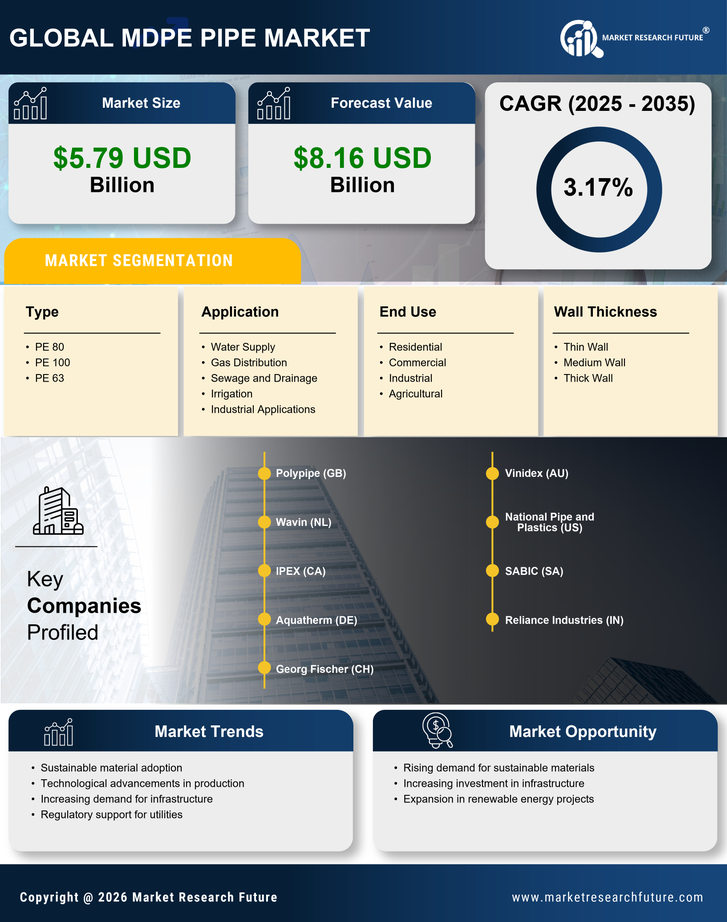
  • MDPE-Rohrmarkt nach Anwendung (Milliarden USD, 2019–2032)
    • Wasserversorgung
    • Gasverteilung
    • Abwasser und Entwässerung
    • Bewässerung
    • Industrielle Anwendungen
  • MDPE-Rohrmarkt nach Endverwendung (Milliarden USD, 2019–2032)
    • Wohnbereich
    • Werblich
    • Industriell
    • Landwirtschaft
  • MDPE-Rohrmarkt nach Typ (Milliarden USD, 2019–2032)
    • PE 80
    • PE 100
    • PE 63
  • MDPE-Rohrmarkt nach Wandstärke (Milliarden USD, 2019–2032)
    • DĂĽnne Wand
    • Mittlere Wand
    • Dicke Wand
  • MDPE-Rohrmarkt nach Regionen (Milliarden USD, 2019–2032)
    • Nordamerika
    • Europa
    • SĂĽdamerika
    • Asien-Pazifik
    • Naher Osten und Afrika

Regionaler Ausblick auf den MDPE-Rohrmarkt (Milliarden USD, 2019–2032)

  • Nordamerika-Ausblick (in Mrd. USD, 2019–2032)
    • Nordamerikanischer Markt fĂĽr MDPE-Rohre nach Anwendungstyp
      • Wasserversorgung
      • Gasverteilung
      • Abwasser und Entwässerung
      • Bewässerung
      • Industrielle Anwendungen
    • Nordamerikanischer Markt fĂĽr MDPE-Rohre nach Endverwendungstyp
      • Wohnbereich
      • Werblich
      • Industriell
      • Landwirtschaft
    • Nordamerikanischer MDPE-Rohrmarkt nach Typ
      • PE 80
      • PE 100
      • PE 63
    • Nordamerikanischer MDPE-Rohrmarkt nach Wandstärkentyp
      • DĂĽnne Wand
      • Mittlere Wand
      • Dicke Wand
    • Nordamerikanischer MDPE-Rohrmarkt nach regionalem Typ
      • USA
      • Kanada
    • US Outlook (Milliarden USD, 2019–2032)
    • US-MDPE-Rohrmarkt nach Anwendungstyp
      • Wasserversorgung
      • Gasverteilung
      • Abwasser und Entwässerung
      • Bewässerung
      • Industrielle Anwendungen
    • US-MDPE-Rohrmarkt nach Endverwendungstyp
      • Wohnbereich
      • Werblich
      • Industriell
      • Landwirtschaft
    • US-MDPE-Rohrmarkt nach Typ
      • PE 80
      • PE 100
      • PE 63
    • US-MDPE-Rohrmarkt nach Wandstärkentyp
      • DĂĽnne Wand
      • Mittlere Wand
      • Dicke Wand
    • KANADA-Ausblick (Milliarden USD, 2019–2032)
    • KANADA MDPE-Rohrmarkt nach Anwendungstyp
      • Wasserversorgung
      • Gasverteilung
      • Abwasser und Entwässerung
      • Bewässerung
      • Industrielle Anwendungen
    • KANADA MDPE-Rohrmarkt nach Endverwendungstyp
      • Wohnbereich
      • Werblich
      • Industriell
      • Landwirtschaft
    • KANADA MDPE-Rohrmarkt nach Typ
      • PE 80
      • PE 100
      • PE 63
    • KANADA MDPE-Rohrmarkt nach Wandstärkentyp
      • DĂĽnne Wand
      • Mittlere Wand
      • Dicke Wand
    • Europa-Ausblick (Milliarden US-Dollar, 2019–2032)
      • Europa MDPE-Rohrmarkt nach Anwendungstyp
        • Wasserversorgung
        • Gasverteilung
        • Abwasser und Entwässerung
        • Bewässerung
        • Industrielle Anwendungen
      • Europa MDPE-Rohrmarkt nach Endverwendungstyp
        • Wohnbereich
        • Werblich
        • Industriell
        • Landwirtschaft
      • Europa MDPE-Rohrmarkt nach Typ
        • PE 80
        • PE 100
        • PE 63
      • Europa MDPE-Rohrmarkt nach Wandstärkentyp
        • DĂĽnne Wand
        • Mittlere Wand
        • Dicke Wand
      • Europa MDPE-Rohrmarkt nach regionalem Typ
        • Deutschland
        • GroĂźbritannien
        • Frankreich
        • Russland
        • Italien
        • Spanien
        • Restliches Europa
      • Ausblick fĂĽr Deutschland (Milliarden US-Dollar, 2019–2032)
      • DEUTSCHLAND MDPE-Rohrmarkt nach Anwendungstyp
        • Wasserversorgung
        • Gasverteilung
        • Abwasser und Entwässerung
        • Bewässerung
        • Industrielle Anwendungen
      • DEUTSCHLAND MDPE-Rohrmarkt nach Endverwendungstyp
        • Wohnbereich
        • Werblich
        • Industriell
        • Landwirtschaft
      • DEUTSCHLAND MDPE-Rohrmarkt nach Typ
        • PE 80
        • PE 100
        • PE 63
      • DEUTSCHLAND MDPE-Rohrmarkt nach Wandstärkentyp
        • DĂĽnne Wand
        • Mittlere Wand
        • Dicke Wand
      • UK Outlook (Milliarden USD, 2019–2032)
      • Markt fĂĽr MDPE-Rohre im Vereinigten Königreich nach Anwendungstyp
        • Wasserversorgung
        • Gasverteilung
        • Abwasser und Entwässerung
        • Bewässerung
        • Industrielle Anwendungen
      • Markt fĂĽr MDPE-Rohre im Vereinigten Königreich nach Endverwendungstyp
        • Wohnbereich
        • Werblich
        • Industriell
        • Landwirtschaft
      • Markt fĂĽr MDPE-Rohre im Vereinigten Königreich nach Typ
        • PE 80
        • PE 100
        • PE 63
      • Markt fĂĽr MDPE-Rohre im Vereinigten Königreich nach Wandstärkentyp
        • DĂĽnne Wand
        • Mittlere Wand
        • Dicke Wand
      • FRANKREICH-Ausblick (Milliarden USD, 2019–2032)
      • Frankreich MDPE-Rohrmarkt nach Anwendungstyp
        • Wasserversorgung
        • Gasverteilung
        • Abwasser und Entwässerung
        • Bewässerung
        • Industrielle Anwendungen
      • Markt fĂĽr MDPE-Rohre in Frankreich nach Endverwendungstyp
        • Wohnbereich
        • Werblich
        • Industriell
        • Landwirtschaft
      • Frankreich MDPE-Rohrmarkt nach Typ
        • PE 80
        • PE 100
        • PE 63
      • Markt fĂĽr MDPE-Rohre in Frankreich nach Wandstärkentyp
        • DĂĽnne Wand
        • Mittlere Wand
        • Dicke Wand
      • Russland-Ausblick (Milliarden US-Dollar, 2019–2032)
      • RUSSLAND MDPE-Rohrmarkt nach Anwendungstyp
        • Wasserversorgung
        • Gasverteilung
        • Abwasser und Entwässerung
        • Bewässerung
        • Industrielle Anwendungen
      • RUSSLAND MDPE-Rohrmarkt nach Endverwendungstyp
        • Wohnbereich
        • Werblich
        • Industriell
        • Landwirtschaft
      • RUSSLAND MDPE-Rohrmarkt nach Typ
        • PE 80
        • PE 100
        • PE 63
      • RUSSLAND MDPE-Rohrmarkt nach Wandstärkentyp
        • DĂĽnne Wand
        • Mittlere Wand
        • Dicke Wand
      • ITALIEN-Ausblick (Milliarden USD, 2019–2032)
      • ITALIEN MDPE-Rohrmarkt nach Anwendungstyp
        • Wasserversorgung
        • Gasverteilung
        • Abwasser und Entwässerung
        • Bewässerung
        • Industrielle Anwendungen
      • ITALIEN MDPE-Rohrmarkt nach Endverwendungstyp
        • Wohnbereich
        • Werblich
        • Industriell
        • Landwirtschaft
      • ITALIEN MDPE-Rohrmarkt nach Typ
        • PE 80
        • PE 100
        • PE 63
      • ITALIEN MDPE-Rohrmarkt nach Wandstärkentyp
        • DĂĽnne Wand
        • Mittlere Wand
        • Dicke Wand
      • SPANIEN-Ausblick (Milliarden USD, 2019–2032)
      • Markt fĂĽr MDPE-Rohre in Spanien nach Anwendungstyp
        • Wasserversorgung
        • Gasverteilung
        • Abwasser und Entwässerung
        • Bewässerung
        • Industrielle Anwendungen
      • SPANISCHER MDPE-Rohrmarkt nach Endverwendungstyp
        • Wohnbereich
        • Werblich
        • Industriell
        • Landwirtschaft
      • Markt fĂĽr MDPE-Rohre in Spanien nach Typ
        • PE 80
        • PE 100
        • PE 63
      • SPANISCHER MDPE-Rohrmarkt nach Wandstärkentyp
        • DĂĽnne Wand
        • Mittlere Wand
        • Dicke Wand
      • Ăśbriges Europa – Ausblick (Milliarden USD, 2019–2032)
      • Markt fĂĽr MDPE-Rohre im restlichen Europa nach Anwendungstyp
        • Wasserversorgung
        • Gasverteilung
        • Abwasser und Entwässerung
        • Bewässerung
        • Industrielle Anwendungen
      • Markt fĂĽr MDPE-Rohre im Rest Europas nach Endverwendungstyp
        • Wohnbereich
        • Werblich
        • Industriell
        • Landwirtschaft
      • Ăśbriges Europa MDPE-Rohrmarkt nach Typ
        • PE 80
        • PE 100
        • PE 63
      • Markt fĂĽr MDPE-Rohre im restlichen Europa nach Wandstärkentyp
        • DĂĽnne Wand
        • Mittlere Wand
        • Dicke Wand
      • APAC-Ausblick (in Mrd. USD, 2019–2032)
        • APAC MDPE-Rohrmarkt nach Anwendungstyp
          • Wasserversorgung
          • Gasverteilung
          • Abwasser und Entwässerung
          • Bewässerung
          • Industrielle Anwendungen
        • APAC MDPE-Rohrmarkt nach Endverwendungstyp
          • Wohnbereich
          • Werblich
          • Industriell
          • Landwirtschaft
        • APAC MDPE-Rohrmarkt nach Typ
          • PE 80
          • PE 100
          • PE 63
        • APAC MDPE-Rohrmarkt nach Wandstärkentyp
          • DĂĽnne Wand
          • Mittlere Wand
          • Dicke Wand
        • APAC MDPE-Rohrmarkt nach regionalem Typ
          • China
          • Indien
          • Japan
          • SĂĽdkorea
          • Malaysia
          • Thailand
          • Indonesien
          • Rest von APAC
        • CHINA-Ausblick (Milliarden USD, 2019–2032)
        • CHINA MDPE-Rohrmarkt nach Anwendungstyp
          • Wasserversorgung
          • Gasverteilung
          • Abwasser und Entwässerung
          • Bewässerung
          • Industrielle Anwendungen
        • CHINA MDPE-Rohrmarkt nach Endverwendungstyp
          • Wohnbereich
          • Werblich
          • Industriell
          • Landwirtschaft
        • CHINA MDPE-Rohrmarkt nach Typ
          • PE 80
          • PE 100
          • PE 63
        • CHINA MDPE-Rohrmarkt nach Wandstärkentyp
          • DĂĽnne Wand
          • Mittlere Wand
          • Dicke Wand
        • INDIEN-Ausblick (Milliarden USD, 2019–2032)
        • INDISCHER MDPE-Rohrmarkt nach Anwendungstyp
          • Wasserversorgung
          • Gasverteilung
          • Abwasser und Entwässerung
          • Bewässerung
          • Industrielle Anwendungen
        • INDISCHER MDPE-Rohrmarkt nach Endverwendungstyp
          • Wohnbereich
          • Werblich
          • Industriell
          • Landwirtschaft
        • INDISCHER MDPE-Rohrmarkt nach Typ
          • PE 80
          • PE 100
          • PE 63
        • INDISCHER MDPE-Rohrmarkt nach Wandstärkentyp
          • DĂĽnne Wand
          • Mittlere Wand
          • Dicke Wand
        • JAPAN Outlook (Milliarden USD, 2019–2032)
        • JAPAN MDPE-Rohrmarkt nach Anwendungstyp
          • Wasserversorgung
          • Gasverteilung
          • Abwasser und Entwässerung
          • Bewässerung
          • Industrielle Anwendungen
        • JAPAN MDPE-Rohrmarkt nach Endverwendungstyp
          • Wohnbereich
          • Werblich
          • Industriell
          • Landwirtschaft
        • JAPANischer MDPE-Rohrmarkt nach Typ
          • PE 80
          • PE 100
          • PE 63
        • JAPAN MDPE-Rohrmarkt nach Wandstärkentyp
          • DĂĽnne Wand
          • Mittlere Wand
          • Dicke Wand
        • Ausblick fĂĽr SĂśDKOREA (Milliarden USD, 2019–2032)
        • Markt fĂĽr MDPE-Rohre in SĂśDKOREA nach Anwendungstyp
          • Wasserversorgung
          • Gasverteilung
          • Abwasser und Entwässerung
          • Bewässerung
          • Industrielle Anwendungen
        • Markt fĂĽr MDPE-Rohre in SĂśDKOREA nach Endverwendungstyp
          • Wohnbereich
          • Werblich
          • Industriell
          • Landwirtschaft
        • Markt fĂĽr MDPE-Rohre in SĂśDKOREA nach Typ
          • PE 80
          • PE 100
          • PE 63
        • Markt fĂĽr MDPE-Rohre in SĂśDKOREA nach Wandstärkentyp
          • DĂĽnne Wand
          • Medium Wall
          • Dicke Wand
        • MALAYSIA-Ausblick (Milliarden USD, 2019–2032)
        • MALAYSIA MDPE-Rohrmarkt nach Anwendungstyp
          • Wasserversorgung
          • Gasverteilung
          • Abwasser und Entwässerung
          • Bewässerung
          • Industrielle Anwendungen
        • MALAYSIA MDPE-Rohrmarkt nach Endverwendungstyp
          • Wohnbereich
          • Werblich
          • Industriell
          • Landwirtschaft
        • MALAYSIA MDPE-Rohrmarkt nach Typ
          • PE 80
          • PE 100
          • PE 63
        • MALAYSIA MDPE-Rohrmarkt nach Wandstärkentyp
          • DĂĽnne Wand
          • Mittlere Wand
          • Dicke Wand
        • THAILAND-Ausblick (Milliarden USD, 2019–2032)
        • THAILAND MDPE-Rohrmarkt nach Anwendungstyp
          • Wasserversorgung
          • Gasverteilung
          • Abwasser und Entwässerung
          • Bewässerung
          • Industrielle Anwendungen
        • THAILAND MDPE-Rohrmarkt nach Endverwendungstyp
          • Wohnbereich
          • Werblich
          • Industriell
          • Landwirtschaft
        • THAILAND MDPE-Rohrmarkt nach Typ
          • PE 80
          • PE 100
          • PE 63
        • THAILAND MDPE-Rohrmarkt nach Wandstärkentyp
          • DĂĽnne Wand
          • Mittlere Wand
          • Dicke Wand
        • Indonesien-Ausblick (Milliarden US-Dollar, 2019–2032)
        • INDONESIEN MDPE-Rohrmarkt nach Anwendungstyp
          • Wasserversorgung
          • Gasverteilung
          • Abwasser und Entwässerung
          • Bewässerung
          • Industrielle Anwendungen
        • INDONESIEN MDPE-Rohrmarkt nach Endverwendungstyp
          • Wohnbereich
          • Werblich
          • Industriell
          • Landwirtschaft
        • INDONESIEN MDPE-Rohrmarkt nach Typ
          • PE 80
          • PE 100
          • PE 63
        • INDONESIEN MDPE-Rohrmarkt nach Wandstärkentyp
          • DĂĽnne Wand
          • Mittlere Wand
          • Dicke Wand
        • Restlicher APAC-Ausblick (in Mrd. USD, 2019–2032)
        • REST OF APAC MDPE-Rohrmarkt nach Anwendungstyp
          • Wasserversorgung
          • Gasverteilung
          • Abwasser und Entwässerung
          • Bewässerung
          • Industrielle Anwendungen
        • REST OF APAC MDPE-Rohrmarkt nach Endverwendungstyp
          • Wohnbereich
          • Werblich
          • Industriell
          • Landwirtschaft
        • REST OF APAC MDPE-Rohrmarkt nach Typ
          • PE 80
          • PE 100
          • PE 63
        • REST OF APAC MDPE-Rohrmarkt nach Wandstärkentyp
          • DĂĽnne Wand
          • Mittlere Wand
          • Dicke Wand
        • SĂĽdamerika-Ausblick (in Mrd. USD, 2019–2032)
          • SĂĽdamerikanischer MDPE-Rohrmarkt nach Anwendungstyp
            • Wasserversorgung
            • Gasverteilung
            • Abwasser und Entwässerung
            • Bewässerung
            • Industrielle Anwendungen
          • SĂĽdamerikanischer MDPE-Rohrmarkt nach Endverwendungstyp
            • Wohnbereich
            • Werblich
            • Industriell
            • Landwirtschaft
          • SĂĽdamerikanischer MDPE-Rohrmarkt nach Typ
            • PE 80
            • PE 100
            • PE 63
          • SĂĽdamerikanischer MDPE-Rohrmarkt nach Wandstärkentyp
            • DĂĽnne Wand
            • Mittlere Wand
            • Dicke Wand
          • SĂĽdamerikanischer MDPE-Rohrmarkt nach regionalem Typ
            • Brasilien
            • Mexiko
            • Argentinien
            • Restliches SĂĽdamerika
          • BRASILIEN-Ausblick (Milliarden US-Dollar, 2019–2032)
          • BRASILIEN MDPE-Rohrmarkt nach Anwendungstyp
            • Wasserversorgung
            • Gasverteilung
            • Abwasser und Entwässerung
            • Bewässerung
            • Industrielle Anwendungen
          • BRASILIEN MDPE-Rohrmarkt nach Endverwendungstyp
            • Wohnbereich
            • Werblich
            • Industriell
            • Landwirtschaft
          • BRASILIEN MDPE-Rohrmarkt nach Typ
            • PE 80
            • PE 100
            • PE 63
          • BRASILIEN MDPE-Rohrmarkt nach Wandstärkentyp
            • DĂĽnne Wand
            • Mittlere Wand
            • Dicke Wand
          • Mexiko-Ausblick (Milliarden US-Dollar, 2019–2032)
          • MEXIKO MDPE-Rohrmarkt nach Anwendungstyp
            • Wasserversorgung
            • Gasverteilung
            • Abwasser und Entwässerung
            • Bewässerung
            • Industrielle Anwendungen
          • MEXIKO MDPE-Rohrmarkt nach Endverwendungstyp
            • Wohnbereich
            • Werblich
            • Industriell
            • Landwirtschaft
          • MEXIKO MDPE-Rohrmarkt nach Typ
            • PE 80
            • PE 100
            • PE 63
          • MEXIKO MDPE-Rohrmarkt nach Wandstärkentyp
            • DĂĽnne Wand
            • Mittlere Wand
            • Dicke Wand
          • Argentinien-Ausblick (Milliarden US-Dollar, 2019–2032)
          • ARGENTINIEN MDPE-Rohrmarkt nach Anwendungstyp
            • Wasserversorgung
            • Gasverteilung
            • Abwasser und Entwässerung
            • Bewässerung
            • Industrielle Anwendungen
          • ARGENTINIEN MDPE-Rohrmarkt nach Endverwendungstyp
            • Wohnbereich
            • Werblich
            • Industriell
            • Landwirtschaft
          • ARGENTINIEN MDPE-Rohrmarkt nach Typ
            • PE 80
            • PE 100
            • PE 63
          • ARGENTINIEN MDPE-Rohrmarkt nach Wandstärkentyp
            • DĂĽnne Wand
            • Mittlere Wand
            • Dicke Wand
          • Ausblick fĂĽr das restliche SĂĽdamerika (Milliarden US-Dollar, 2019–2032)
          • Ăśbriger Markt fĂĽr MDPE-Rohre in SĂĽdamerika nach Anwendungstyp
            • Wasserversorgung
            • Gasverteilung
            • Abwasser und Entwässerung
            • Bewässerung
            • Industrielle Anwendungen
          • Ăśbriger Markt fĂĽr MDPE-Rohre in SĂĽdamerika nach Endverwendungstyp
            • Wohnbereich
            • Werblich
            • Industriell
            • Landwirtschaft
          • Ăśbriges SĂĽdamerika MDPE-Rohrmarkt nach Typ
            • PE 80
            • PE 100
            • PE 63
          • Ăśbriger Markt fĂĽr MDPE-Rohre in SĂĽdamerika nach Wandstärkentyp
            • DĂĽnne Wand
            • Mittlere Wand
            • Dicke Wand
          • MEA-Ausblick (in Mrd. USD, 2019–2032)
            • Markt fĂĽr MEA-MDPE-Rohre nach Anwendungstyp
              • Wasserversorgung
              • Gasverteilung
              • Abwasser und Entwässerung
              • Bewässerung
              • Industrielle Anwendungen
            • Markt fĂĽr MEA-MDPE-Rohre nach Endverwendungstyp
              • Wohnbereich
              • Werblich
              • Industriell
              • Landwirtschaft
            • Markt fĂĽr MEA-MDPE-Rohre nach Typ
              • PE 80
              • PE 100
              • PE 63
            • MEA MDPE-Rohrmarkt nach Wandstärkentyp
              • DĂĽnne Wand
              • Mittlere Wand
              • Dicke Wand
            • MEA MDPE-Rohrmarkt nach regionalem Typ
              • GCC-Länder
              • SĂĽdafrika
              • Rest von MEA
            • GCC-LĂ„NDER Ausblick (Milliarden USD, 2019–2032)
            • GCC-LĂ„NDER MDPE-Rohrmarkt nach Anwendungstyp
              • Wasserversorgung
              • Gasverteilung
              • Abwasser und Entwässerung
              • Bewässerung
              • Industrielle Anwendungen
            • GCC-LĂ„NDER MDPE-Rohrmarkt nach Endverwendungstyp
              • Wohnbereich
              • Werblich
              • Industriell
              • Landwirtschaft
            • GCC-LĂ„NDER MDPE-Rohrmarkt nach Typ
              • PE 80
              • PE 100
              • PE 63
            • GCC-LĂ„NDER MDPE-Rohrmarkt nach Wandstärkentyp
              • DĂĽnne Wand
              • Mittlere Wand
              • Dicke Wand
            • Ausblick fĂĽr SĂĽdafrika (Milliarden US-Dollar, 2019–2032)
            • SĂśDAFRIKA MDPE-Rohrmarkt nach Anwendungstyp
              • Wasserversorgung
              • Gasverteilung
              • Abwasser und Entwässerung
              • Bewässerung
              • Industrielle Anwendungen
            • SĂśDAFRIKA MDPE-Rohrmarkt nach Endverwendungstyp
              • Wohnbereich
              • Werblich
              • Industriell
              • Landwirtschaft
            • SĂśDAFRIKA MDPE-Rohrmarkt nach Typ
              • PE 80
              • PE 100
              • PE 63
            • SĂśDAFRIKA MDPE-Rohrmarkt nach Wandstärkentyp
              • DĂĽnne Wand
              • Mittlere Wand
              • Dicke Wand
            • REST OF MEA Outlook (Milliarden USD, 2019–2032)
            • REST OF MEA MDPE-Rohrmarkt nach Anwendungstyp
              • Wasserversorgung
              • Gasverteilung
              • Abwasser und Entwässerung
              • Bewässerung
              • Industrielle Anwendungen
            • REST OF MEA MDPE-Rohrmarkt nach Endverwendungstyp
              • Wohnbereich
              • Werblich
              • Industriell
              • Landwirtschaft
            • REST OF MEA MDPE-Rohrmarkt nach Typ
              • PE 80
              • PE 100
              • PE 63
            • REST OF MEA MDPE-Rohrmarkt nach Wandstärkentyp
              • DĂĽnne Wand
              • Mittlere Wand
              • Dicke Wand


Compare Licence

×
Features License Type
Single User Multiuser License Enterprise User
Price $4,950 $ $7,250
Maximum User Access Limit 1 User Upto 10 Users Unrestricted Access Throughout the Organization
Free Customization âś“ âś“ âś“
Direct Access to Analyst âś“ âś“ âś“
Deliverable Format âś“ âś“ âś“
Platform Access âś— âś— âś“
Discount on Next Purchase 10% 15% 15%
Printable Versions âś— âś— âś“