Request Free Sample ×

Kindly complete the form below to receive a free sample of this Report

* Please use a valid business email

Leading companies partner with us for data-driven Insights

clients tt-cursor
Hero Background

Freight Trucking Market

ID: MRFR/PCM/8717-HCR
111 Pages
Snehal Singh
Last Updated: April 06, 2026

货运卡车市场研究报告信息按车辆类型(轻型商用车、中型商用车和重型商用车)、最终用途(工业和制造业、石油和天然气、建筑和采矿、化学品和农产品、食品和饮料等)和地区(北美、欧洲、亚太地区和世界其他地区)划分 - 市场预测至 2034 年

分享
Download PDF ×

We do not share your information with anyone. However, we may send you emails based on your report interest from time to time. You may contact us at any time to opt-out.

Freight Trucking Market Infographic
Purchase Options

全球货运卡车市场概览

p2024 年,货运卡车市场规模价值 32,322.8 亿美元。预计货运卡车行业将从 2025 年的 33,729.5 亿美元增长到 2034 年的 49,490.0 亿美元,预测期内(2025 - 2034 年)的复合年增长率 (CAGR) 为 4.40%。货运卡车市场以使用重型车辆将货物从一个地方运输到另一个地方而闻名。货运卡车市场用于将重载车辆从一个地方运送到另一个地方。快速消费品的快速扩张促进了货运卡车市场份额的市场发展。

货运卡车市场概览

来源:二手资料研究、一手资料研究、MRFR 数据库和分析师评论

货运卡车市场趋势

ul
  • 全球建筑行业的快速增长预计将推动市场增长。

p货运卡车利用重型卡车将货物从一个地方运输到另一个地方。它主要用于散装和重型货物运输。预计在预测期内,不断增长的门到门运输需求将推动货运卡车市场的发展。此外,全球商品和服务进出口活动的不断增长也是市场发展的支撑因素。预计在预测期内,电子商务行业的蓬勃发展也将推动货运卡车需求的激增。货运卡车是一种高效的货物和服务运输方式;因此,在石油和天然气、制造业、建筑业、采矿业、化学品和其他行业等众多行业,其需求都非常高。预计未来几年,公共商品和服务支出的增加将推动对卡车运输服务的需求。预计这将为货运卡车服务提供商的收入增长创造丰厚的机会。

来源:二手资料研究、一手资料研究、MRFR 数据库和分析师评论

此外,货运市场日益增长的技术进步正在影响具有冷藏和改进性能等各种功能的大容量卡车的采用,以实现高效的货物运输,预计将在预测期内为市场创造新的前景。

然而,发展中国家和欠发达国家缺乏高效的交通基础设施以及对重型卡车排放控制的严格规定,预计是阻碍预测期内市场增长的一些因素。

货运卡车市场细分洞察

h3货运卡车车辆类型洞察 p根据车辆类型,货运卡车市场细分包括轻型商用车、中型商用车和重型商用车。由于各地区进出口活动和贸易的不断增加,重型商用车细分市场预计将在预测期内实现最高增长。此外,由于对快速消费品和服务的需求不断增长,冷藏卡车细分市场也有望实现显著增长。

货运卡车最终用途洞察

p根据最终用途,货运卡车市场细分包括工业与制造业、石油与天然气、建筑与采矿业、化学品与农产品、食品与饮料以及其他。工业与制造业是货运卡车市场的主要细分市场。 2019 年,制造业占据了市场主导地位,其次是能源和采矿业,这得益于新兴国家工业化和城市化进程的加快,以及民众对大宗商品和制成品的需求不断增长。

图 2:2021 年和 2030 年货运卡车市场(按车辆类型划分)(单位:十亿美元)货运卡车市场,按车辆类型划分 strong来源:二手资料研究、一手资料研究、MRFR 数据库和分析师评论

h3货运卡车区域洞察 p按地区划分,该研究提供了北美、欧洲、亚太地区和世界其他地区的市场洞察。 2019年,亚太地区占据货运卡车运输市场主导地位,市场份额最大,预计在预测期内将继续保持主导地位。预计在预测期内,包括中国、印度、韩国和日本在内的亚太地区新兴国家的工业化进程将推动市场发展。这些新兴经济体进出口活动的增加是该地区市场增长的支撑因素。亚太地区城市化进程的加快和生活水平的提高预计将推动门到门运输服务的增长。除此之外,在线零售服务需求激增是预计在预测期内推动市场增长的主要因素之一。

图 3:2021 年各地区货运卡车市场份额 (%)各地区货运卡车市场份额 strong来源:二手资料研究、一手资料研究、MRFR 数据库和分析师评论

p预计北美在预测期内也将经历显著增长。卡车运输是北美散装货物、大宗商品、货物和服务最广泛的运输方式。预计未来几年,卡车运输将继续在该地区占据主导地位。该地区主要参与者的存在是市场增长的支撑因素。与其他运输方式相比,技术先进的大容量卡车可提供快速的运输速度。此外,北美发达国家完善的交通基础设施预计将在预测期内推动市场增长。电动卡车的认知度和普及度不断提高,以及电动汽车充电基础设施和服务网络的强大存在,预计也将在未来几年推动市场增长。

货运卡车主要市场参与者及竞争洞察

p主要市场参与者正在投入大量资金进行研发,以扩大其产品线,这将有助于货运卡车市场进一步增长。市场参与者也在采取一系列战略举措,以扩大其全球影响力,关键的市场发展包括新产品发布、合同协议、并购、增加投资以及与其他组织的合作。货运卡车行业的竞争对手必须提供具有成本效益的产品,才能在竞争日益激烈且不断发展的市场环境中扩张和生存。

主要市场参与者正在投入大量资金进行研发,以扩大其产品线,这将进一步刺激货运卡车市场的增长。随着新产品发布、合同协议、并购、增加投资以及与其他组织的合作等重大市场发展,市场参与者也在开展各种战略活动以扩大其影响力。为了在竞争日益激烈且不断发展的市场环境中发展壮大,货运卡车行业的竞争对手必须提供价格合理的产品。

在货运卡车行业中,制造商采用的本地化生产以降低运营成本是其主要商业策略之一,旨在使客户受益并扩大市场。货运卡车市场最近为医药行业带来了一些最重要的优势。包括Tuma transport、联邦快递公司、Ceva holding LLC等在内的主要护发产品市场参与者正试图通过资助研发项目来增加市场需求。

联合包裹服务公司 (UPS) 是全球最大的包裹递送公司,也是物流和运输服务市场的领导者。该公司由詹姆斯·凯西 (James Casey) 创立,最初将公司命名为美国信使公司 (American Messenger Company),总部位于华盛顿州西雅图。UPS 为200个国家/地区的180万客户提供服务,2009年,该公司在全球范围内递送了超过38亿个包裹。UPS 的行业竞争非常激烈,竞争对手包括美国邮政服务公司 (United Parcel Service) 和联邦快递 (Federal Express) 等。此外,UPS 一直保持着包裹递送行业的领先地位。

货运卡车市场的主要公司名单包括

ul
  • 货运公司
  • UPS
  • 联邦快递
  • Tuma Transport
  • Swift Transport
  • Interlogix, Kuehne +Nagel
  • Transtech Logistics
  • Concargo 和 JJ
h3货运卡车运输行业发展 p2022 年 2 月,

2021 年 7 月,乔达收购了 Velocity Freight Transport Inc.,以满足客户对更多运输替代方案日益增长的需求,确保其供应链保持敏捷和高效。2023 年 9 月,加州空气资源委员会 (CARB) 通过了新法规,要求到 2045 年,该州销售的所有新型重型卡车都必须实现零排放。该法规还要求卡车制造商从 2024 年开始每年销售一定比例的零排放卡车。

2023 年 10 月:美国卡车运输协会报告称,司机短缺人数达到创纪录的 80,000 人,这加剧了运力限制并推高了运费。

2023 年 11 月:拜登政府宣布了一项旨在吸引和留住卡车司机的新举措,包括为培训项目和学徒机会提供资金。

货运卡车市场细分

h3货运卡车车辆类型展望 ul
  • 轻型商用车
  • 中型商用车
  • 重型商用车
h3货运卡车最终用途展望 ul
  • 工业和制造业
  • 石油和天然气
  • 建筑和采矿业
  • 化工和农产品
  • 食品和饮料饮料
  • 其他
h3货运区域展望 ul
  • 北美
    • 美国
    • 加拿大
  • 欧洲
    • 德国
    • 法国
    • 英国
    • 意大利
    • 西班牙
    • 其余部分欧洲
  • 亚太地区
    • 中国
    • 日本
    • 印度
    • 澳大利亚
    • 韩国
    • 澳大利亚
    • 亚太地区其他地区
  • 世界其他地区
    • 中东
    • 非洲
    • 拉丁美洲

市场亮点

FAQs

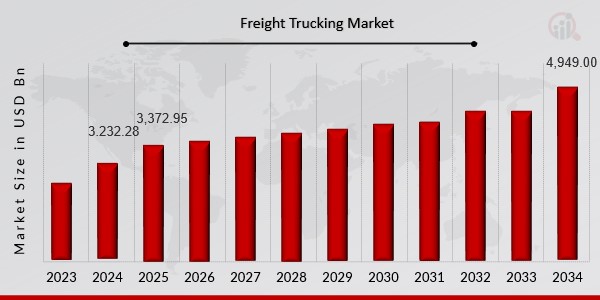
What is the current valuation of the Freight Trucking Market as of 2024?

The Freight Trucking Market was valued at approximately 3232.28 USD Billion in 2024.

What is the projected market size for the Freight Trucking Market by 2035?

The market is projected to reach around 5164.38 USD Billion by 2035.

What is the expected CAGR for the Freight Trucking Market during the forecast period 2025 - 2035?

The expected CAGR for the Freight Trucking Market during 2025 - 2035 is 4.35%.

Which companies are considered key players in the Freight Trucking Market?

Key players in the market include J.B. Hunt Transport Services, Schneider National, Knight-Swift Transportation Holdings, and others.

What are the main segments of the Freight Trucking Market by application?

The main segments by application include Freight Transportation, Logistics Services, Supply Chain Management, and E-commerce Delivery.

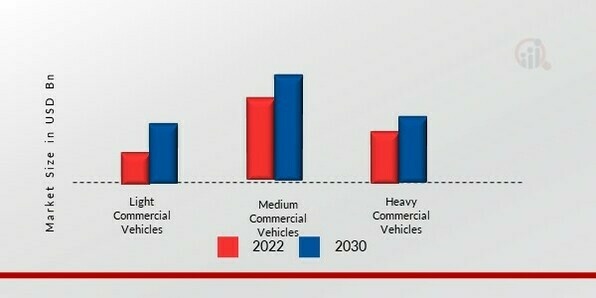
How does the Freight Trucking Market perform in terms of vehicle type segmentation?

The market segments by vehicle type include Heavy Duty Trucks, Medium Duty Trucks, Light Duty Trucks, and Refrigerated Trucks.

What fuel types are utilized in the Freight Trucking Market?

The market utilizes various fuel types, including Diesel, Natural Gas, Electric, and Hybrid.

What are the primary end-use segments in the Freight Trucking Market?

Primary end-use segments include Retail, Manufacturing, Construction, and Food and Beverage.

What service types are prevalent in the Freight Trucking Market?

Service types in the market include Dedicated Contract Carriage, Private Fleet, For-Hire Carrier, and Intermodal Transportation.

How does the Freight Trucking Market's growth compare across different segments?

The Freight Transportation segment is projected to grow from 1200.0 to 1900.0 USD Billion, indicating robust growth potential.
作者
Author
Author Profile
Snehal Singh LinkedIn
Manager - Research
High acumen in analyzing complex macro & micro markets with more than 6 years of work experience in the field of market research. By implementing her analytical skills in forecasting and estimation into market research reports, she has expertise in Packaging, Construction, and Equipment domains. She handles a team size of 20-25 resources and ensures smooth running of the projects, associated marketing activities, and client servicing.
发表评论

Research Approach

Secondary Research

The secondary research process involved comprehensive analysis of transportation regulatory databases, industry trade publications, government logistics statistics, and authoritative transport organizations. Key sources included the US Department of Transportation (DOT), Federal Motor Carrier Safety Administration (FMCSA), Bureau of Transportation Statistics (BTS), American Trucking Associations (ATA), American Transportation Research Institute (ATRI), International Transport Forum (ITF), European Automobile Manufacturers Association (ACEA), European Commission Directorate-General for Mobility and Transport, Organisation Internationale des Constructeurs d'Automobiles (OICA), National Highway Traffic Safety Administration (NHTSA), US Environmental Protection Agency (EPA) – Office of Transportation and Air Quality, Eurostat Transport Database, Statistics Bureau of Japan, China Ministry of Transport, India Ministry of Road Transport and Highways, OECD Transport Statistics, and national transport authority reports from key markets including Germany (KBA), UK (DVLA), and South Korea (MOLIT). These sources were used to collect freight volume statistics, vehicle registration data, regulatory compliance frameworks, emissions standards, interstate commerce regulations, fleet utilization metrics, fuel consumption trends, and market structure analysis for light commercial vehicles, medium commercial vehicles, and heavy commercial vehicles across diesel, natural gas, electric, and hybrid fuel categories.

Primary Research

In the primary research process, qualitative and quantitative insights were obtained by interviewing supply-side and demand-side stakeholders through structured questionnaires and in-depth discussions. The supply-side sources consisted of CEOs, VPs of Fleet Operations, Chief Sustainability Officers, regulatory compliance heads, and commercial directors from key trucking carriers, dedicated contract carriage providers, and fleet OEMs. Distribution center heads, fleet managers from the retail and manufacturing sectors, supply chain directors, logistics procurement managers, and operations lead from the industrial & manufacturing, oil & gas, construction & mining, chemicals & agri-products, and food & beverages end-use segments were the demand-side sources. Market segmentation was validated across vehicle types and service categories, fleet modernization timelines were confirmed, and insights regarding fuel type adoption rates, digital freight brokerage penetration, route optimization technology deployment, and contract pricing structures were gathered through primary research.

Primary Respondent Breakdown:

By Designation: C-level Primaries (28%), Director Level (34%), Others (38%)

By Region: North America (41%), Europe (24%), Asia-Pacific (29%), Rest of World (6%)

Market Size Estimation

Global market valuation was derived through revenue mapping and freight ton-mile/volume analysis. The methodology included:

Identification of 60+ key trucking carriers and fleet operators across North America, Europe, Asia-Pacific, and Latin America

Service mapping across dedicated contract carriage, for-hire carrier, private fleet, and intermodal transportation segments

Vehicle type mapping across light commercial vehicles (LCV), medium commercial vehicles (MCV), and heavy commercial vehicles (HCV) categories

Fuel type analysis covering diesel, natural gas, electric, and hybrid technologies

Analysis of reported and modeled annual revenues specific to freight trucking operations and carrier portfolios

Coverage of operators and OEMs representing 75-80% of global market share in 2024

Tonnage and shipment volume verification through government freight databases and carrier-manifest data

Extrapolation using bottom-up (freight volume × average rate per mile by country/region) and top-down (carrier revenue validation) approaches to derive segment-specific valuations for industrial & manufacturing, oil & gas, construction & mining, chemicals & agri-products, and food & beverages end-use applications

下载免费样本

请填写以下表格以获取本报告的免费样本

Compare Licence

×
Features License Type
Single User Multiuser License Enterprise User
Price $4,950 $5,950 $7,250
Maximum User Access Limit 1 User Upto 10 Users Unrestricted Access Throughout the Organization
Free Customization
Direct Access to Analyst
Deliverable Format
Platform Access
Discount on Next Purchase 10% 15% 15%
Printable Versions