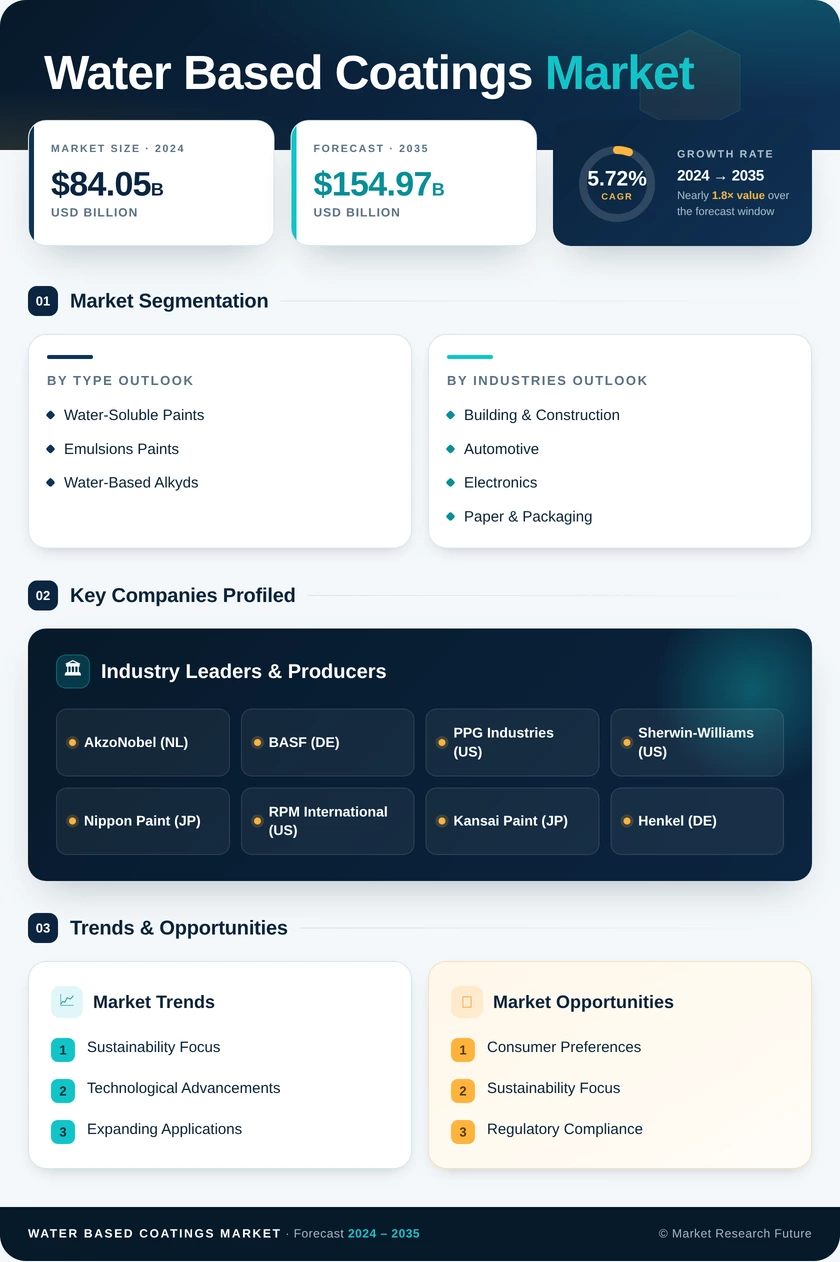
Water-based coatings Market (2026 - 2035)

ID: MRFR/CnM/4287-HCR 100 Pages Anshula Mandaokar Last Updated: October 17, 2026
Water-based Coatings Market Research Report Information By Resin Type (Acrylic, Polyurethane, Epoxy, Alkyd, and Polyester & Others), By End-User Industry (Building & Construction, Automotive, General Industrial, Wood & Furniture, Marine & Protective, and Packaging & Others), and By Application (Architectural / Decorative, Industrial OEM Finishing, Automotive Refinish, Protective & Infrastructure, and Specialty & Functional) – Forecast Till 2035.
Water-based coatings Market
Market Size
Forecast Period2026-2035
CAGR (2026-2035)5.09%
2025 Market SizeUSD 60.15 Billion
2035 Market SizeUSD 100.42 Billion
Key Players
PPG Industries
AkzoNobel
BASF
Sherwin-Williams
Nippon Paint
Asian Paints
Opportunities
  • PFAS-Free Additive Reformulation
  • Automotive Refinish Conversion in North America
  • Emerging-Market Architectural Penetration
  1. 1 Market Summary | |
    1. 1.1 Study Assumptions & Market Definition | |
    2. 1.2 Scope of the Study | |
    3. 1.3 Research Methodology | |
  2. 2 Key Report Takeaways | |
    1. 2.1 By Resin Type | |
    2. 2.2 By End-User Industry | |
    3. 2.3 By Geography | |
  3. 3 Market Size & Forecast (2021–2035) | |
    1. 3.1 Historical Market Size (2021–2025) | |
    2. 3.2 Current & Forecast Market Size (2026–2035) | |
    3. 3.3 Market Size by Revenue (USD Billion) | |
    4. 3.4 Year-over-Year Growth Analysis | |
  4. 4 Driver Impact Analysis | |
    1. 4.1 VOC Regulation Tightening | |
    2. 4.2 Infrastructure and Construction Spending | |
    3. 4.3 Automotive OEM and Refinish Conversion | |
    4. 4.4 Bio-based and PFAS-free Resin Innovation | |
    5. 4.5 Corporate ESG Procurement Mandates | |
    6. 4.6 Urbanisation in Emerging Economies | |
    7. 4.7 Applicator Health and Safety Compliance | |
  5. 5 Restraints Impact Analysis | |
    1. 5.1 Acrylic Monomer Price Volatility | |
    2. 5.2 Performance Gaps in Extreme Service | |
    3. 5.3 Application Window and Humidity Sensitivity | |
    4. 5.4 Capital Cost of Line Conversion | |
    5. 5.5 Fragmented Regional Standards | |
  6. 6 Opportunities | |
    1. 6.1 PFAS-Free Additive Reformulation | |
    2. 6.2 Automotive Refinish Conversion in North America | |
    3. 6.3 Emerging-Market Architectural Penetration | |
    4. 6.4 Digital Colour and Specification Platform Monetisation | |
    5. 6.5 Recoating of Ageing Infrastructure Assets | |
  7. 7 Regional Market Share & Country-Level Analysis | |
    1. 7.1 North America | | |
      1. 7.1.1 US | | |
      2. 7.1.2 Canada | | |
      3. 7.1.3 Mexico | |
    2. 7.2 Europe | | |
      1. 7.2.1 Germany | | |
      2. 7.2.2 UK | | |
      3. 7.2.3 France | | |
      4. 7.2.4 Italy | | |
      5. 7.2.5 Spain | | |
      6. 7.2.6 Nordic Countries | | |
      7. 7.2.7 Russia | | |
      8. 7.2.8 Rest of Europe | |
    3. 7.3 Asia-Pacific | | |
      1. 7.3.1 China | | |
      2. 7.3.2 India | | |
      3. 7.3.3 Japan | | |
      4. 7.3.4 South Korea | | |
      5. 7.3.5 ASEAN | | |
      6. 7.3.6 Rest of Asia-Pacific | |
    4. 7.4 South America | | |
      1. 7.4.1 Brazil | | |
      2. 7.4.2 Argentina | | |
      3. 7.4.3 Rest of South America | |
    5. 7.5 Middle East & Africa | | |
      1. 7.5.1 Saudi Arabia | | |
      2. 7.5.2 UAE | | |
      3. 7.5.3 South Africa | | |
      4. 7.5.4 Egypt | | |
      5. 7.5.5 Rest of MEA | |
  8. 8 Future Outlook (2026–2035) | |
    1. 8.1 Formulation Intelligence and Predictive Colour Systems | |
    2. 8.2 Bio-Attributed and Circular Resin Supply | |
    3. 8.3 Automotive Electrification and Coating Requirements | |
    4. 8.4 Environmental Disclosure as Commercial Infrastructure | |
  9. 9 Segmentation Analysis | |
    1. 9.1 By Resin Type | | |
      1. 9.1.1 Acrylic | | |
      2. 9.1.2 Polyurethane | | |
      3. 9.1.3 Epoxy | | |
      4. 9.1.4 Alkyd | | |
      5. 9.1.5 Polyester & Others | |
    2. 9.2 By End-User Industry | | |
      1. 9.2.1 Building & Construction | | |
      2. 9.2.2 Automotive | | |
      3. 9.2.3 General Industrial | | |
      4. 9.2.4 Wood & Furniture | | |
      5. 9.2.5 Marine & Protective | | |
      6. 9.2.6 Packaging & Others | |
    3. 9.3 By Application | | |
      1. 9.3.1 Architectural / Decorative | | |
      2. 9.3.2 Industrial OEM Finishing | | |
      3. 9.3.3 Automotive Refinish | | |
      4. 9.3.4 Protective & Infrastructure | | |
      5. 9.3.5 Specialty & Functional | |
  10. 10 Competitive Landscape | |
    1. 10.1 Market Concentration Analysis (2026) | |
    2. 10.2 Competitive Benchmarking Matrix | |
    3. 10.3 Company Profiles | | |
      1. 10.3.1 PPG Industries | | |
      2. 10.3.2 AkzoNobel | | |
      3. 10.3.3 BASF | | |
      4. 10.3.4 Sherwin-Williams | | |
      5. 10.3.5 Nippon Paint | | |
      6. 10.3.6 Asian Paints | | |
      7. 10.3.7 Axalta Coating Systems | | |
      8. 10.3.8 Kansai Paint | | |
      9. 10.3.9 RPM International | | |
      10. 10.3.10 Jotun | | |
      11. 10.3.11 Hempel | |
  11. 11 Recent News & Developments | |
  12. 12 Report Scope & Methodology | |
    1. 12.1 Study Period & Base Year | |
    2. 12.2 Data Sources & Citations | |
    3. 12.3 Abbreviations | |
  13. 13 Detailed Sources & Citations | |
  14. 14 Frequently Asked Questions | | LIST OF TABLES | |
  15. TABLE 1 Global Water-based Coatings Market Size & Forecast, by Revenue (USD Billion), 2021–2035 | |
  16. TABLE 2 Global Water-based Coatings Market – Year-over-Year Growth Analysis, 2021–2035 | |
  17. TABLE 3 Driver Impact Analysis – Estimated CAGR Contribution by Driver, 2026–2035 | |
  18. TABLE 4 Restraint Impact Analysis – Estimated CAGR Drag by Restraint, 2026–2035 | |
  19. TABLE 5 Global Water-based Coatings Market Size, by Region, 2021–2035 (USD Billion) | |
  20. TABLE 6 North America Water-based Coatings Market Size, by Country, 2021–2035 (USD Billion) | |
  21. TABLE 7 Europe Water-based Coatings Market Size, by Country, 2021–2035 (USD Billion) | |
  22. TABLE 8 Asia-Pacific Water-based Coatings Market Size, by Country, 2021–2035 (USD Billion) | |
  23. TABLE 9 South America Water-based Coatings Market Size, by Country, 2021–2035 (USD Billion) | |
  24. TABLE 10 Middle East & Africa Water-based Coatings Market Size, by Country, 2021–2035 (USD Billion) | |
  25. TABLE 11 Global Water-based Coatings Market Size, by Resin Type, 2021–2035 (USD Billion) | |
  26. TABLE 12 Global Water-based Coatings Market Size, by End-User Industry, 2021–2035 (USD Billion) | |
  27. TABLE 13 Global Water-based Coatings Market Size, by Application, 2021–2035 (USD Billion) | |
  28. TABLE 14 North America Water-based Coatings Market Size, by Resin Type, 2021–2035 (USD Billion) | |
  29. TABLE 15 North America Water-based Coatings Market Size, by End-User Industry, 2021–2035 (USD Billion) | |
  30. TABLE 16 Europe Water-based Coatings Market Size, by Resin Type, 2021–2035 (USD Billion) | |
  31. TABLE 17 Europe Water-based Coatings Market Size, by End-User Industry, 2021–2035 (USD Billion) | |
  32. TABLE 18 Asia-Pacific Water-based Coatings Market Size, by Resin Type, 2021–2035 (USD Billion) | |
  33. TABLE 19 Asia-Pacific Water-based Coatings Market Size, by End-User Industry, 2021–2035 (USD Billion) | |
  34. TABLE 20 South America Water-based Coatings Market Size, by Resin Type, 2021–2035 (USD Billion) | |
  35. TABLE 21 Middle East & Africa Water-based Coatings Market Size, by Resin Type, 2021–2035 (USD Billion) | |
  36. TABLE 22 Competitive Benchmarking Matrix – Global Water-based Coatings Market, 2026 | |
  37. TABLE 23 Company Profiles – Key Players, Global Water-based Coatings Market | |
  38. TABLE 24 Recent Developments & Strategic Announcements, 2023–2025 | |
  39. TABLE 25 Report Scope & Methodology Summary | |
  40. TABLE 26 Detailed Sources & Citations Index | | LIST OF FIGURES | |
  41. FIGURE 1 Global Water-based Coatings Market – Market Dynamics Overview (Drivers, Restraints, Opportunities) | |
  42. FIGURE 2 Industry Value Chain Analysis – Resin Supply to Applied Finish | |
  43. FIGURE 3 Porter's Five Forces Analysis – Global Water-based Coatings Market | |
  44. FIGURE 4 Global Market Size Trend & Forecast, 2021–2035 (USD Billion) | |
  45. FIGURE 5 Year-over-Year Growth Rate Trend, 2022–2035 (%) | |
  46. FIGURE 6 Market Share by Resin Type, 2025 vs 2035 (%) | |
  47. FIGURE 7 Market Share by End-User Industry, 2025 vs 2035 (%) | |
  48. FIGURE 8 Market Share by Application, 2025 vs 2035 (%) | |
  49. FIGURE 9 Regional Revenue Share Distribution, 2025 (%) | |
  50. FIGURE 10 Regional CAGR Comparison, 2026–2035 (%) | |
  51. FIGURE 11 Asia-Pacific Country-Level Share Breakdown, 2025 (%) | |
  52. FIGURE 12 Europe Country-Level Share Breakdown, 2025 (%) | |
  53. FIGURE 13 Competitive Landscape – Estimated Revenue Share Ranges, 2026 | |
  54. FIGURE 14 Competitive Positioning Matrix – Scale vs Sustainability Disclosure | |
  55. FIGURE 15 VOC Regulation Timeline by Jurisdiction, 2023–2030

Segmentation Quick Reference

DimensionSub-SegmentsDominant SegmentFastest Growing Segment
By Resin TypeAcrylic; Polyurethane; Epoxy; Alkyd; Polyester & OthersAcrylicPolyurethane
By End-User IndustryBuilding & Construction; Automotive; General Industrial; Wood & Furniture; Marine & Protective; Packaging & OthersBuilding & ConstructionAutomotive
By ApplicationArchitectural / Decorative; Industrial OEM Finishing; Automotive Refinish; Protective & Infrastructure; Specialty & FunctionalArchitectural / DecorativeSpecialty & Functional
By GeographyNorth America; Europe; Asia-Pacific; South America; Middle East & AfricaAsia-PacificAsia-Pacific


Market Segmentation Overview

By Resin Type

Sub-SegmentKey Trend
AcrylicBio-attributed and mass-balance certified grades entering decorative supply
PolyurethaneHardness and flexibility parity closing the gap with solvent-borne clearcoats
EpoxyDispersion technology qualifying into ISO 12944 C4/C5 protective specifications
AlkydStructural decline as hybrid acrylic-alkyd systems absorb legacy demand
Polyester & OthersCoil coating and specialty substrate applications driving niche growth


Resin choice increasingly reflects regulatory exposure rather than cost alone. Acrylic remains the volume backbone across decorative and general industrial work, while polyurethane and epoxy dispersions absorb the applications where waterborne technology has historically been rejected. Alkyd's decline is orderly rather than abrupt, mediated by hybrid chemistries that ease reformulation for smaller producers.

By End-User Industry

Sub-SegmentKey Trend
Building & ConstructionRenovation cycles outpacing new build in mature markets
AutomotiveRefinish conversion trailing OEM by roughly a decade, creating growth headroom
General IndustrialHighest price sensitivity and greatest exposure to monomer volatility
Wood & FurnitureIndoor air quality standards accelerating substitution in contract furniture
Marine & ProtectiveBallast-tank and antifouling qualifications opening previously closed applications
Packaging & OthersPFAS-free barrier coatings replacing fluorochemical grease resistance


End-use demand is bifurcating between volume segments that compete on delivered cost and technical segments that reward qualification depth. Construction and general industrial fall in the first camp; marine, protective, and packaging barrier applications in the second. Automotive spans both, with OEM behaving as a technical segment and refinish as a service-led channel.

By Application

Sub-SegmentKey Trend
Architectural / DecorativeTinting infrastructure determining penetration in emerging geographies
Industrial OEM FinishingLine conversion capital pacing adoption at mid-tier manufacturers
Automotive RefinishState-level VOC rule adoption driving North American conversion window
Protective & InfrastructureAgeing asset recoating backlogs sustaining maintenance-led demand
Specialty & FunctionalEV enclosure, antimicrobial, and barrier coatings creating new demand lines


Application-level dynamics explain why regional growth rates diverge from construction indices. Decorative penetration responds to distribution and tinting capability; OEM finishing responds to capital cycles; refinish responds to regulation. Specialty and functional applications remain small but represent the clearest path to margin expansion for suppliers with formulation depth.




Download PDF ×

We do not share your information with anyone. However, we may send you emails based on your report interest from time to time. You may contact us at any time to opt-out.