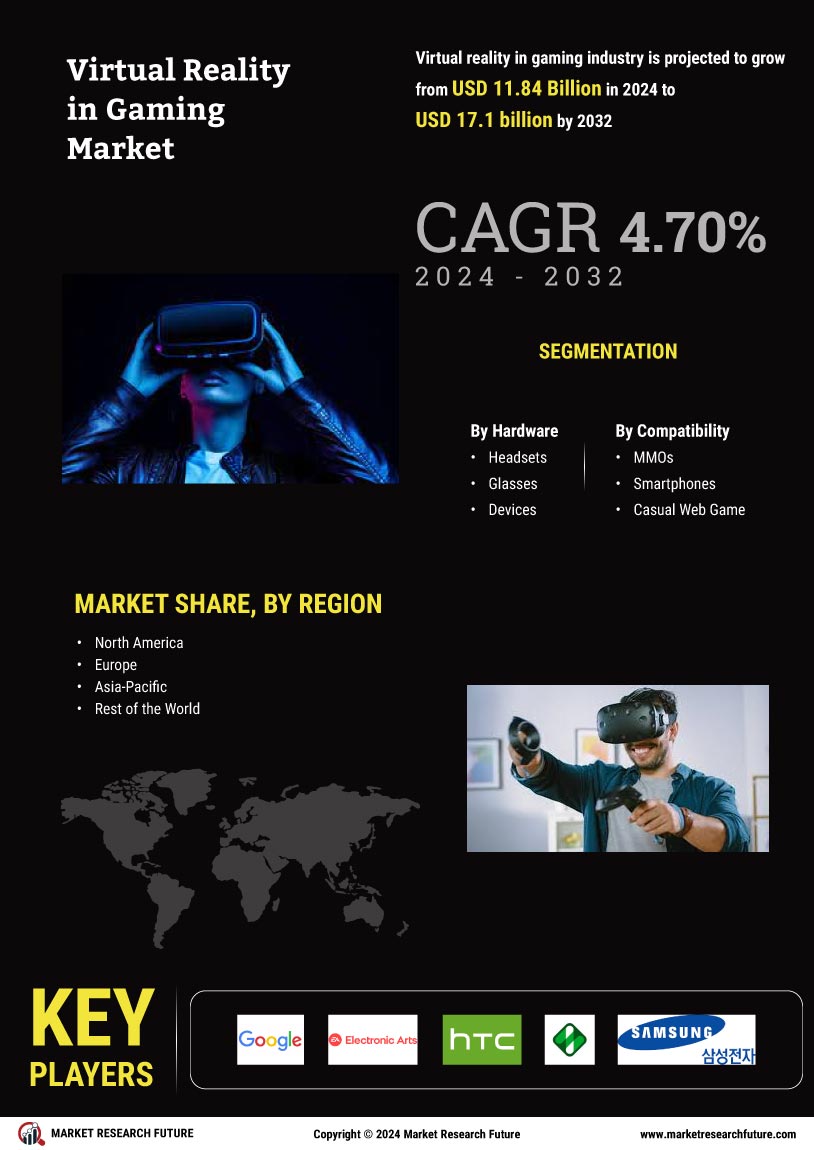
Certified Global Research Member
Isomar fd.webp Wcrc 57.webp
Key Questions Answered
  • Global Market Outlook
  • In-depth analysis of global and regional trends
  • Analyze and identify the major players in the market, their market share, key developments, etc.
  • To understand the capability of the major players based on products offered, financials, and strategies.
  • Identify disrupting products, companies, and trends.
  • To identify opportunities in the market.
  • Analyze the key challenges in the market.
  • Analyze the regional penetration of players, products, and services in the market.
  • Comparison of major players’ financial performance.
  • Evaluate strategies adopted by major players.
  • Recommendations
Why Choose Market Research Future?
  • Vigorous research methodologies for specific market.
  • Knowledge partners across the globe
  • Large network of partner consultants.
  • Ever-increasing/ Escalating data base with quarterly monitoring of various markets
  • Trusted by fortune 500 companies/startups/ universities/organizations
  • Large database of 5000+ markets reports.
  • Effective and prompt pre- and post-sales support.

Virtual Reality in Gaming Market Research Report Information By Hardware (Headsets, Glasses, Devices, and Gloves), By Compatibility (MMOs, Smartphones, Casual Web Games, and Console), And By Region (North America, Europe, Asia-Pacific, And Rest Of The World) – Industry Size, Share and Forecast Till 2032


ID: MRFR/SEM/2181-HCR | 100 Pages | Author: Shubham Munde| April 2024

Virtual Reality in Gaming Market Segmentation


Virtual Reality in Gaming Hardware Outlook (USD Billion, 2019-2032)


  • Headsets


  • Glasses


  • Devices


  • Gloves


  • Others


Virtual Reality in Gaming Compatibility Outlook (USD Billion, 2019-2032)


  • MMOs


  • Smartphones


  • Casual Web Game


  • Console


Virtual Reality in Gaming Regional Outlook (USD Billion, 2019-2032)


  • North America Outlook (USD Billion, 2019-2032)


    • North America Virtual Reality in Gaming by Hardware


      • Headsets


      • Glasses


      • Devices


      • Gloves


      • Others


    • North America Virtual Reality in Gaming by Compatibility


      • MMOs


      • Smartphones


      • Casual Web Game


      • Console


    • US Outlook (USD Billion, 2019-2032)


    • US Virtual Reality in Gaming by Hardware


      • Headsets


      • Glasses


      • Devices


      • Gloves


      • Others


    • US Virtual Reality in Gaming by Compatibility


      • MMOs


      • Smartphones


      • Casual Web Game


      • Console


    • CANADA Outlook (USD Billion, 2019-2032)


    • CANADA Virtual Reality in Gaming by Hardware


      • Headsets


      • Glasses


      • Devices


      • Gloves


      • Others


    • CANADA Virtual Reality in Gaming by Compatibility


      • MMOs


      • Smartphones


      • Casual Web Game


      • Console


  • Europe Outlook (USD Billion, 2019-2032)


    • Europe Virtual Reality in Gaming by Hardware


      • Headsets


      • Glasses


      • Devices


      • Gloves


      • Others


    • Europe Virtual Reality in Gaming by Compatibility


      • MMOs


      • Smartphones


      • Casual Web Game


      • Console


    • Germany Outlook (USD Billion, 2019-2032)


    • Germany Virtual Reality in Gaming by Hardware


      • Headsets


      • Glasses


      • Devices


      • Gloves


      • Others


    • Germany Virtual Reality in Gaming by Compatibility


      • MMOs


      • Smartphones


      • Casual Web Game


      • Console


    • France Outlook (USD Billion, 2019-2032)


    • France Virtual Reality in Gaming by Hardware


      • Headsets


      • Glasses


      • Devices


      • Gloves


      • Other


    • France Virtual Reality in Gaming by Compatibility


      • MMOs


      • Smartphones


      • Casual Web Game


      • Console


    • UK Outlook (USD Billion, 2019-2032)


    • UK Virtual Reality in Gaming by Hardware


      • Headsets


      • Glasses


      • Devices


      • Gloves


      • Others


    • UK Virtual Reality in Gaming by Compatibility


      • MMOs


      • Smartphones


      • Casual Web Game


      • Console


    • ITALY Outlook (USD Billion, 2019-2032)


    • ITALY Virtual Reality in Gaming by Hardware


      • Headsets


      • Glasses


      • Devices


      • Gloves


      • Others


    • ITALY Virtual Reality in Gaming by Compatibility


      • MMOs


      • Smartphones


      • Casual Web Game


      • Console


    • Spain Outlook (USD Billion, 2019-2032)


    • Spain Virtual Reality in Gaming by Hardware


      • Headsets


      • Glasses


      • Devices


      • Gloves


      • Others


    • Spain Virtual Reality in Gaming by Compatibility


      • MMOs


      • Smartphones


      • Casual Web Game


      • Console


    • Rest of Europe Outlook (USD Billion, 2019-2032)


    • Rest of Europe Virtual Reality in Gaming by Hardware


      • Headsets


      • Glasses


      • Devices


      • Gloves


      • Others


    • Rest of Europe Virtual Reality in Gaming by Compatibility


      • MMOs


      • Smartphones


      • Casual Web Game


      • Console


  • Asia Pacific Outlook (USD Billion, 2019-2032)


    • Asia Pacific Virtual Reality in Gaming by Hardware


      • Headsets


      • Glasses


      • Devices


      • Gloves


      • Others


    • Asia Pacific Virtual Reality in Gaming by Compatibility


      • MMOs


      • Smartphones


      • Casual Web Game


      • Console


    • China Outlook (USD Billion, 2019-2032)


    • China Virtual Reality in Gaming by Hardware


      • Headsets


      • Glasses


      • Devices


      • Gloves


      • Others


    • China Virtual Reality in Gaming by Compatibility


      • MMOs


      • Smartphones


      • Casual Web Game


      • Console


    • Japan Outlook (USD Billion, 2019-2032)


    • Japan Virtual Reality in Gaming by Hardware


      • Headsets


      • Glasses


      • Devices


      • Gloves


      • Others


    • Japan Virtual Reality in Gaming by Compatibility


      • MMOs


      • Smartphones


      • Casual Web Game


      • Console


    • India Outlook (USD Billion, 2019-2032)


    • India Virtual Reality in Gaming by Hardware


      • Headsets


      • Glasses


      • Devices


      • Gloves


      • Others


    • India Virtual Reality in Gaming by Compatibility


      • MMOs


      • Smartphones


      • Casual Web Game


      • Console


    • Australia Outlook (USD Billion, 2019-2032)


    • Australia Virtual Reality in Gaming by Hardware


      • Headsets


      • Glasses


      • Devices


      • Gloves


      • Others


    • Australia Virtual Reality in Gaming by Compatibility


      • MMOs


      • Smartphones


      • Casual Web Game


      • Console


    • Rest of Asia Pacific Outlook (USD Billion, 2019-2032)


    • Rest of Asia Pacific Virtual Reality in Gaming by Hardware


      • Headsets


      • Glasses


      • Devices


      • Gloves


      • Others


    • Rest of Asia Pacific Virtual Reality in Gaming by Compatibility


      • MMOs


      • Smartphones


      • Casual Web Game


      • Console


  • Rest of World Outlook (USD Billion, 2019-2032)


    • Rest of World Virtual Reality in Gaming by Hardware


      • Headsets


      • Glasses


      • Devices


      • Gloves


      • Others


    • Rest of World Virtual Reality in Gaming by Compatibility


      • MMOs


      • Smartphones


      • Casual Web Game


      • Console


    • Middle East Outlook (USD Billion, 2019-2032)


    • Middle East Virtual Reality in Gaming by Hardware


      • Headsets


      • Glasses


      • Devices


      • Gloves


      • Others


    • Middle East Virtual Reality in Gaming by Compatibility


      • MMOs


      • Smartphones


      • Casual Web Game


      • Console


    • Africa Outlook (USD Billion, 2019-2032)


    • Africa Virtual Reality in Gaming by Hardware


      • Headsets


      • Glasses


      • Devices


      • Gloves


      • Others


    • Africa Virtual Reality in Gaming by Compatibility


      • MMOs


      • Smartphones


      • Casual Web Game


      • Console


    • Latin America Outlook (USD Billion, 2019-2032)


    • Latin America Virtual Reality in Gaming by Hardware


      • Headsets


      • Glasses


      • Devices


      • Gloves


      • Others


    • Latin America Virtual Reality in Gaming by Compatibility


      • MMOs


      • Smartphones


      • Casual Web Game


      • Console


Leading companies partner with us for data-driven Insights
client_1 client_2 client_3 client_4 client_5 client_6 client_7 client_8 client_9 client_10
Please fill in Business Email for Quick Response

Table Of Contents

1 Market Introduction

1.1 Introduction

1.2 Scope Of Study

1.2.1 Research Objective

1.2.2 Assumptions

1.2.3 Limitations

1.3 Market Structure

2 Research Methodology

2.1 Research Network

2.2 Primary Research

2.3 Secondary Research

2.4 Forecast Model

2.4.1 Market Data Collection, Analysis & Forecast

2.4.2 Market Size Estimation

3 Market Dynamics

3.1 Introduction

3.2 Market Drivers

3.3 Market Challenges

3.4 Market Opportunities

3.5 Market Restraints

4 Executive Summary

5. Market Factor Analysis

5.1 Porter’s Five Forces Analysis

5.2 Supply Chain Analysis

6 Virtual Reality In Gaming Market, By Segments

6.1 Introduction

6.2 Market Statistics

6.2.1 By Hardware

6.2.1.1 Devices

6.2.1.2 Glasses

6.2.1.3 Gloves

6.2.1.4 Headsets

6.2.1.5 Others

6.2.2 By Software

6.2.3 By Compatibility

6.2.3.1 Mmos

6.2.3.2 Smartphones

6.2.3.3 Casual Web Games

6.2.3.4 Box Pc

6.2.3.5 Tablets

6.2.3.6 Consoles

6.2.3.7 Others

6.2.4 By Geography

6.2.4.1 North America

6.2.4.2 Europe

6.2.4.3 Asia-Pacific

6.2.4.4 Rest Of The World

7 Competitive Analysis

7.1 Market Share Analysis

7.2 Company Profiles

7.2.1 Electronic Arts Inc (U.S.)

7.2.2 Google (U.S.)

7.2.3 Htc Corporation (Taiwan)

7.2.4 Oculus Vr, Llc (U.S.)

7.2.5 Newzoo (Netheralnds)

7.2.6 Samsung (South Korea)

7.2.7 Sony Corporation (Japan)

7.2.8 Zeiss International (Germany)

7.2.9 Leap Motion, Inc. (U.S.)

7.2.10 Virzoom, Inc (U.S.)

7.2.11 Kaneva (U.S.)

7.2.12 Others

List Of Tables

Table 1 Virtual Reality In Gaming Market, By Compatibility

Table 2 Virtual Reality In Gaming Market, By Hardware

Table 3 Virtual Reality In Gaming Market, By Software

Table 4 Virtual Reality In Gaming Market, By Geography

Table 5 North America Virtual Reality In Gaming Market, By Compatibility

Table 6 North America Virtual Reality In Gaming Market, By Hardware

Table 7 North America Virtual Reality In Gaming Market, By Hardware

Table 8 U.S Virtual Reality In Gaming Market, By Compatibility

Table 9 U.S. Virtual Reality In Gaming Market, By Hardware

Table 10 U.S. Virtual Reality In Gaming Market, By Hardware

Table 11 Canada Virtual Reality In Gaming Market, By Compatibility

Table 12 Canada Virtual Reality In Gaming Market, By Hardware

Table 13 Canada Virtual Reality In Gaming Market, By Software

Table 14 Europe Virtual Reality In Gaming Market, By Compatibility

Table 15 Europe Virtual Reality In Gaming Market, By Hardware

Table 16 Europe Virtual Reality In Gaming Market, By Software

Table 17 Germany Virtual Reality In Gaming Market, By Compatibility

Table 18 Germany Virtual Reality In Gaming Market, By Hardware

Table 19 Germany Virtual Reality In Gaming Market, By Software

Table 20 France Virtual Reality In Gaming Market, By Compatibility

Table 21 France Virtual Reality In Gaming Market, By Hardware

Table 2 2 France Virtual Reality In Gaming Market, By Software

Table 23 U.K. Virtual Reality In Gaming Market, By Compatibility

Table 24 U.K. Virtual Reality In Gaming Market, By Hardware

Table 2 5 U.K Virtual Reality In Gaming Market, By Software

Table 26 Rest Of Europe Virtual Reality In Gaming Market, By Compatibility

Table 27 Rest Of Europe Virtual Reality In Gaming Market, By Hardware

Table 2 8 Rest Of Europe Virtual Reality In Gaming Market, By Software

Table 29 Asia-Pacific Virtual Reality In Gaming Market, By Compatibility

Table 30 Asia-Pacific Virtual Reality In Gaming Market, By Hardware

Table 31 Asia-Pacific Virtual Reality In Gaming Market, By Software

Table 32 Rest Of The World Virtual Reality In Gaming Market, By Compatibility

Table 33 Rest Of The World Virtual Reality In Gaming Market, By Hardware

Table 34 Rest Of The World Virtual Reality In Gaming Market, By Software

List Of Figures

Figure 1 Research Methodology

Figure 2 Virtual Reality In Gaming Market, By Compatibility (%)

Figure 3 Virtual Reality In Gaming Market, By Hardware (%)

Figure 4 Virtual Reality In Gaming Market, By Software (%)

Figure 5 Virtual Reality In Gaming Market, By Regions (%)

Figure 6 North America Virtual Reality In Gaming Market, By Compatibility (%)

Figure 7 North America Virtual Reality In Gaming Market, By Hardware (%)

Figure 8 North America Virtual Reality In Gaming Market, By Software (%)

Figure 9 Europe Virtual Reality In Gaming Market, By Compatibility (%)

Figure 10 Europe Virtual Reality In Gaming Market, By Hardware (%)

Figure 11 Europe Virtual Reality In Gaming Market, By Software (%)

Figure 12 Asia-Pacific Virtual Reality In Gaming Market, By Compatibility (%)

Figure 13 Asia-Pacific Virtual Reality In Gaming Market, By Hardware (%)

Figure 14 Asia-Pacific Virtual Reality In Gaming Market, By Software (%)

Figure 15 Rest Of The World Virtual Reality In Gaming Market, By Compatibility (%)

Figure 16 Rest Of The World Virtual Reality In Gaming Market, By Hardware (%)

Figure 17 Rest Of The World Virtual Reality In Gaming Market, By Software (%)

Purchase Option
Single User $ 4,950
Multiuser License $ 5,950
Enterprise User $ 7,250
Compare Licenses
Tailored for You
  • Dedicated Research on any specifics segment or region.
  • Focused Research on specific players in the market.
  • Custom Report based only on your requirements.
  • Flexibility to add or subtract any chapter in the study.
  • Historic data from 2014 and forecasts outlook till 2040.
  • Flexibility of providing data/insights in formats (PDF, PPT, Excel).
  • Provide cross segmentation in applicable scenario/markets.