Table of Contents
1. EXECUTIVE SUMMARY
1.1. Market Attractiveness Analysis
1.1.1. Global Virtual Dressing Room Market, by Component
1.1.2. Global Virtual Dressing Room Market, by End User
1.1.3. Global Virtual Dressing Room Market, by Region
2. MARKET INTRODUCTION
2.1. Definition
2.2. Scope of the Study
2.3. Market Structure
2.4. Key Buying Criteria
2.5. Macro Factor Indicator Analysis
3. RESEARCH METHODOLOGY
3.1. Research Process
3.2. Primary Research
3.3. Secondary Research
3.4. Market Size Estimation
3.5. Forecast Model
3.6. List of Assumptions
4. MARKET DYNAMICS
4.1. Introduction
4.2. Drivers
4.2.1. Increasing Investments in Virtual Fitting Room Kiosks by Retail Stores
4.2.2. Growth in E-Commerce
4.3. Restraints
4.3.1. High Costs of Virtual Dressing Rooms
4.4. Opportunities
4.4.1. Expansion in Emerging Economies
β
5. MARKET FACTOR ANALYSIS
5.1. Value Chain Analysis/Supply Chain Analysis
5.2. Porterβs Five Forces Model
5.2.1. Bargaining Power of Suppliers
5.2.2. Bargaining Power of Buyers
5.2.3. Threat of New Entrants
5.2.4. Threat of Substitutes
5.2.5. Intensity of Rivalry
6. GLOBAL VIRTUAL DRESSING ROOM MARKET, BY COMPONENT
6.1. Introduction
6.2. Solutions
6.2.1. Kiosks
6.2.2. Software
6.3. Services
6.3.1. Consulting
6.3.2. Integration & Maintenance
7. GLOBAL VIRTUAL DRESSING ROOM MARKET, BY END USER
7.1. Introduction
7.2. E-Commerce
7.3. Physical Stores
7.3.1. Apparel
7.3.2. Accessories
8. GLOBAL VIRTUAL DRESSING ROOM MARKET, BY REGION
8.1. Introduction
8.2. North America
8.2.1. US
8.2.2. Canada
8.2.3. Mexico
8.3. Europe
8.3.1. Germany
8.3.2. France
8.3.3. UK
8.3.4. Rest of Europe
8.4. Asia-Pacific
8.4.1. China
8.4.2. India
8.4.3. Japan
8.4.4. Rest of Asia-Pacific
8.5. Middle East & Africa
8.6. South America
9. COMPETITIVE LANDSCAPE
9.1. Introduction
9.2. Competitive Analysis
10. COMPANY PROFILES
10.1. SenseMi
10.1.1. Company Overview
10.1.2. Financial Overview
10.1.3. Products Offered
10.1.4. Key Developments
10.1.5. SWOT Analysis
10.1.6. Key Strategies
10.2. Zugara, Inc.
10.2.1. Company Overview
10.2.2. Financial Overview
10.2.3. Products Offered
10.2.4. Key Developments
10.2.5. SWOT Analysis
10.2.6. Key Strategies
10.3. Coitor IT Tech
10.3.1. Company Overview
10.3.2. Financial Overview
10.3.3. Products Offered
10.3.4. Key Developments
10.3.5. SWOT Analysis
10.3.6. Key Strategies
10.4. REACTIVE REALITY GMBH
10.4.1. Company Overview
10.4.2. Financial Overview
10.4.3. Products Offered
10.4.4. Key Developments
10.4.5. SWOT Analysis
10.4.6. Key Strategies
10.5. Fit Analytics
10.5.1. Company Overview
10.5.2. Financial Overview
10.5.3. Products Offered
10.5.4. Key Developments
10.5.5. SWOT Analysis
10.5.6. Key Strategies
10.6. 3D-A-PORTER LTD.
10.6.1. Company Overview
10.6.2. Financial Overview
10.6.3. Products Offered
10.6.4. Key Developments
10.6.5. SWOT Analysis
10.6.6. Key Strategies
10.7. triMirror
10.7.1. Company Overview
10.7.2. Financial Overview
10.7.3. Products Offered
10.7.4. Key Developments
10.7.5. SWOT Analysis
10.7.6. Key Strategies
10.8. Dressformer
10.8.1. Company Overview
10.8.2. Financial Overview
10.8.3. Products Offered
10.8.4. Key Developments
10.8.5. SWOT Analysis
10.8.6. Key Strategies
10.9. 3DLOOK Inc.
10.9.1. Company Overview
10.9.2. Financial Overview
10.9.3. Products Offered
10.9.4. Key Developments
10.9.5. SWOT Analysis
10.9.6. Key Strategies
10.10. ELSE Corp srl
10.10.1. Company Overview
10.10.2. Financial Overview
10.10.3. Products Offered
10.10.4. Key Developments
10.10.5. SWOT Analysis
10.10.6. Key Strategies
10.11. Elpro Technologies
10.11.1. Company Overview
10.11.2. Financial Overview
10.11.3. Products Offered
10.11.4. Key Developments
10.11.5. SWOT Analysis
10.11.6. Key Strategies
10.12. Fitle
10.12.1. Company Overview
10.12.2. Financial Overview
10.12.3. Products Offered
10.12.4. Key Developments
10.12.5. SWOT Analysis
10.12.6. Key Strategies
10.13. Fitnect Interactive
10.13.1. Company Overview
10.13.2. Financial Overview
10.13.3. Products Offered
10.13.4. Key Developments
10.13.5. SWOT Analysis
10.13.6. Key Strategies
10.14. True Fit Corporation
10.14.1. Company Overview
10.14.2. Financial Overview
10.14.3. Products Offered
10.14.4. Key Developments
10.14.5. SWOT Analysis
10.14.6. Key Strategie
10.15. SIZEBAY
10.15.1. Company Overview
10.15.2. Financial Overview
10.15.3. Products Offered
10.15.4. Key Developments
10.15.5. SWOT Analysis
10.15.6. Key Strategie
11. APPENDIX
11.1.1. Discussion Blueprint
NOTE:
This table of content is tentative & subject to change as the research progresses.
ο‘ In section 14, only the top ten companies will be profiled. Each company will be profiled based on the market overview, financials, product portfolio, business strategies, & recent developments parameters.
ο‘ Please note: The financial details of the company cannot be provided if the information is not available in the public domain & or from reliable sources.
β
LIST OF TABLES
TABLE 1 LIST OF ASSUMPTIONS
TABLE 2 GLOBAL VIRTUAL DRESSING ROOM MARKET, BY COMPONENT, 2020β2027 (USD MILLION)
TABLE 3 GLOBAL VIRTUAL DRESSING ROOM MARKET, BY END USER, 2020β2027 (USD MILLION)
TABLE 4 GLOBAL VIRTUAL DRESSING ROOM MARKET, BY REGION, 2020β2027 (USD MILLION)
TABLE 5 NORTH AMERICA: VIRTUAL DRESSING ROOM MARKET, BY COUNTRY, 2020β2027 (USD MILLION)
TABLE 6 NORTH AMERICA: VIRTUAL DRESSING ROOM MARKET, BY COMPONENT, 2020β2027 (USD MILLION)
TABLE 7 NORTH AMERICA: VIRTUAL DRESSING ROOM MARKET, BY END USER, 2020β2027 (USD MILLION)
TABLE 8 US: VIRTUAL DRESSING ROOM MARKET, BY COMPONENT, 2020β2027 (USD MILLION)
TABLE 9 US: VIRTUAL DRESSING ROOM MARKET, BY END USER, 2020β2027 (USD MILLION)
TABLE 10 CANADA: VIRTUAL DRESSING ROOM MARKET, BY COMPONENT, 2020β2027 (USD MILLION)
TABLE 11 CANADA: VIRTUAL DRESSING ROOM MARKET, BY END USER, 2020β2027 (USD MILLION)
TABLE 12 MEXICO: VIRTUAL DRESSING ROOM MARKET, BY COMPONENT, 2020β2027 (USD MILLION)
TABLE 13 MEXICO: VIRTUAL DRESSING ROOM MARKET, BY END USER, 2020β2027 (USD MILLION)
TABLE 14 EUROPE: VIRTUAL DRESSING ROOM MARKET, BY COUNTRY, 2020β2027 (USD MILLION)
TABLE 15 EUROPE: VIRTUAL DRESSING ROOM MARKET, BY COMPONENT, 2020β2027 (USD MILLION)
TABLE 16 EUROPE: VIRTUAL DRESSING ROOM MARKET, BY END USER, 2020β2027 (USD MILLION)
TABLE 17 UK: VIRTUAL DRESSING ROOM MARKET, BY COMPONENT, 2020β2027 (USD MILLION)
TABLE 18 UK: VIRTUAL DRESSING ROOM MARKET, BY END USER, 2020β2027 (USD MILLION)
TABLE 19 GERMANY: VIRTUAL DRESSING ROOM MARKET, BY COMPONENT, 2020β2027 (USD MILLION)
TABLE 20 GERMANY: VIRTUAL DRESSING ROOM MARKET, BY END USER, 2020β2027 (USD MILLION)
TABLE 21 FRANCE: VIRTUAL DRESSING ROOM MARKET, BY COMPONENT, 2020β2027 (USD MILLION)
TABLE 22 FRANCE: VIRTUAL DRESSING ROOM MARKET, BY END USER, 2020β2027 (USD MILLION)
TABLE 23REST OF EUROPE: VIRTUAL DRESSING ROOM MARKET, BY COMPONENT, 2020β2027 (USD MILLION)
TABLE 24REST OF EUROPE: VIRTUAL DRESSING ROOM MARKET, BY END USER, 2020β2027 (USD MILLION)
TABLE 25ASIA-PACIFIC: VIRTUAL DRESSING ROOM MARKET, BY COUNTRY, 2020β2027 (USD MILLION)
TABLE 26ASIA-PACIFIC: VIRTUAL DRESSING ROOM MARKET, BY COMPONENT, 2020β2027 (USD MILLION)
TABLE 27ASIA-PACIFIC: VIRTUAL DRESSING ROOM MARKET, BY END USER, 2020β2027 (USD MILLION)
TABLE 28CHINA: VIRTUAL DRESSING ROOM MARKET, BY COMPONENT, 2020β2027 (USD MILLION)
TABLE 29CHINA: VIRTUAL DRESSING ROOM MARKET, BY END USER, 2020β2027 (USD MILLION)
TABLE 30INDIA: VIRTUAL DRESSING ROOM MARKET, BY COMPONENT, 2020β2027 (USD MILLION)
TABLE 31INDIA: VIRTUAL DRESSING ROOM MARKET, BY END USER, 2020β2027 (USD MILLION)
TABLE 32JAPAN: VIRTUAL DRESSING ROOM MARKET, BY COMPONENT, 2020β2027 (USD MILLION)
TABLE 33JAPAN: VIRTUAL DRESSING ROOM MARKET, BY END USER, 2020β2027 (USD MILLION)
TABLE 34REST OF ASIA-PACIFIC: VIRTUAL DRESSING ROOM MARKET, BY COMPONENT, 2020β2027 (USD MILLION)
TABLE 35REST OF ASIA-PACIFIC: VIRTUAL DRESSING ROOM MARKET, BY END USER, 2020β2027 (USD MILLION)
TABLE 36MIDDLE EAST & AFRICA: VIRTUAL DRESSING ROOM MARKET, BY COMPONENT, 2020β2027 (USD MILLION)
TABLE 37MIDDLE EAST & AFRICA: VIRTUAL DRESSING ROOM MARKET, BY END USER, 2020β2027 (USD MILLION)
TABLE 38SOUTH AMERICA: VIRTUAL DRESSING ROOM MARKET, BY COMPONENT, 2020β2027 (USD MILLION)
TABLE 39SOUTH AMERICA: VIRTUAL DRESSING ROOM MARKET, BY END USER, 2020β2027 (USD MILLION)
β
LIST OF FIGURES
FIGURE 1MARKET SYNOPSIS
FIGURE 2RESEARCH PROCESS OF MRFR
FIGURE 3TOP DOWN & BOTTOMβUP APPROACHES
FIGURE 4GLOBAL VIRTUAL DRESSING ROOM MARKET, BY COMPONENT, 2020β2027 (USD MILLION)
FIGURE 5GLOBAL VIRTUAL DRESSING ROOM MARKET, BY END USER, 2020β2027 (USD MILLION)
FIGURE 6GLOBAL VIRTUAL DRESSING ROOM MARKET, BY REGION, 2020β2027 (USD MILLION))
FIGURE 7NORTH AMERICA: VIRTUAL DRESSING ROOM MARKET, BY COUNTRY, 2020β2027 (USD MILLION)
FIGURE 8NORTH AMERICA: VIRTUAL DRESSING ROOM MARKET, BY COMPONENT, 2020β2027 (USD MILLION)
FIGURE 9NORTH AMERICA: VIRTUAL DRESSING ROOM MARKET, BY END USER, 2020β2027 (USD MILLION)
FIGURE 10EUROPE: VIRTUAL DRESSING ROOM MARKET, BY COUNTRY, 2020β2027 (USD MILLION)
FIGURE 11EUROPE: VIRTUAL DRESSING ROOM MARKET, BY COMPONENT, 2020β2027 (USD MILLION)
FIGURE 12EUROPE: VIRTUAL DRESSING ROOM MARKET, BY END USER, 2020β2027 (USD MILLION)
FIGURE 13ASIA-PACIFIC: VIRTUAL DRESSING ROOM MARKET, BY COUNTRY, 2020β2027 (USD MILLION)
FIGURE 14ASIA-PACIFIC: VIRTUAL DRESSING ROOM MARKET, BY COMPONENT, 2020β2027 (USD MILLION)
FIGURE 15ASIA-PACIFIC: VIRTUAL DRESSING ROOM MARKET, BY END USER, 2020β2027 (USD MILLION)
FIGURE 16MIDDLE EAST & AFRICA: VIRTUAL DRESSING ROOM MARKET, BY COMPONENT, 2020β2027 (USD MILLION)
FIGURE 17MIDDLE EAST & AFRICA: VIRTUAL DRESSING ROOM MARKET, BY END USER, 2020β2027 (USD MILLION)
FIGURE 18SOUTH AMERICA: VIRTUAL DRESSING ROOM MARKET, BY COMPONENT, 2020β2027 (USD MILLION)
FIGURE 19SOUTH AMERICA: VIRTUAL DRESSING ROOM MARKET, BY END USER, 2020β2027 (USD MILLION)
$6.81 Billion
15.21%
North America
2020-2027
Market Forecast
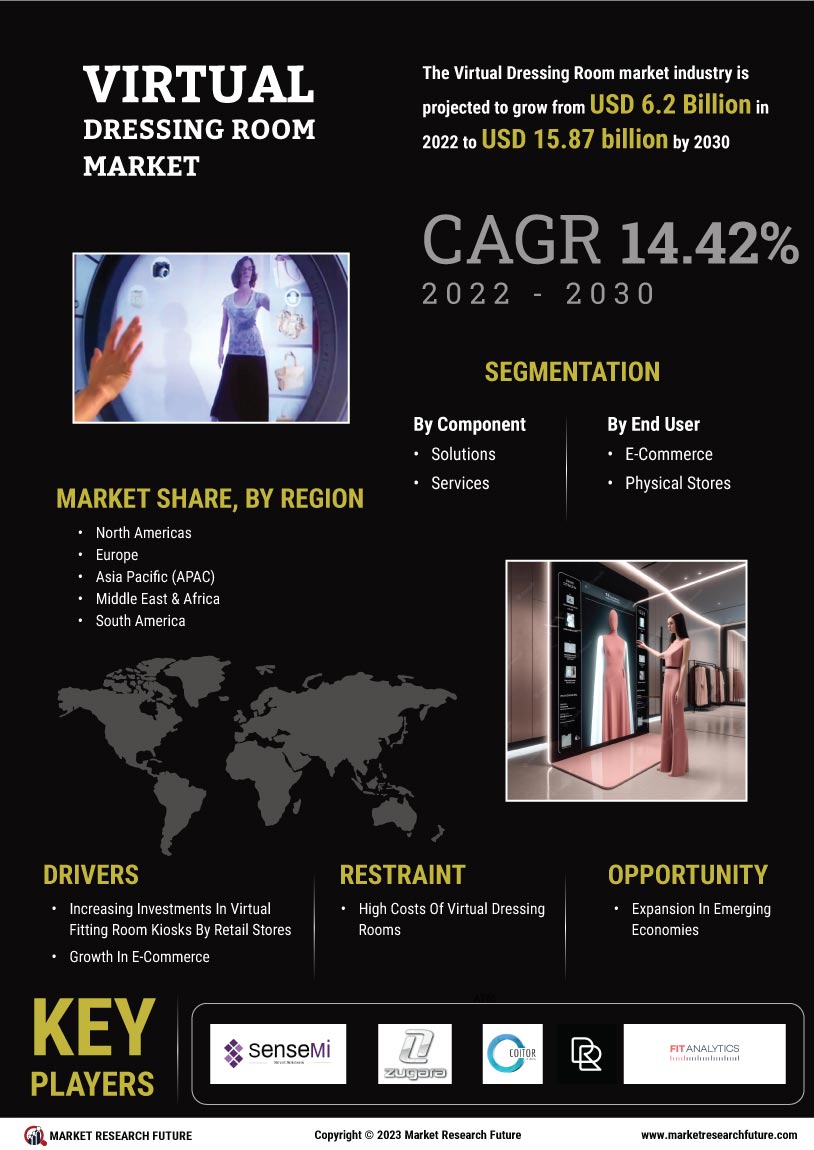
Global Virtual Dressing Room Market is expected to cross USD 6.81 Billion by 2025 at a CAGR of 15.21%.
Market Synopsis
Virtual dressing rooms are being increasingly used instead of the traditional dressing rooms due to their speed and efficiency. The advantages they offer are so overwhelming that the technology is bound to replace dressing rooms. An increasing number of retailers are now opting for virtual dressing room technology and it is invaluable for e-commerce as it allows customers to select clothing online without reservations about the fit or the look. The biggest disadvantage that faced e-retailers of clothing was that customers could not actively gauge how the clothes looked on them; the advent of virtual dressing rooms is changing that. This also affords vendors the option of reducing repetition of cloth items in their visible inventory, which can now be stacked with different items and products. Increasing digitalization is also enhancing the customer base who can now try on clothes virtually, enhancing sales.
Market USP
Unique solution geared towards e-purchases as well as an improvement over traditional dressing rooms.
Market Drivers
Market Restraints
Segmentation
By Component
By End User
By Region
Key Players
Report Attribute/Metric | Details |
---|---|
Market Size | USD 6.81 Billion (2025) |
CAGR | 15.21% (2018-2025) |
Base Year | 2019 |
Forecast Period | 2020-2027 |
Historical Data | 2018 |
Forecast Units | Value (USD Billion) |
Report Coverage | Revenue Forecast, Competitive Landscape, Growth Factors, and Trends |
Segments Covered | By Component |
Geographies Covered | North America, Europe, Asia-Pacific, and Rest of the World (RoW) |
Key Vendors | SenseMi, Zugara, Inc., Coitor IT Tech, REACTIVE REALITY GMBH, Fit Analytics, 3D-A-PORTER LTD., triMirror, Dressformer, 3DLOOK Inc, ELSE Corp srl, Elpro Technologies, Fitle, Fitnect Interactive, True Fit Corporation, SIZEBAY |
Key Market Opportunities | Middle East & Africa: A small market, it nonetheless offers excellent opportunities for physical stores to implement virtual dressing rooms for the benefit of its customer base. |
Key Market Drivers |
|
Frequently Asked Questions (FAQ) :
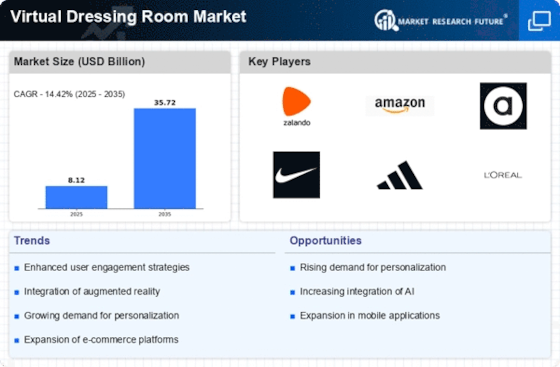
Global virtual dressing room market is projected to grow at approximately 15.21% CAGR during the assessment period (2019-2025).
The valuation of the global virtual dressing room market is estimated to increase to USD 6.81 BN by the end of 2025.
Increasing adoption of the technology due to its advantages and the proliferating retail & e-commerce sectors worldwide, are major tailwinds pushing the growth of the global virtual dressing room market.
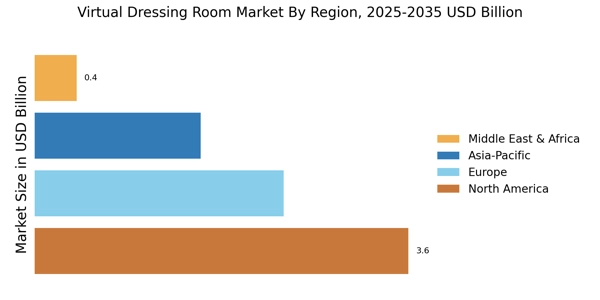
North America holds the largest share in the global virtual dressing room market, followed by Europe and the Asia Pacific region, respectively.
SenseMi, Zugara, Inc., Coitor IT Tech, Reactive Reality GMBH, Fit Analytics, 3D-A-PORTER LTD., triMirror, Dressformer, 3DLOOK Inc., ELSE Corp srl, Elpro Technologies, Fitle, Fitnect Interactive, True Fit Corporation, and SIZEBAY, are some of the top players operating in the global virtual dressing room market.