Video on Demand Market Segmentation
Video on Demand Market By Content Type (USD Billion, 2025-2035)
- Movies
- TV Shows
- Documentaries
- Sports
- Kid's Content
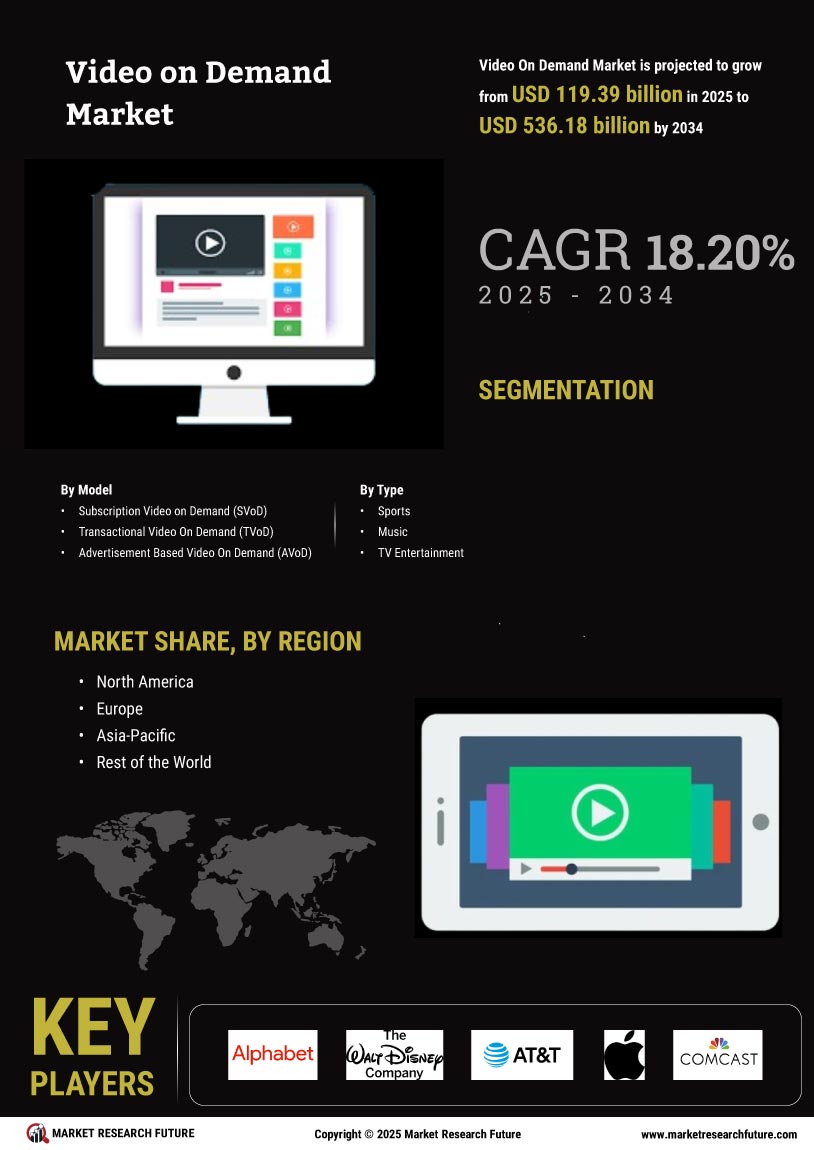
Video on Demand Market By Subscription Model (USD Billion, 2025-2035)
- Subscription Video On Demand
- Transactional Video On Demand
- Ad-Supported Video On Demand
Video on Demand Market By Device Type (USD Billion, 2025-2035)
- Smart TVs
- Mobile Devices
- Tablets
- Laptops
- Desktop Computers
Video on Demand Market By End User (USD Billion, 2025-2035)
- Individual Users
- Corporate Users
- Educational Institutions