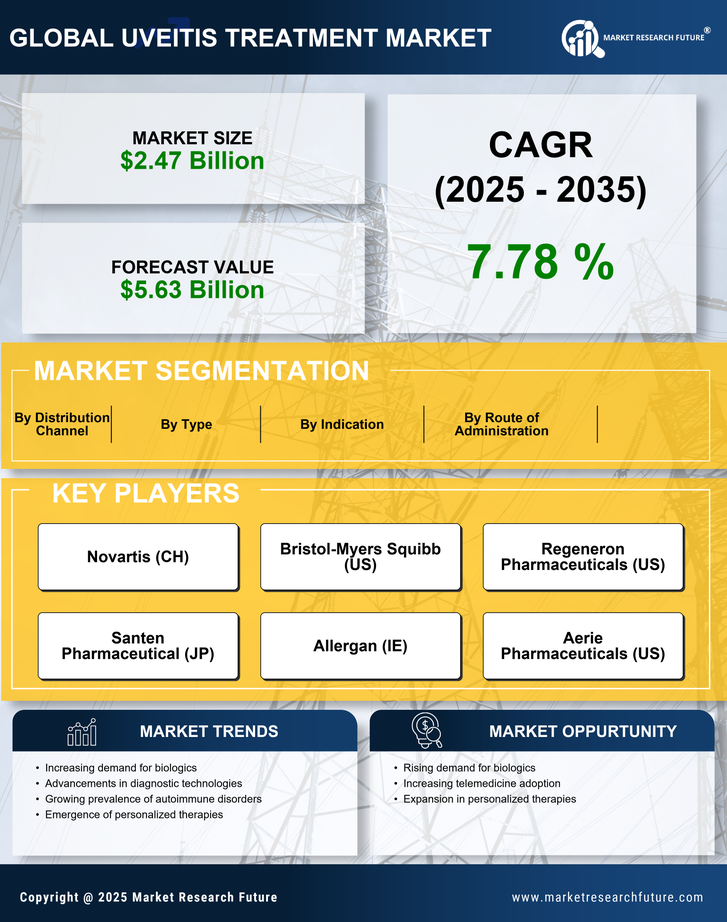
Certified Global Research Member
Isomar fd.webp Wcrc 57.webp
Key Questions Answered
  • Global Market Outlook
  • In-depth analysis of global and regional trends
  • Analyze and identify the major players in the market, their market share, key developments, etc.
  • To understand the capability of the major players based on products offered, financials, and strategies.
  • Identify disrupting products, companies, and trends.
  • To identify opportunities in the market.
  • Analyze the key challenges in the market.
  • Analyze the regional penetration of players, products, and services in the market.
  • Comparison of major players’ financial performance.
  • Evaluate strategies adopted by major players.
  • Recommendations
Why Choose Market Research Future?
  • Vigorous research methodologies for specific market.
  • Knowledge partners across the globe
  • Large network of partner consultants.
  • Ever-increasing/ Escalating data base with quarterly monitoring of various markets
  • Trusted by fortune 500 companies/startups/ universities/organizations
  • Large database of 5000+ markets reports.
  • Effective and prompt pre- and post-sales support.

Uveitis Treatment Market Research Report Information By Type (Anterior Uveitis, Intermediate Uveitis, Posterior Uveitis, Others), Drug Class (Corticosteroids Drugs, Anti-Inflammatory Drugs, Immunosuppressive Drugs) and End-User (Hospitals, Specialty Clinics)- Forecast to 2032


ID: MRFR/HC/6985-HCR | 125 Pages | Author: Rahul Gotadki| April 2024
Leading companies partner with us for data-driven Insights
client_1 client_2 client_3 client_4 client_5 client_6 client_7 client_8 client_9 client_10
Please fill in Business Email for Quick Response

Table of Contents

1. REPORT PROLOGUE

2. MARKET INTRODUCTION

2.1. Definition

2.2. Scope of the Study

2.2.1. Research Objective

2.2.2. Assumptions

2.2.3. Limitations

3. RESEARCH METHODOLOGY

3.1. Overview

3.2. Primary Research

3.3. Secondary Research

3.4. Market Size Estimation

4. MARKET DYNAMICS

4.1. Overview

4.2. Drivers

4.3. Restraints

4.4. Opportunities

5. MARKET FACTOR ANALYSIS

5.1. Porter’s Five Forces Analysis

5.1.1. Bargaining Power of Suppliers

5.1.2. Bargaining Power of Buyers

5.1.3. Threat of New Entrants

5.1.4. Threat of Substitutes

5.1.5. Intensity of Rivalry

5.2. Value Chain Analysis/Supply Chain Analysis

6. GLOBAL UVEITIS TREATMENT MARKET, BY TYPE

6.1. Overview

6.2. Anterior Uveitis

Market Estimates & Forecast, by Region, 2023-2032

Market Estimates & Forecast, by Country, 2023-2032

6.3. Intermediate Uveitis

Market Estimates & Forecast, by Region, 2023-2032

Market Estimates & Forecast, by Country, 2023-2032

6.4. Posterior Uveitis

Market Estimates & Forecast, by Region, 2023-2032

Market Estimates & Forecast, by Country, 2023-2032

6.5. Others

Market Estimates & Forecast, by Region, 2023-2032

Market Estimates & Forecast, by Country, 2023-2032

7. GLOBAL UVEITIS TREATMENT MARKET, BY DRUG CLASS

7.1. Overview

7.2. Corticosteroids Drugs

Market Estimates & Forecast, by Region, 2023-2032

Market Estimates & Forecast, by Country, 2023-2032

7.3. Anti-Inflammatory Drugs

Market Estimates & Forecast, by Region, 2023-2032

Market Estimates & Forecast, by Country, 2023-2032

7.4. Immunosuppressive Drugs

Market Estimates & Forecast, by Region, 2023-2032

Market Estimates & Forecast, by Country, 2023-2032

7.5. Others

Market Estimates & Forecast, by Region, 2023-2032

Market Estimates & Forecast, by Country, 2023-2032

8. GLOBAL UVEITIS TREATMENT MARKET, BY END USER

8.1. Overview

8.2. Hospitals

Market Estimates & Forecast, by Region, 2023-2032

Market Estimates & Forecast, by Country, 2023-2032

8.3. Specialty Clinics

Market Estimates & Forecast, by Region, 2023-2032

Market Estimates & Forecast, by Country, 2023-2032

8.4. Others

Market Estimates & Forecast, by Region, 2023-2032

Market Estimates & Forecast, by Country, 2023-2032

9. GLOBAL UVEITIS TREATMENT MARKET, BY REGION

9.1. Overview

9.2. Americas

9.2.1. North America

9.2.1.1. US

9.2.1.2. Canada

9.2.2. Latin America

9.3. Europe

9.3.1. Western Europe

9.3.1.1. Germany

9.3.1.2. France

9.3.1.3. Italy

9.3.1.4. Spain

9.3.1.5. UK

9.3.1.6. Rest of Western Europe

9.3.2. Eastern Europe

9.4. Asia-Pacific

9.4.1. Japan

9.4.2. China

9.4.3. India

9.4.4. Australia

9.4.5. South Korea

9.4.6. Rest of Asia-Pacific

9.5. Middle East & Africa

9.5.1. Middle East

9.5.2. Africa

10. COMPANY LANDSCAPE

10.1.1. Overview

10.1.2. Competitive Analysis

10.1.3. Market Share Analysis

10.1.4. Major Growth Strategy in the global uveitis treatment market

10.1.5. Competitive Benchmarking

10.1.6. Leading Player in terms of Number of Developments in global uveitis treatment market

10.1.7. Key Developments & Growth Strategies

10.1.7.1. Product Launch

10.1.7.2. Merger & Acquisition

10.1.7.3. Joint Ventures

10.1.8. Major Players Financial Matrix

10.1.8.1. Sales & Operating Income 2023

10.1.8.2. Major Players R&D Expenditure 2023

11. COMPANY PROFILES

11.1. Allergan PLC

11.1.1. Company Overview

11.1.2. Product Type Overview

11.1.3. Financial Overview

11.1.4. Key Developments

11.1.5. SWOT Analysis

11.1.6. Key Strategies

11.2. Novartis AG

11.2.1. Company Overview

11.2.2. Product Type Overview

11.2.3. Financial Overview

11.2.4. Key Developments

11.2.5. SWOT Analysis

11.2.6. Key Strategies

11.3. Bausch Health

11.3.1. Company Overview

11.3.2. Product Type Overview

11.3.3. Financial Overview

11.3.4. Key Developments

11.3.5. SWOT Analysis

11.3.6. Key Strategies

11.4. EyePoint Pharmaceuticals, Inc.

11.4.1. Company Overview

11.4.2. Product Type Overview

11.4.3. Financial Overview

11.4.4. Key Developments

11.4.5. SWOT Analysis

11.4.6. Key Strategies

11.5. AbbVie Inc.

11.5.1. Company Overview

11.5.2. Product Type Overview

11.5.3. Financial Overview

11.5.4. Key Developments

11.5.5. SWOT Analysis

11.5.6. Key Strategies

11.6. Horizon Therapeutics PLC

11.6.1. Company Overview

11.6.2. Product Type Overview

11.6.3. Financial Overview

11.6.4. Key Developments

11.6.5. SWOT Analysis

11.6.6. Key Strategies

11.7. Mylan NV

11.7.1. Company Overview

11.7.2. Product Type Overview

11.7.3. Financial Overview

11.7.4. Key Developments

11.7.5. SWOT Analysis

11.7.6. Key Strategies

11.8. Alimera Sciences

11.8.1. Company Overview

11.8.2. Product Type Overview

11.8.3. Financial Overview

11.8.4. Key Developments

11.8.5. SWOT Analysis

11.8.6. Key Strategies

11.9. Others

12. APPENDIX

12.1. References

12.2. Related Reports

LIST OF TABLES

TABLE 1 GLOBAL UVEITIS TREATMENT MARKET SYNOPSIS, 2023-2032

TABLE 2 GLOBAL UVEITIS TREATMENT MARKET ESTIMATES & FORECAST, 2023-2032(USD MILLION)

TABLE 3 GLOBAL UVEITIS TREATMENT MARKET, BY TYPE, 2023-2032(USD MILLION)

TABLE 4 GLOBAL UVEITIS TREATMENT MARKET, BY DRUG CLASS, 2023-2032(USD MILLION)

TABLE 5 GLOBAL UVEITIS TREATMENT MARKET, BY END USER, 2023-2032(USD MILLION)

TABLE 6 GLOBAL UVEITIS TREATMENT MARKET, BY REGION, 2023-2032(USD MILLION)

TABLE 7 NORTH AMERICA: UVEITIS TREATMENT MARKET, BY TYPE, 2023-2032(USD MILLION)

TABLE 8 NORTH AMERICA: UVEITIS TREATMENT MARKET, BY DRUG CLASS, 2023-2032(USD MILLION)

TABLE 9 NORTH AMERICA: UVEITIS TREATMENT MARKET, BY END USER, 2023-2032(USD MILLION)

TABLE 10 US: UVEITIS TREATMENT MARKET, BY TYPE, 2023-2032(USD MILLION)

TABLE 11 US: UVEITIS TREATMENT MARKET, BY DRUG CLASS, 2023-2032(USD MILLION)

TABLE 12 US: UVEITIS TREATMENT MARKET, BY END USER, 2023-2032(USD MILLION)

TABLE 13 CANADA: UVEITIS TREATMENT MARKET, BY TYPE, 2023-2032(USD MILLION)

TABLE 14 CANADA: UVEITIS TREATMENT MARKET, BY DRUG CLASS, 2023-2032(USD MILLION)

TABLE 15 CANADA: UVEITIS TREATMENT MARKET, BY END USER, 2023-2032(USD MILLION)

TABLE 16 LATIN AMERICA: UVEITIS TREATMENT MARKET, BY TYPE, 2023-2032(USD MILLION)

TABLE 17 LATIN AMERICA: UVEITIS TREATMENT MARKET, BY DRUG CLASS, 2023-2032(USD MILLION)

TABLE 18 LATIN AMERICA: UVEITIS TREATMENT MARKET, BY END USER, 2023-2032(USD MILLION)

TABLE 19 EUROPE: UVEITIS TREATMENT MARKET, BY TYPE, 2023-2032(USD MILLION)

TABLE 20 EUROPE: UVEITIS TREATMENT MARKET, BY DRUG CLASS, 2023-2032(USD MILLION)

TABLE 21 EUROPE: UVEITIS TREATMENT MARKET, BY END USER, 2023-2032(USD MILLION)

TABLE 22 WESTERN EUROPE: UVEITIS TREATMENT MARKET, BY TYPE, 2023-2032(USD MILLION)

TABLE 23 WESTERN EUROPE: UVEITIS TREATMENT MARKET, BY DRUG CLASS, 2023-2032(USD MILLION)

TABLE 24 WESTERN EUROPE: UVEITIS TREATMENT MARKET, BY END USER, 2023-2032(USD MILLION)

TABLE 25 EASTERN EUROPE: UVEITIS TREATMENT MARKET, BY TYPE, 2023-2032(USD MILLION)

TABLE 26 EASTERN EUROPE: UVEITIS TREATMENT MARKET, BY DRUG CLASS, 2023-2032(USD MILLION)

TABLE 27 EASTERN EUROPE: UVEITIS TREATMENT MARKET, BY END USER, 2023-2032(USD MILLION)

TABLE 28 ASIA-PACIFIC: UVEITIS TREATMENT MARKET, BY TYPE, 2023-2032(USD MILLION)

TABLE 29 ASIA-PACIFIC: UVEITIS TREATMENT MARKET, BY DRUG CLASS, 2023-2032(USD MILLION)

TABLE 30 ASIA-PACIFIC: UVEITIS TREATMENT MARKET, BY END USER, 2023-2032(USD MILLION)

TABLE 31 MIDDLE EAST & AFRICA: UVEITIS TREATMENT MARKET, BY TYPE, 2023-2032(USD MILLION)

TABLE 32 MIDDLE EAST & AFRICA: UVEITIS TREATMENT MARKET, BY DRUG CLASS, 2023-2032(USD MILLION)

TABLE 33 MIDDLE EAST & AFRICA: UVEITIS TREATMENT MARKET, BY END USER, 2023-2032(USD MILLION)

LIST OF FIGURES

FIGURE 1 RESEARCH PROCESS

FIGURE 2 MARKET STRUCTURE FOR THE GLOBAL UVEITIS TREATMENT MARKET

FIGURE 3 MARKET DYNAMICS FOR THE GLOBAL UVEITIS TREATMENT MARKET

FIGURE 4 GLOBAL UVEITIS TREATMENT MARKET SHARE, BY TYPE, 2023 (%)

FIGURE 5 GLOBAL UVEITIS TREATMENT MARKET SHARE, BY DRUG CLASS, 2023 (%)

FIGURE 6 GLOBAL UVEITIS TREATMENT MARKET SHARE, BY END USER, 2023 (%)

FIGURE 7 GLOBAL UVEITIS TREATMENT MARKET SHARE, BY REGION, 2023 (%)

FIGURE 7 AMERICAS: UVEITIS TREATMENT MARKET SHARE BY REGION, 2023 (%)

FIGURE 8 NORTH AMERICA: UVEITIS TREATMENT MARKET SHARE, BY COUNTRY, 2023 (%)

FIGURE 9 EUROPE: UVEITIS TREATMENT MARKET SHARE, BY REGION, 2023 (%)

FIGURE 10 WESTERN EUROPE: UVEITIS TREATMENT MARKET SHARE, BY COUNTRY, 2023 (%)

FIGURE 11 ASIA-PACIFIC: UVEITIS TREATMENT MARKET SHARE, BY COUNTRY, 2023 (%)

FIGURE 12 MIDDLE EAST & AFRICA: UVEITIS TREATMENT MARKET SHARE, BY COUNTRY, 2023 (%)

FIGURE 13 GLOBAL UVEITIS TREATMENT MARKET: COMPANY SHARE ANALYSIS, 2023 (%)

FIGURE 14 ALLERGAN PLC: KEY FINANCIALS

FIGURE 15 ALLERGAN PLC: SEGMENTAL REVENUE

FIGURE 16 ALLERGAN PLC: REGIONAL REVENUE

FIGURE 17 NOVARTIS AG: KEY FINANCIALS

FIGURE 18 NOVARTIS AG: SEGMENTAL REVENUE

FIGURE 19 NOVARTIS AG: REGIONAL REVENUE

FIGURE 20 BAUSCH HEALTH: KEY FINANCIALS

FIGURE 21 BAUSCH HEALTH: SEGMENTAL REVENUE

FIGURE 22 BAUSCH HEALTH: REGIONAL REVENUE

FIGURE 23 EYEPOINT PHARMACEUTICALS, INC.: KEY FINANCIALS

FIGURE 24 EYEPOINT PHARMACEUTICALS, INC.: SEGMENTAL REVENUE

FIGURE 25 EYEPOINT PHARMACEUTICALS, INC.: REGIONAL REVENUE

FIGURE 26 ABBVIE INC.: KEY FINANCIALS

FIGURE 27 ABBVIE INC.: SEGMENTAL REVENUE

FIGURE 28 ABBVIE INC.: REGIONAL REVENUE

FIGURE 29 HORIZON THERAPEUTICS PLC: KEY FINANCIALS

FIGURE 30 HORIZON THERAPEUTICS PLC: SEGMENTAL REVENUE

FIGURE 31 HORIZON THERAPEUTICS PLC: REGIONAL REVENUE

FIGURE 32 ALIMERA SCIENCES: KEY FINANCIALS

FIGURE 33 ALIMERA SCIENCES: SEGMENTAL REVENUE

FIGURE 34 ALIMERA SCIENCES: REGIONAL REVENUE

Purchase Option
Single User $ 4,950
Multiuser License $ 5,950
Enterprise User $ 7,250
Compare Licenses
Tailored for You
  • Dedicated Research on any specifics segment or region.
  • Focused Research on specific players in the market.
  • Custom Report based only on your requirements.
  • Flexibility to add or subtract any chapter in the study.
  • Historic data from 2014 and forecasts outlook till 2040.
  • Flexibility of providing data/insights in formats (PDF, PPT, Excel).
  • Provide cross segmentation in applicable scenario/markets.