US Thermal Underwear Market Segmentation
US Thermal Underwear Market By Gender (USD Billion, 2025-2035)
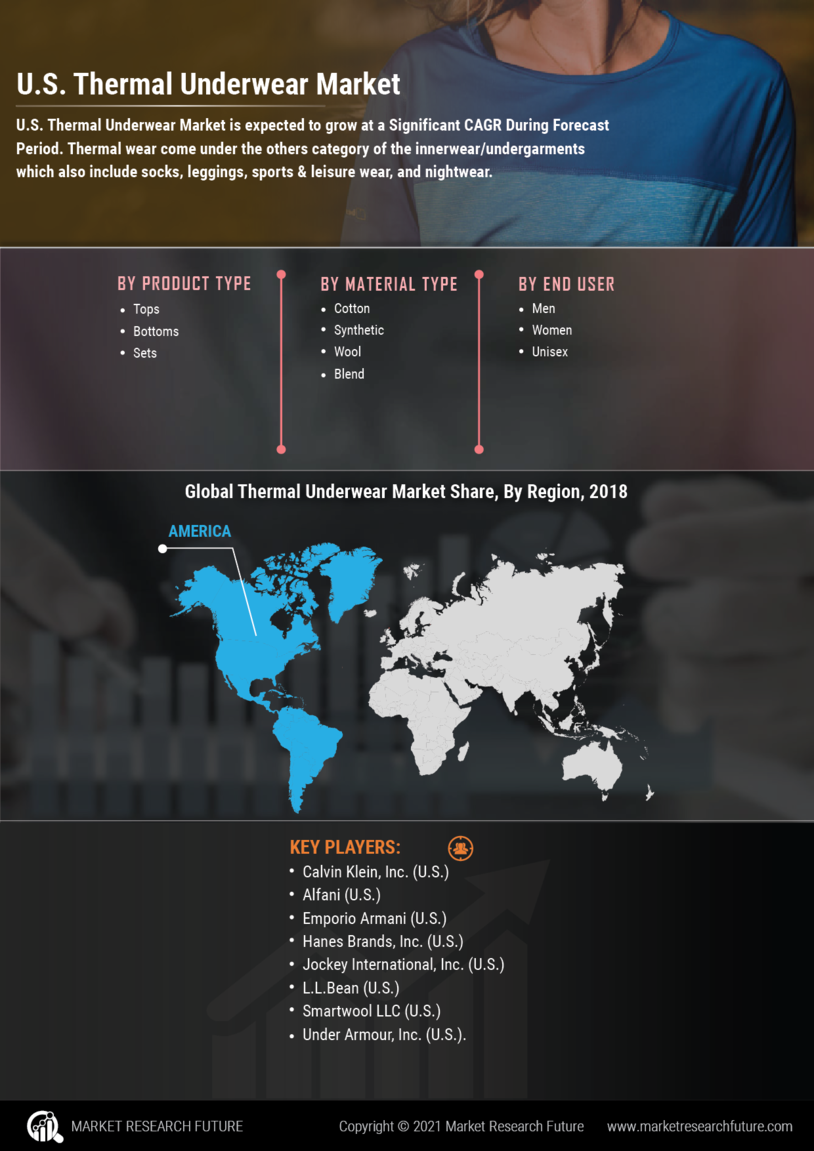
- Men
- Women
- Kids
US Thermal Underwear Market By Product Category (USD Billion, 2025-2035)
- Tops
- Bottoms
- Sets
US Thermal Underwear Market By Distribution Channel (USD Billion, 2025-2035)
- Mass
- Departmental Stores
- Specialty
- Others