Request Free Sample ×

Kindly complete the form below to receive a free sample of this Report

* Please use a valid business email

Leading companies partner with us for data-driven Insights

clients tt-cursor
Hero Background

US Stem Cell Reconstructive Market

ID: MRFR/LS/18499-HCR
100 Pages
Nidhi Mandole
Last Updated: April 06, 2026

US Stem Cell Reconstructive Market Research Report By Sources (Allogeneic, Autologous, Syngeneic, Other), By Cell Types (Embryonic Stem Cell, Adult Stem Cell), By Application (Cancer, Diabetes, Traumatic Skin Defect, Severe Burn) and By End Users (Hospital, Research Institutes) - Growth & Industry Forecast 2025 To 2035

Share:
Download PDF ×

We do not share your information with anyone. However, we may send you emails based on your report interest from time to time. You may contact us at any time to opt-out.

US Stem Cell Reconstructive Market Infographic
Purchase Options
  1. 1 SECTION I: EXECUTIVE SUMMARY AND KEY HIGHLIGHTS
  2.   1.1 EXECUTIVE SUMMARY
  3.     1.1.1 Market Overview
  4.     1.1.2 Key Findings
  5.     1.1.3 Market Segmentation
  6.     1.1.4 Competitive Landscape
  7.     1.1.5 Challenges and Opportunities
  8.     1.1.6 Future Outlook
  9. 2 SECTION II: SCOPING, METHODOLOGY AND MARKET STRUCTURE
  10.   2.1 MARKET INTRODUCTION
  11.     2.1.1 Definition
  12.     2.1.2 Scope of the study
  13.       2.1.2.1 Research Objective
  14.       2.1.2.2 Assumption
  15.       2.1.2.3 Limitations
  16.   2.2 RESEARCH METHODOLOGY
  17.     2.2.1 Overview
  18.     2.2.2 Data Mining
  19.     2.2.3 Secondary Research
  20.     2.2.4 Primary Research
  21.       2.2.4.1 Primary Interviews and Information Gathering Process
  22.       2.2.4.2 Breakdown of Primary Respondents
  23.     2.2.5 Forecasting Model
  24.     2.2.6 Market Size Estimation
  25.       2.2.6.1 Bottom-Up Approach
  26.       2.2.6.2 Top-Down Approach
  27.     2.2.7 Data Triangulation
  28.     2.2.8 Validation
  29. 3 SECTION III: QUALITATIVE ANALYSIS
  30.   3.1 MARKET DYNAMICS
  31.     3.1.1 Overview
  32.     3.1.2 Drivers
  33.     3.1.3 Restraints
  34.     3.1.4 Opportunities
  35.   3.2 MARKET FACTOR ANALYSIS
  36.     3.2.1 Value chain Analysis
  37.     3.2.2 Porter's Five Forces Analysis
  38.       3.2.2.1 Bargaining Power of Suppliers
  39.       3.2.2.2 Bargaining Power of Buyers
  40.       3.2.2.3 Threat of New Entrants
  41.       3.2.2.4 Threat of Substitutes
  42.       3.2.2.5 Intensity of Rivalry
  43.     3.2.3 COVID-19 Impact Analysis
  44.       3.2.3.1 Market Impact Analysis
  45.       3.2.3.2 Regional Impact
  46.       3.2.3.3 Opportunity and Threat Analysis
  47. 4 SECTION IV: QUANTITATIVE ANALYSIS
  48.   4.1 Pharmaceutical, BY sources (USD Million)
  49.     4.1.1 allogeneic
  50.     4.1.2 syngeneic
  51.     4.1.3 autologous
  52.     4.1.4 others
  53.   4.2 Pharmaceutical, BY cell types (USD Million)
  54.     4.2.1 embryonic stem cells
  55.     4.2.2 adult stem cells
  56.   4.3 Pharmaceutical, BY application (USD Million)
  57.     4.3.1 cancer
  58.     4.3.2 severe burn
  59.     4.3.3 diabetes
  60.     4.3.4 traumatic skin defect
  61.     4.3.5 others
  62.   4.4 Pharmaceutical, BY end-user (USD Million)
  63.     4.4.1 hospitals
  64.     4.4.2 research institutes
  65.     4.4.3 others
  66. 5 SECTION V: COMPETITIVE ANALYSIS
  67.   5.1 Competitive Landscape
  68.     5.1.1 Overview
  69.     5.1.2 Competitive Analysis
  70.     5.1.3 Market share Analysis
  71.     5.1.4 Major Growth Strategy in the Pharmaceutical
  72.     5.1.5 Competitive Benchmarking
  73.     5.1.6 Leading Players in Terms of Number of Developments in the Pharmaceutical
  74.     5.1.7 Key developments and growth strategies
  75.       5.1.7.1 New Product Launch/Service Deployment
  76.       5.1.7.2 Merger & Acquisitions
  77.       5.1.7.3 Joint Ventures
  78.     5.1.8 Major Players Financial Matrix
  79.       5.1.8.1 Sales and Operating Income
  80.       5.1.8.2 Major Players R&D Expenditure. 2023
  81.   5.2 Company Profiles
  82.     5.2.1 Athersys Inc (US)
  83.       5.2.1.1 Financial Overview
  84.       5.2.1.2 Products Offered
  85.       5.2.1.3 Key Developments
  86.       5.2.1.4 SWOT Analysis
  87.       5.2.1.5 Key Strategies
  88.     5.2.2 Mesoblast Ltd (AU)
  89.       5.2.2.1 Financial Overview
  90.       5.2.2.2 Products Offered
  91.       5.2.2.3 Key Developments
  92.       5.2.2.4 SWOT Analysis
  93.       5.2.2.5 Key Strategies
  94.     5.2.3 Osiris Therapeutics Inc (US)
  95.       5.2.3.1 Financial Overview
  96.       5.2.3.2 Products Offered
  97.       5.2.3.3 Key Developments
  98.       5.2.3.4 SWOT Analysis
  99.       5.2.3.5 Key Strategies
  100.     5.2.4 Cynata Therapeutics Ltd (AU)
  101.       5.2.4.1 Financial Overview
  102.       5.2.4.2 Products Offered
  103.       5.2.4.3 Key Developments
  104.       5.2.4.4 SWOT Analysis
  105.       5.2.4.5 Key Strategies
  106.     5.2.5 Regenative Labs LLC (US)
  107.       5.2.5.1 Financial Overview
  108.       5.2.5.2 Products Offered
  109.       5.2.5.3 Key Developments
  110.       5.2.5.4 SWOT Analysis
  111.       5.2.5.5 Key Strategies
  112.     5.2.6 StemCells Inc (US)
  113.       5.2.6.1 Financial Overview
  114.       5.2.6.2 Products Offered
  115.       5.2.6.3 Key Developments
  116.       5.2.6.4 SWOT Analysis
  117.       5.2.6.5 Key Strategies
  118.     5.2.7 Tissue Regenix Group PLC (GB)
  119.       5.2.7.1 Financial Overview
  120.       5.2.7.2 Products Offered
  121.       5.2.7.3 Key Developments
  122.       5.2.7.4 SWOT Analysis
  123.       5.2.7.5 Key Strategies
  124.     5.2.8 Vericel Corporation (US)
  125.       5.2.8.1 Financial Overview
  126.       5.2.8.2 Products Offered
  127.       5.2.8.3 Key Developments
  128.       5.2.8.4 SWOT Analysis
  129.       5.2.8.5 Key Strategies
  130.   5.3 Appendix
  131.     5.3.1 References
  132.     5.3.2 Related Reports
  133. 6 LIST OF FIGURES
  134.   6.1 MARKET SYNOPSIS
  135.   6.2 US MARKET ANALYSIS BY SOURCES
  136.   6.3 US MARKET ANALYSIS BY CELL TYPES
  137.   6.4 US MARKET ANALYSIS BY APPLICATION
  138.   6.5 US MARKET ANALYSIS BY END-USER
  139.   6.6 KEY BUYING CRITERIA OF PHARMACEUTICAL
  140.   6.7 RESEARCH PROCESS OF MRFR
  141.   6.8 DRO ANALYSIS OF PHARMACEUTICAL
  142.   6.9 DRIVERS IMPACT ANALYSIS: PHARMACEUTICAL
  143.   6.10 RESTRAINTS IMPACT ANALYSIS: PHARMACEUTICAL
  144.   6.11 SUPPLY / VALUE CHAIN: PHARMACEUTICAL
  145.   6.12 PHARMACEUTICAL, BY SOURCES, 2024 (% SHARE)
  146.   6.13 PHARMACEUTICAL, BY SOURCES, 2024 TO 2035 (USD Million)
  147.   6.14 PHARMACEUTICAL, BY CELL TYPES, 2024 (% SHARE)
  148.   6.15 PHARMACEUTICAL, BY CELL TYPES, 2024 TO 2035 (USD Million)
  149.   6.16 PHARMACEUTICAL, BY APPLICATION, 2024 (% SHARE)
  150.   6.17 PHARMACEUTICAL, BY APPLICATION, 2024 TO 2035 (USD Million)
  151.   6.18 PHARMACEUTICAL, BY END-USER, 2024 (% SHARE)
  152.   6.19 PHARMACEUTICAL, BY END-USER, 2024 TO 2035 (USD Million)
  153.   6.20 BENCHMARKING OF MAJOR COMPETITORS
  154. 7 LIST OF TABLES
  155.   7.1 LIST OF ASSUMPTIONS
  156.     7.1.1
  157.   7.2 US MARKET SIZE ESTIMATES; FORECAST
  158.     7.2.1 BY SOURCES, 2025-2035 (USD Million)
  159.     7.2.2 BY CELL TYPES, 2025-2035 (USD Million)
  160.     7.2.3 BY APPLICATION, 2025-2035 (USD Million)
  161.     7.2.4 BY END-USER, 2025-2035 (USD Million)
  162.   7.3 PRODUCT LAUNCH/PRODUCT DEVELOPMENT/APPROVAL
  163.     7.3.1
  164.   7.4 ACQUISITION/PARTNERSHIP
  165.     7.4.1

US Pharmaceutical Market Segmentation

Pharmaceutical By sources (USD Million, 2025-2035)
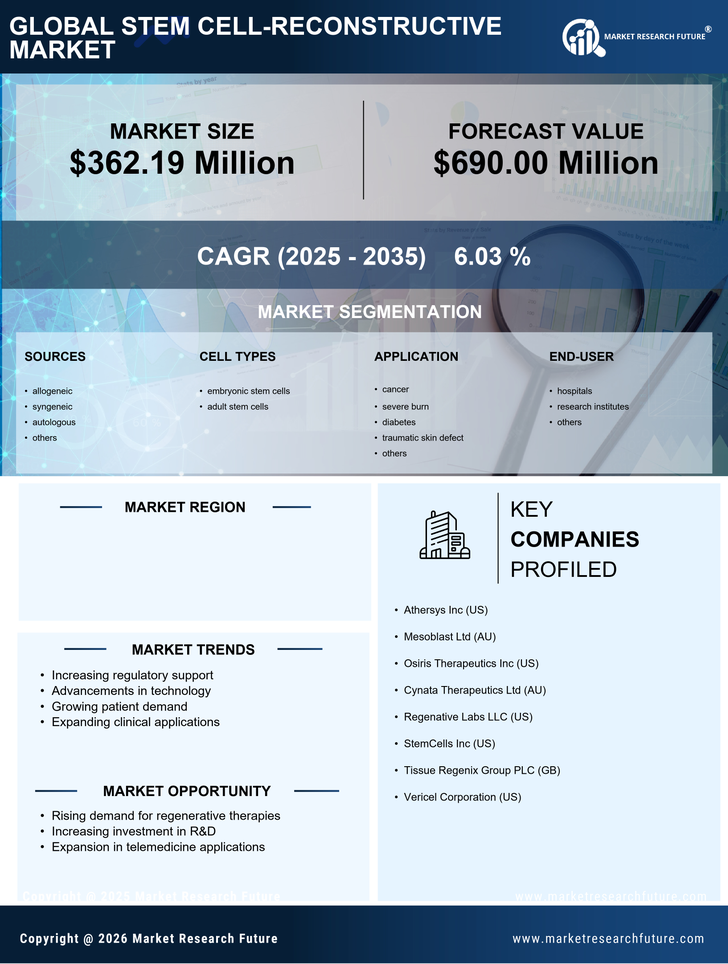
  • allogeneic
  • syngeneic
  • autologous
  • others

Pharmaceutical By cell types (USD Million, 2025-2035)

  • embryonic stem cells
  • adult stem cells

Pharmaceutical By application (USD Million, 2025-2035)

  • cancer
  • severe burn
  • diabetes
  • traumatic skin defect
  • others

Pharmaceutical By end-user (USD Million, 2025-2035)

  • hospitals
  • research institutes
  • others

Compare Licence

×
Features License Type
Single User Multiuser License Enterprise User
Price $4,950 $5,950 $7,250
Maximum User Access Limit 1 User Upto 10 Users Unrestricted Access Throughout the Organization
Free Customization
Direct Access to Analyst
Deliverable Format
Platform Access
Discount on Next Purchase 10% 15% 15%
Printable Versions