US Security Testing Market Segmentation
US Security Testing Market By Type (USD Million, 2025-2035)
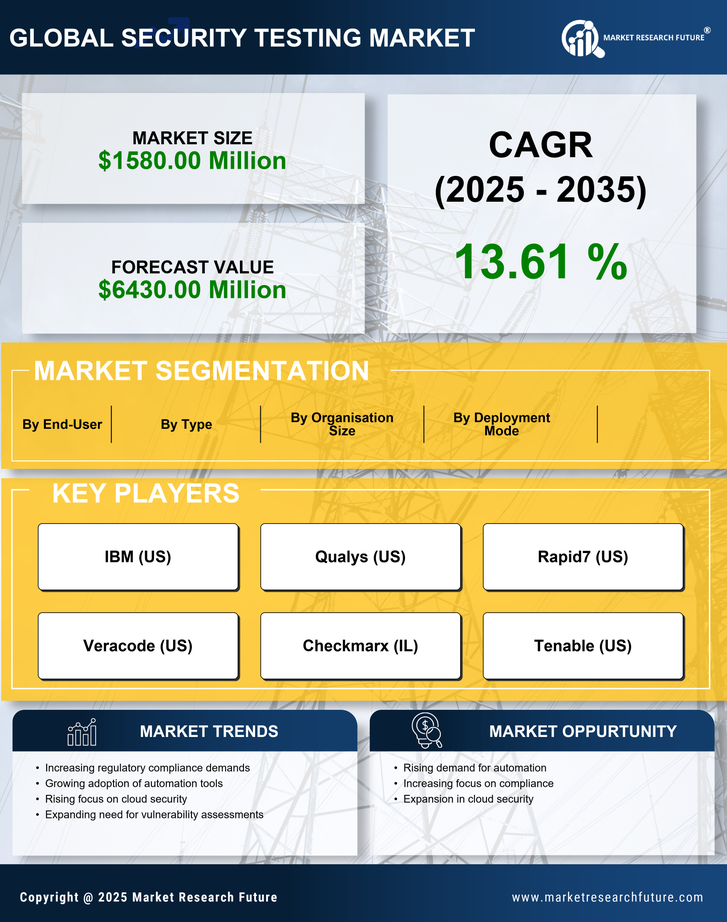
- Social Engineering
- Application Security Testing
- Device Security Testing
- Network Security Testing
US Security Testing Market By Deployment Mode (USD Million, 2025-2035)
- Cloud
- On-premise
US Security Testing Market By Organisation Size (USD Million, 2025-2035)
- Large scale organization
- Small scale organization
US Security Testing Market By End-User (USD Million, 2025-2035)
- Education
- BFSI
- Retail
- Telecomm
- IT