

US Life Sciences Market Segmentation
Life Sciences By Application (USD Billion, 2025-2035)
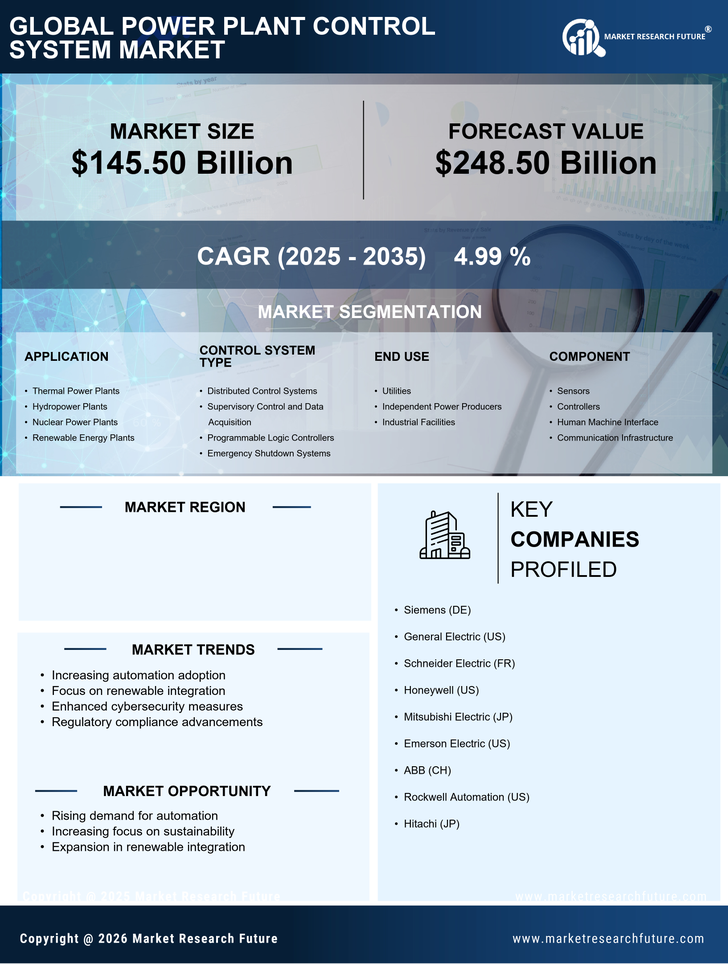
- Thermal Power Plants
- Hydropower Plants
- Nuclear Power Plants
- Renewable Energy Plants
Life Sciences By Control System Type (USD Billion, 2025-2035)
- Distributed Control Systems
- Supervisory Control and Data Acquisition
- Programmable Logic Controllers
- Emergency Shutdown Systems
Life Sciences By End Use (USD Billion, 2025-2035)
- Utilities
- Independent Power Producers
- Industrial Facilities
Life Sciences By Component (USD Billion, 2025-2035)
- Sensors
- Controllers
- Human Machine Interface
- Communication Infrastructure


