Request Free Sample ×

Kindly complete the form below to receive a free sample of this Report

* Please use a valid business email

Leading companies partner with us for data-driven Insights

clients tt-cursor
Hero Background

US Pillow Market

ID: MRFR/CG/19406-CR
128 Pages
Pradeep Nandi
Last Updated: April 06, 2026

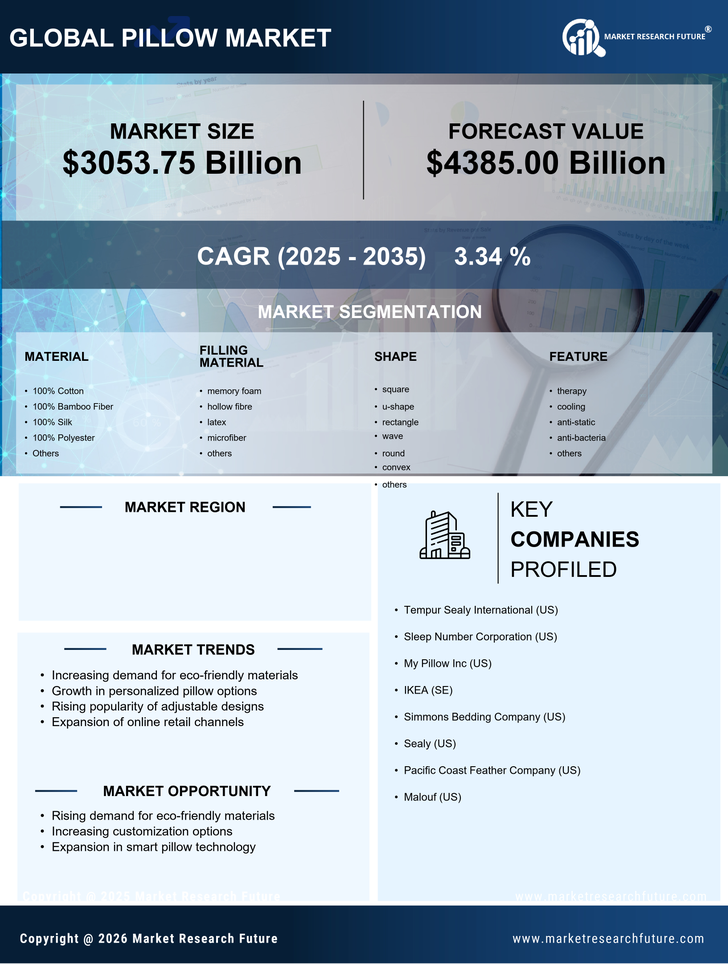
US Pillows Market Size, Share, Industry Trend & Analysis Research Report by Type (Adjustable Pillows and Non-Adjustable Pillows), by Product Type (Feather Pillows, Down Pillows, Memory Foam Pillows, Latex Pillows, Synthetic Pillows, and Others), by Design (Ergonomic Pillows and Normal Pillows), by Pillow Size (Standard, Super standard, Queen, King, European¸ and Others), and by Category (Smart Pillows and Standard Pillows), by Nature (Eco-Friendly Pillows and Regular), and by Distribution Channel (Supermarkets & Hypermarkets, Specialty Stores, Online, and Others)– Forecast Till 2035

Share:
Download PDF ×

We do not share your information with anyone. However, we may send you emails based on your report interest from time to time. You may contact us at any time to opt-out.

US Pillow Market Infographic
Purchase Options
  1. 1 SECTION I: EXECUTIVE SUMMARY AND KEY HIGHLIGHTS
  2.   1.1 EXECUTIVE SUMMARY
  3.     1.1.1 Market Overview
  4.     1.1.2 Key Findings
  5.     1.1.3 Market Segmentation
  6.     1.1.4 Competitive Landscape
  7.     1.1.5 Challenges and Opportunities
  8.     1.1.6 Future Outlook
  9. 2 SECTION II: SCOPING, METHODOLOGY AND MARKET STRUCTURE
  10.   2.1 MARKET INTRODUCTION
  11.     2.1.1 Definition
  12.     2.1.2 Scope of the study
  13.       2.1.2.1 Research Objective
  14.       2.1.2.2 Assumption
  15.       2.1.2.3 Limitations
  16.   2.2 RESEARCH METHODOLOGY
  17.     2.2.1 Overview
  18.     2.2.2 Data Mining
  19.     2.2.3 Secondary Research
  20.     2.2.4 Primary Research
  21.       2.2.4.1 Primary Interviews and Information Gathering Process
  22.       2.2.4.2 Breakdown of Primary Respondents
  23.     2.2.5 Forecasting Model
  24.     2.2.6 Market Size Estimation
  25.       2.2.6.1 Bottom-Up Approach
  26.       2.2.6.2 Top-Down Approach
  27.     2.2.7 Data Triangulation
  28.     2.2.8 Validation
  29. 3 SECTION III: QUALITATIVE ANALYSIS
  30.   3.1 MARKET DYNAMICS
  31.     3.1.1 Overview
  32.     3.1.2 Drivers
  33.     3.1.3 Restraints
  34.     3.1.4 Opportunities
  35.   3.2 MARKET FACTOR ANALYSIS
  36.     3.2.1 Value chain Analysis
  37.     3.2.2 Porter's Five Forces Analysis
  38.       3.2.2.1 Bargaining Power of Suppliers
  39.       3.2.2.2 Bargaining Power of Buyers
  40.       3.2.2.3 Threat of New Entrants
  41.       3.2.2.4 Threat of Substitutes
  42.       3.2.2.5 Intensity of Rivalry
  43.     3.2.3 COVID-19 Impact Analysis
  44.       3.2.3.1 Market Impact Analysis
  45.       3.2.3.2 Regional Impact
  46.       3.2.3.3 Opportunity and Threat Analysis
  47. 4 SECTION IV: QUANTITATIVE ANALYSIS
  48.   4.1 Industrial Automation & Equipment, BY Material (USD Billion)
  49.     4.1.1 100% Cotton
  50.     4.1.2 100% Bamboo Fiber
  51.     4.1.3 100% Silk
  52.     4.1.4 100% Polyester
  53.     4.1.5 Others
  54.   4.2 Industrial Automation & Equipment, BY Filling Material (USD Billion)
  55.     4.2.1 memory foam
  56.     4.2.2 hollow fibre
  57.     4.2.3 latex
  58.     4.2.4 microfiber
  59.     4.2.5 others
  60.   4.3 Industrial Automation & Equipment, BY Shape (USD Billion)
  61.     4.3.1 square
  62.     4.3.2 u-shape
  63.     4.3.3 rectangle
  64.     4.3.4 wave
  65.     4.3.5 round
  66.     4.3.6 convex
  67.     4.3.7 others
  68.   4.4 Industrial Automation & Equipment, BY Feature (USD Billion)
  69.     4.4.1 therapy
  70.     4.4.2 cooling
  71.     4.4.3 anti-static
  72.     4.4.4 anti-bacteria
  73.     4.4.5 others
  74.   4.5 Industrial Automation & Equipment, BY Application (USD Billion)
  75.     4.5.1 decorative
  76.     4.5.2 sleeping
  77.     4.5.3 bedding
  78.     4.5.4 travel
  79.     4.5.5 massage
  80.     4.5.6 others
  81. 5 SECTION V: COMPETITIVE ANALYSIS
  82.   5.1 Competitive Landscape
  83.     5.1.1 Overview
  84.     5.1.2 Competitive Analysis
  85.     5.1.3 Market share Analysis
  86.     5.1.4 Major Growth Strategy in the Industrial Automation & Equipment
  87.     5.1.5 Competitive Benchmarking
  88.     5.1.6 Leading Players in Terms of Number of Developments in the Industrial Automation & Equipment
  89.     5.1.7 Key developments and growth strategies
  90.       5.1.7.1 New Product Launch/Service Deployment
  91.       5.1.7.2 Merger & Acquisitions
  92.       5.1.7.3 Joint Ventures
  93.     5.1.8 Major Players Financial Matrix
  94.       5.1.8.1 Sales and Operating Income
  95.       5.1.8.2 Major Players R&D Expenditure. 2023
  96.   5.2 Company Profiles
  97.     5.2.1 Tempur Sealy International (US)
  98.       5.2.1.1 Financial Overview
  99.       5.2.1.2 Products Offered
  100.       5.2.1.3 Key Developments
  101.       5.2.1.4 SWOT Analysis
  102.       5.2.1.5 Key Strategies
  103.     5.2.2 Sleep Number Corporation (US)
  104.       5.2.2.1 Financial Overview
  105.       5.2.2.2 Products Offered
  106.       5.2.2.3 Key Developments
  107.       5.2.2.4 SWOT Analysis
  108.       5.2.2.5 Key Strategies
  109.     5.2.3 My Pillow Inc (US)
  110.       5.2.3.1 Financial Overview
  111.       5.2.3.2 Products Offered
  112.       5.2.3.3 Key Developments
  113.       5.2.3.4 SWOT Analysis
  114.       5.2.3.5 Key Strategies
  115.     5.2.4 IKEA (SE)
  116.       5.2.4.1 Financial Overview
  117.       5.2.4.2 Products Offered
  118.       5.2.4.3 Key Developments
  119.       5.2.4.4 SWOT Analysis
  120.       5.2.4.5 Key Strategies
  121.     5.2.5 Simmons Bedding Company (US)
  122.       5.2.5.1 Financial Overview
  123.       5.2.5.2 Products Offered
  124.       5.2.5.3 Key Developments
  125.       5.2.5.4 SWOT Analysis
  126.       5.2.5.5 Key Strategies
  127.     5.2.6 Sealy (US)
  128.       5.2.6.1 Financial Overview
  129.       5.2.6.2 Products Offered
  130.       5.2.6.3 Key Developments
  131.       5.2.6.4 SWOT Analysis
  132.       5.2.6.5 Key Strategies
  133.     5.2.7 Pacific Coast Feather Company (US)
  134.       5.2.7.1 Financial Overview
  135.       5.2.7.2 Products Offered
  136.       5.2.7.3 Key Developments
  137.       5.2.7.4 SWOT Analysis
  138.       5.2.7.5 Key Strategies
  139.     5.2.8 Malouf (US)
  140.       5.2.8.1 Financial Overview
  141.       5.2.8.2 Products Offered
  142.       5.2.8.3 Key Developments
  143.       5.2.8.4 SWOT Analysis
  144.       5.2.8.5 Key Strategies
  145.   5.3 Appendix
  146.     5.3.1 References
  147.     5.3.2 Related Reports
  148. 6 LIST OF FIGURES
  149.   6.1 MARKET SYNOPSIS
  150.   6.2 US MARKET ANALYSIS BY MATERIAL
  151.   6.3 US MARKET ANALYSIS BY FILLING MATERIAL
  152.   6.4 US MARKET ANALYSIS BY SHAPE
  153.   6.5 US MARKET ANALYSIS BY FEATURE
  154.   6.6 US MARKET ANALYSIS BY APPLICATION
  155.   6.7 KEY BUYING CRITERIA OF INDUSTRIAL AUTOMATION & EQUIPMENT
  156.   6.8 RESEARCH PROCESS OF MRFR
  157.   6.9 DRO ANALYSIS OF INDUSTRIAL AUTOMATION & EQUIPMENT
  158.   6.10 DRIVERS IMPACT ANALYSIS: INDUSTRIAL AUTOMATION & EQUIPMENT
  159.   6.11 RESTRAINTS IMPACT ANALYSIS: INDUSTRIAL AUTOMATION & EQUIPMENT
  160.   6.12 SUPPLY / VALUE CHAIN: INDUSTRIAL AUTOMATION & EQUIPMENT
  161.   6.13 INDUSTRIAL AUTOMATION & EQUIPMENT, BY MATERIAL, 2024 (% SHARE)
  162.   6.14 INDUSTRIAL AUTOMATION & EQUIPMENT, BY MATERIAL, 2024 TO 2035 (USD Billion)
  163.   6.15 INDUSTRIAL AUTOMATION & EQUIPMENT, BY FILLING MATERIAL, 2024 (% SHARE)
  164.   6.16 INDUSTRIAL AUTOMATION & EQUIPMENT, BY FILLING MATERIAL, 2024 TO 2035 (USD Billion)
  165.   6.17 INDUSTRIAL AUTOMATION & EQUIPMENT, BY SHAPE, 2024 (% SHARE)
  166.   6.18 INDUSTRIAL AUTOMATION & EQUIPMENT, BY SHAPE, 2024 TO 2035 (USD Billion)
  167.   6.19 INDUSTRIAL AUTOMATION & EQUIPMENT, BY FEATURE, 2024 (% SHARE)
  168.   6.20 INDUSTRIAL AUTOMATION & EQUIPMENT, BY FEATURE, 2024 TO 2035 (USD Billion)
  169.   6.21 INDUSTRIAL AUTOMATION & EQUIPMENT, BY APPLICATION, 2024 (% SHARE)
  170.   6.22 INDUSTRIAL AUTOMATION & EQUIPMENT, BY APPLICATION, 2024 TO 2035 (USD Billion)
  171.   6.23 BENCHMARKING OF MAJOR COMPETITORS
  172. 7 LIST OF TABLES
  173.   7.1 LIST OF ASSUMPTIONS
  174.     7.1.1
  175.   7.2 US MARKET SIZE ESTIMATES; FORECAST
  176.     7.2.1 BY MATERIAL, 2025-2035 (USD Billion)
  177.     7.2.2 BY FILLING MATERIAL, 2025-2035 (USD Billion)
  178.     7.2.3 BY SHAPE, 2025-2035 (USD Billion)
  179.     7.2.4 BY FEATURE, 2025-2035 (USD Billion)
  180.     7.2.5 BY APPLICATION, 2025-2035 (USD Billion)
  181.   7.3 PRODUCT LAUNCH/PRODUCT DEVELOPMENT/APPROVAL
  182.     7.3.1
  183.   7.4 ACQUISITION/PARTNERSHIP
  184.     7.4.1

US Industrial Automation & Equipment Market Segmentation

Industrial Automation & Equipment By Material (USD Billion, 2025-2035)

  • 100% Cotton
  • 100% Bamboo Fiber
  • 100% Silk
  • 100% Polyester
  • Others

Industrial Automation & Equipment By Filling Material (USD Billion, 2025-2035)

  • memory foam
  • hollow fibre
  • latex
  • microfiber
  • others

Industrial Automation & Equipment By Shape (USD Billion, 2025-2035)

  • square
  • u-shape
  • rectangle
  • wave
  • round
  • convex
  • others

Industrial Automation & Equipment By Feature (USD Billion, 2025-2035)

  • therapy
  • cooling
  • anti-static
  • anti-bacteria
  • others

Industrial Automation & Equipment By Application (USD Billion, 2025-2035)

  • decorative
  • sleeping
  • bedding
  • travel
  • massage
  • others

Compare Licence

×
Features License Type
Single User Multiuser License Enterprise User
Price $4,950 $5,950 $7,250
Maximum User Access Limit 1 User Upto 10 Users Unrestricted Access Throughout the Organization
Free Customization
Direct Access to Analyst
Deliverable Format
Platform Access
Discount on Next Purchase 10% 15% 15%
Printable Versions