US pH Sensor Market

ID: MRFR/SEM/17280-HCR
200 Pages
Apoorva Priyadarshi
Last Updated: April 06, 2026
US pH Sensor Market Size, Share and Research Report: By Type (Process Sensors, Differential Sensors, Combination pH Sensors, Laboratory Sensors), By Component (Hardware, Software), By Product Type (Digital, Analog), By System Type (Benchtop, Portable) and By End-User Industries (Water and Wastewater, Paper, Chemical, Oil and Gas, Food and Beverages, Medical and Pharmaceutical, Metal and Mining, Agriculture) - Industry Forecast Till 2035
Download PDF ×

We do not share your information with anyone. However, we may send you emails based on your report interest from time to time. You may contact us at any time to opt-out.

US pH Sensor Market

Market Size

Forecast Period2025 - 2035
CAGR (2025 - 2035)3.28%
2024 Market Size$ 396.9 Million
2025 Market Size$ 409.92 Million
2035 Market Size$ 566.18 Million

Key Players

Hach Company
Thermo Fisher Scientific
Horiba
Mettler Toledo
Yokogawa Electric Corporation
Endress+Hauser
Opportunities
  • Rising Demand in Agriculture
  • Expansion of Industrial Applications
  • Water Quality Monitoring Initiatives
  1. 1 SECTION I: EXECUTIVE SUMMARY AND KEY HIGHLIGHTS
    1. 1.1 EXECUTIVE SUMMARY
      1. 1.1.1 Market Overview
      2. 1.1.2 Key Findings
      3. 1.1.3 Market Segmentation
      4. 1.1.4 Competitive Landscape
      5. 1.1.5 Challenges and Opportunities
      6. 1.1.6 Future Outlook
  2. 2 SECTION II: SCOPING, METHODOLOGY AND MARKET STRUCTURE
    1. 2.1 MARKET INTRODUCTION
      1. 2.1.1 Definition
      2. 2.1.2 Scope of the study
        1. 2.1.2.1 Research Objective
        2. 2.1.2.2 Assumption
        3. 2.1.2.3 Limitations
    2. 2.2 RESEARCH METHODOLOGY
      1. 2.2.1 Overview
      2. 2.2.2 Data Mining
      3. 2.2.3 Secondary Research
      4. 2.2.4 Primary Research
        1. 2.2.4.1 Primary Interviews and Information Gathering Process
        2. 2.2.4.2 Breakdown of Primary Respondents
      5. 2.2.5 Forecasting Model
      6. 2.2.6 Market Size Estimation
        1. 2.2.6.1 Bottom-Up Approach
        2. 2.2.6.2 Top-Down Approach
      7. 2.2.7 Data Triangulation
      8. 2.2.8 Validation
  3. 3 SECTION III: QUALITATIVE ANALYSIS
    1. 3.1 MARKET DYNAMICS
      1. 3.1.1 Overview
      2. 3.1.2 Drivers
      3. 3.1.3 Restraints
      4. 3.1.4 Opportunities
    2. 3.2 MARKET FACTOR ANALYSIS
      1. 3.2.1 Value chain Analysis
      2. 3.2.2 Porter's Five Forces Analysis
        1. 3.2.2.1 Bargaining Power of Suppliers
        2. 3.2.2.2 Bargaining Power of Buyers
        3. 3.2.2.3 Threat of New Entrants
        4. 3.2.2.4 Threat of Substitutes
        5. 3.2.2.5 Intensity of Rivalry
      3. 3.2.3 COVID-19 Impact Analysis
        1. 3.2.3.1 Market Impact Analysis
        2. 3.2.3.2 Regional Impact
        3. 3.2.3.3 Opportunity and Threat Analysis
  4. 4 SECTION IV: QUANTITATIVE ANALYSIS
    1. 4.1 Semiconductor & Electronics, BY Type (USD Million)
      1. 4.1.1 Process sensors
      2. 4.1.2 Differential sensors
      3. 4.1.3 Combination pH sensors
      4. 4.1.4 Laboratory sensors
    2. 4.2 Semiconductor & Electronics, BY Component (USD Million)
      1. 4.2.1 Hardware
      2. 4.2.2 Software
    3. 4.3 Semiconductor & Electronics, BY Product Type (USD Million)
      1. 4.3.1 Digital
      2. 4.3.2 Analog
    4. 4.4 Semiconductor & Electronics, BY System Type (USD Million)
      1. 4.4.1 Benchtop
      2. 4.4.2 Portable
    5. 4.5 Semiconductor & Electronics, BY End-Use Industries (USD Million)
      1. 4.5.1 Water and wastewater
      2. 4.5.2 Paper
      3. 4.5.3 Chemical
      4. 4.5.4 Oil and gas
      5. 4.5.5 Food and beverages
      6. 4.5.6 Medical and pharmaceutical
      7. 4.5.7 Metal and mining
      8. 4.5.8 Agriculture
  5. 5 SECTION V: COMPETITIVE ANALYSIS
    1. 5.1 Competitive Landscape
      1. 5.1.1 Overview
      2. 5.1.2 Competitive Analysis
      3. 5.1.3 Market share Analysis
      4. 5.1.4 Major Growth Strategy in the Semiconductor & Electronics
      5. 5.1.5 Competitive Benchmarking
      6. 5.1.6 Leading Players in Terms of Number of Developments in the Semiconductor & Electronics
      7. 5.1.7 Key developments and growth strategies
        1. 5.1.7.1 New Product Launch/Service Deployment
        2. 5.1.7.2 Merger & Acquisitions
        3. 5.1.7.3 Joint Ventures
      8. 5.1.8 Major Players Financial Matrix
        1. 5.1.8.1 Sales and Operating Income
        2. 5.1.8.2 Major Players R&D Expenditure. 2023
    2. 5.2 Company Profiles
      1. 5.2.1 Hach Company (US)
        1. 5.2.1.1 Financial Overview
        2. 5.2.1.2 Products Offered
        3. 5.2.1.3 Key Developments
        4. 5.2.1.4 SWOT Analysis
        5. 5.2.1.5 Key Strategies
      2. 5.2.2 Thermo Fisher Scientific (US)
        1. 5.2.2.1 Financial Overview
        2. 5.2.2.2 Products Offered
        3. 5.2.2.3 Key Developments
        4. 5.2.2.4 SWOT Analysis
        5. 5.2.2.5 Key Strategies
      3. 5.2.3 Horiba (JP)
        1. 5.2.3.1 Financial Overview
        2. 5.2.3.2 Products Offered
        3. 5.2.3.3 Key Developments
        4. 5.2.3.4 SWOT Analysis
        5. 5.2.3.5 Key Strategies
      4. 5.2.4 Mettler Toledo (CH)
        1. 5.2.4.1 Financial Overview
        2. 5.2.4.2 Products Offered
        3. 5.2.4.3 Key Developments
        4. 5.2.4.4 SWOT Analysis
        5. 5.2.4.5 Key Strategies
      5. 5.2.5 Yokogawa Electric Corporation (JP)
        1. 5.2.5.1 Financial Overview
        2. 5.2.5.2 Products Offered
        3. 5.2.5.3 Key Developments
        4. 5.2.5.4 SWOT Analysis
        5. 5.2.5.5 Key Strategies
      6. 5.2.6 Endress+Hauser (CH)
        1. 5.2.6.1 Financial Overview
        2. 5.2.6.2 Products Offered
        3. 5.2.6.3 Key Developments
        4. 5.2.6.4 SWOT Analysis
        5. 5.2.6.5 Key Strategies
      7. 5.2.7 Omega Engineering (US)
        1. 5.2.7.1 Financial Overview
        2. 5.2.7.2 Products Offered
        3. 5.2.7.3 Key Developments
        4. 5.2.7.4 SWOT Analysis
        5. 5.2.7.5 Key Strategies
      8. 5.2.8 Apera Instruments (US)
        1. 5.2.8.1 Financial Overview
        2. 5.2.8.2 Products Offered
        3. 5.2.8.3 Key Developments
        4. 5.2.8.4 SWOT Analysis
        5. 5.2.8.5 Key Strategies
    3. 5.3 Appendix
      1. 5.3.1 References
      2. 5.3.2 Related Reports
  6. 6 LIST OF FIGURES
    1. 6.1 MARKET SYNOPSIS
    2. 6.2 US MARKET ANALYSIS BY TYPE
    3. 6.3 US MARKET ANALYSIS BY COMPONENT
    4. 6.4 US MARKET ANALYSIS BY PRODUCT TYPE
    5. 6.5 US MARKET ANALYSIS BY SYSTEM TYPE
    6. 6.6 US MARKET ANALYSIS BY END-USE INDUSTRIES
    7. 6.7 KEY BUYING CRITERIA OF SEMICONDUCTOR & ELECTRONICS
    8. 6.8 RESEARCH PROCESS OF MRFR
    9. 6.9 DRO ANALYSIS OF SEMICONDUCTOR & ELECTRONICS
    10. 6.10 DRIVERS IMPACT ANALYSIS: SEMICONDUCTOR & ELECTRONICS
    11. 6.11 RESTRAINTS IMPACT ANALYSIS: SEMICONDUCTOR & ELECTRONICS
    12. 6.12 SUPPLY / VALUE CHAIN: SEMICONDUCTOR & ELECTRONICS
    13. 6.13 SEMICONDUCTOR & ELECTRONICS, BY TYPE, 2024 (% SHARE)
    14. 6.14 SEMICONDUCTOR & ELECTRONICS, BY TYPE, 2024 TO 2035 (USD Million)
    15. 6.15 SEMICONDUCTOR & ELECTRONICS, BY COMPONENT, 2024 (% SHARE)
    16. 6.16 SEMICONDUCTOR & ELECTRONICS, BY COMPONENT, 2024 TO 2035 (USD Million)
    17. 6.17 SEMICONDUCTOR & ELECTRONICS, BY PRODUCT TYPE, 2024 (% SHARE)
    18. 6.18 SEMICONDUCTOR & ELECTRONICS, BY PRODUCT TYPE, 2024 TO 2035 (USD Million)
    19. 6.19 SEMICONDUCTOR & ELECTRONICS, BY SYSTEM TYPE, 2024 (% SHARE)
    20. 6.20 SEMICONDUCTOR & ELECTRONICS, BY SYSTEM TYPE, 2024 TO 2035 (USD Million)
    21. 6.21 SEMICONDUCTOR & ELECTRONICS, BY END-USE INDUSTRIES, 2024 (% SHARE)
    22. 6.22 SEMICONDUCTOR & ELECTRONICS, BY END-USE INDUSTRIES, 2024 TO 2035 (USD Million)
    23. 6.23 BENCHMARKING OF MAJOR COMPETITORS
  7. 7 LIST OF TABLES
    1. 7.1 LIST OF ASSUMPTIONS
  8. 7.1.1
    1. 7.2 US MARKET SIZE ESTIMATES; FORECAST
      1. 7.2.1 BY TYPE, 2025-2035 (USD Million)
      2. 7.2.2 BY COMPONENT, 2025-2035 (USD Million)
      3. 7.2.3 BY PRODUCT TYPE, 2025-2035 (USD Million)
      4. 7.2.4 BY SYSTEM TYPE, 2025-2035 (USD Million)
      5. 7.2.5 BY END-USE INDUSTRIES, 2025-2035 (USD Million)
    2. 7.3 PRODUCT LAUNCH/PRODUCT DEVELOPMENT/APPROVAL
  9. 7.3.1
    1. 7.4 ACQUISITION/PARTNERSHIP
  10. 7.4.1

US pH Sensor Market Segmentation

US pH Sensor Market By Type (USD Million, 2025-2035)
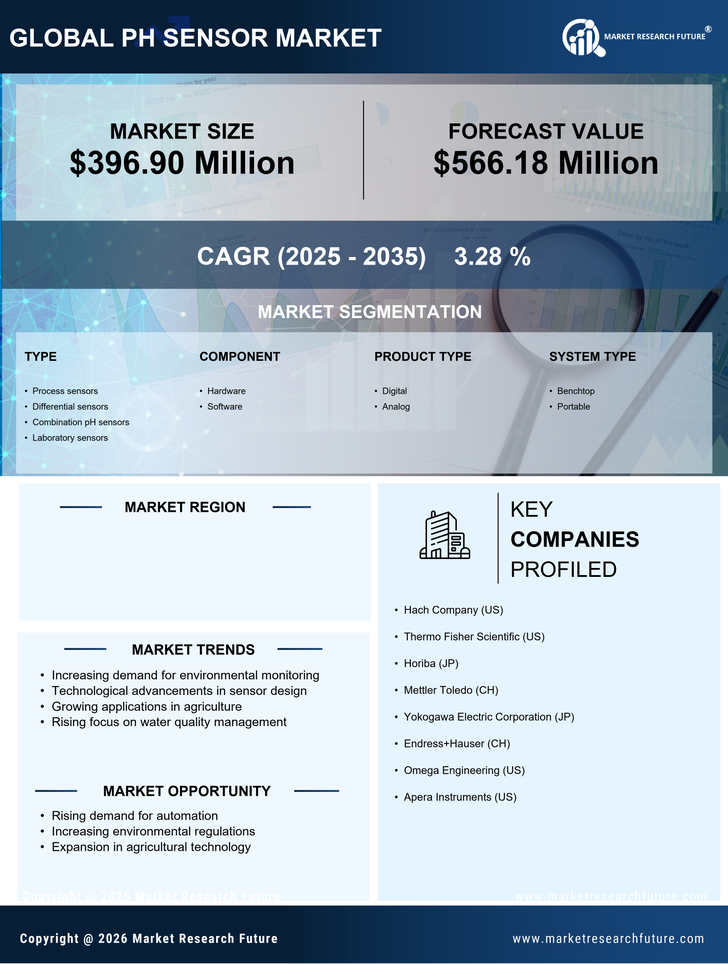
  • Process sensors
  • Differential sensors
  • Combination pH sensors
  • Laboratory sensors

US pH Sensor Market By Component (USD Million, 2025-2035)

  • Hardware
  • Software

US pH Sensor Market By Product Type (USD Million, 2025-2035)

  • Digital
  • Analog

US pH Sensor Market By System Type (USD Million, 2025-2035)

  • Benchtop
  • Portable

US pH Sensor Market By End-Use Industries (USD Million, 2025-2035)

  • Water and wastewater
  • Paper
  • Chemical
  • Oil and gas
  • Food and beverages
  • Medical and pharmaceutical
  • Metal and mining
  • Agriculture