Request Free Sample ×

Kindly complete the form below to receive a free sample of this Report

* Please use a valid business email

Leading companies partner with us for data-driven Insights

clients tt-cursor
Hero Background

US Passenger Vehicle Telematics Market

ID: MRFR/AT/16684-HCR
100 Pages
Shubham Munde
Last Updated: May 02, 2026

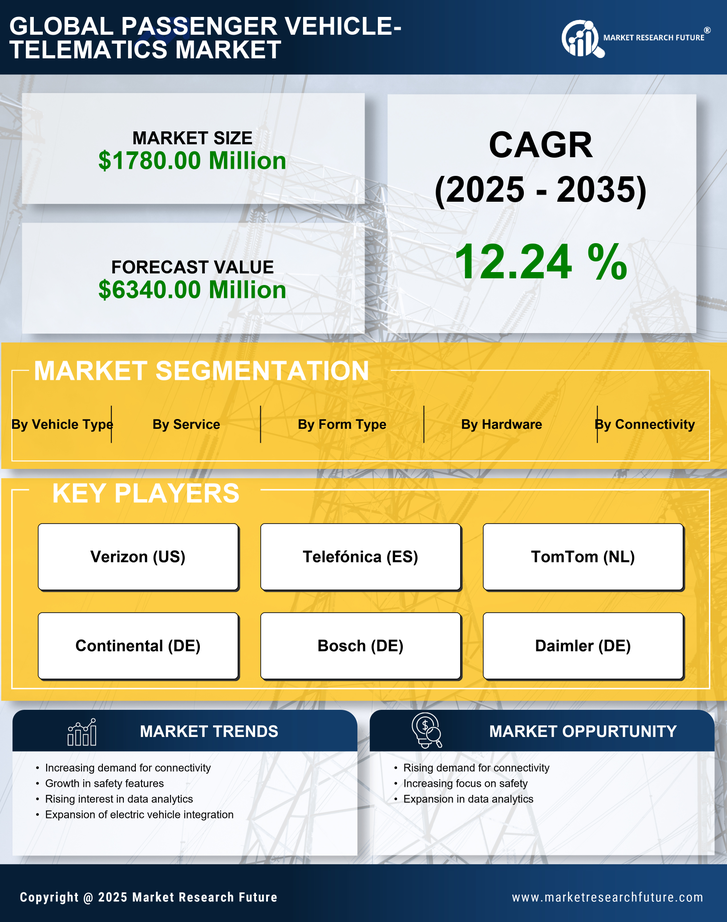
US Passenger Vehicle Telematics Market Research Report By Service (Automatic Crash Notification, Emergency Calling, Navigation, On-Road Assistance, Remote Diagnostics, Vehicle Tracking/Recovery (Fleet Management), Insurance Risk Assessment, Driver Behavior, Billing Services, Fuel efficiency Guidance, Geo-Fencing, Eco Driving), By Hardware (Telematic Control Unit, Navigation Systems, Communication Devices, Audio/Video Interface, CAN Bus), By Form Type (Embedded, Tethered, Integrated), By Vehicle Type (Passenger Car, LCV, Truck, Bus), By Connectivity (Satellite, Cellular), By Aftermarket (Passenger Car/Aftermarket, LCV Aftermarket, HCV Aftermarket) and By Service Type (Consulting, Implementation, Maintenance) - Forecast to 2035

Share:
Download PDF ×

We do not share your information with anyone. However, we may send you emails based on your report interest from time to time. You may contact us at any time to opt-out.

US Passenger Vehicle Telematics Market Infographic
Purchase Options
  1. SECTION I: EXECUTIVE SUMMARY AND KEY HIGHLIGHTS |
    1. 1.1 EXECUTIVE SUMMARY | |
      1. 1.1.1 Market Overview | |
      2. 1.1.2 Key Findings | |
      3. 1.1.3 Market Segmentation | |
      4. 1.1.4 Competitive Landscape | |
      5. 1.1.5 Challenges and Opportunities | |
      6. 1.1.6 Future Outlook 2
  2. SECTION II: SCOPING, METHODOLOGY AND MARKET STRUCTURE |
    1. 2.1 MARKET INTRODUCTION | |
      1. 2.1.1 Definition | |
      2. 2.1.2 Scope of the study | | |
        1. 2.1.2.1 Research Objective | | |
        2. 2.1.2.2 Assumption | | |
        3. 2.1.2.3 Limitations |
    2. 2.2 RESEARCH METHODOLOGY | |
      1. 2.2.1 Overview | |
      2. 2.2.2 Data Mining | |
      3. 2.2.3 Secondary Research | |
      4. 2.2.4 Primary Research | | |
        1. 2.2.4.1 Primary Interviews and Information Gathering Process | | |
        2. 2.2.4.2 Breakdown of Primary Respondents | |
      5. 2.2.5 Forecasting Model | |
      6. 2.2.6 Market Size Estimation | | |
        1. 2.2.6.1 Bottom-Up Approach | | |
        2. 2.2.6.2 Top-Down Approach | |
      7. 2.2.7 Data Triangulation | |
      8. 2.2.8 Validation 3
  3. SECTION III: QUALITATIVE ANALYSIS |
    1. 3.1 MARKET DYNAMICS | |
      1. 3.1.1 Overview | |
      2. 3.1.2 Drivers | |
      3. 3.1.3 Restraints | |
      4. 3.1.4 Opportunities |
    2. 3.2 MARKET FACTOR ANALYSIS | |
      1. 3.2.1 Value chain Analysis | |
      2. 3.2.2 Porter's Five Forces Analysis | | |
        1. 3.2.2.1 Bargaining Power of Suppliers | | |
        2. 3.2.2.2 Bargaining Power of Buyers | | |
        3. 3.2.2.3 Threat of New Entrants | | |
        4. 3.2.2.4 Threat of Substitutes | | |
        5. 3.2.2.5 Intensity of Rivalry | |
      3. 3.2.3 COVID-19 Impact Analysis | | |
        1. 3.2.3.1 Market Impact Analysis | | |
        2. 3.2.3.2 Regional Impact | | |
        3. 3.2.3.3 Opportunity and Threat Analysis 4
  4. SECTION IV: QUANTITATIVE ANALYSIS |
    1. 4.1 Automobile, BY Service (USD Million) | |
      1. 4.1.1 Automatic Crash Notification | |
      2. 4.1.2 Emergency Calling | |
      3. 4.1.3 Navigation | |
      4. 4.1.4 On-Road Assistance | |
      5. 4.1.5 Remote Diagnostics | |
      6. 4.1.6 Vehicle Tracking/Recovery (Fleet Management) | |
      7. 4.1.7 Insurance Risk Assessment | |
      8. 4.1.8 Driver Behavior | |
      9. 4.1.9 Billing Services | |
      10. 4.1.10 Others (Fuel efficiency Guidance, Geo-Fencing, Eco Driving) |
    2. 4.2 Automobile, BY Hardware (USD Million) | |
      1. 4.2.1 Telematic Control Unit | |
      2. 4.2.2 Navigation Systems | |
      3. 4.2.3 Communication Devices | |
      4. 4.2.4 Audio/Video Interface | |
      5. 4.2.5 CAN Bus |
    3. 4.3 Automobile, BY Form Type (USD Million) | |
      1. 4.3.1 Embedded | |
      2. 4.3.2 Tethered | |
      3. 4.3.3 Integrated |
    4. 4.4 Automobile, BY Vehicle Type (USD Million) | |
      1. 4.4.1 Passenger Car | |
      2. 4.4.2 LCV | |
      3. 4.4.3 Truck | |
      4. 4.4.4 Bus |
    5. 4.5 Automobile, BY Connectivity (USD Million) | |
      1. 4.5.1 Satellite | |
      2. 4.5.2 Cellular |
    6. 4.6 Automobile, BY Aftermarket (USD Million) | |
      1. 4.6.1 Passenger Car/Aftermarket | |
      2. 4.6.2 LCV Aftermarket | |
      3. 4.6.3 HCV Aftermarket |
    7. 4.7 Automobile, BY Service Type (USD Million) | |
      1. 4.7.1 Consulting | |
      2. 4.7.2 Implementation | |
      3. 4.7.3 Maintenance 5
  5. SECTION V: COMPETITIVE ANALYSIS |
    1. 5.1 Competitive Landscape | |
      1. 5.1.1 Overview | |
      2. 5.1.2 Competitive Analysis | |
      3. 5.1.3 Market share Analysis | |
      4. 5.1.4 Major Growth Strategy in the Automobile | |
      5. 5.1.5 Competitive Benchmarking | |
      6. 5.1.6 Leading Players in Terms of Number of Developments in the Automobile | |
      7. 5.1.7 Key developments and growth strategies | | |
        1. 5.1.7.1 New Product Launch/Service Deployment | | |
        2. 5.1.7.2 Merger & Acquisitions | | |
        3. 5.1.7.3 Joint Ventures | |
      8. 5.1.8 Major Players Financial Matrix | | |
        1. 5.1.8.1 Sales and Operating Income | | |
        2. 5.1.8.2 Major Players R&D Expenditure. 2023 |
    2. 5.2 Company Profiles | |
      1. 5.2.1 Verizon (US) | | |
        1. 5.2.1.1 Financial Overview | | |
        2. 5.2.1.2 Products Offered | | |
        3. 5.2.1.3 Key Developments | | |
        4. 5.2.1.4 SWOT Analysis | | |
        5. 5.2.1.5 Key Strategies | |
      2. 5.2.2 Telefónica (ES) | | |
        1. 5.2.2.1 Financial Overview | | |
        2. 5.2.2.2 Products Offered | | |
        3. 5.2.2.3 Key Developments | | |
        4. 5.2.2.4 SWOT Analysis | | |
        5. 5.2.2.5 Key Strategies | |
      3. 5.2.3 TomTom (NL) | | |
        1. 5.2.3.1 Financial Overview | | |
        2. 5.2.3.2 Products Offered | | |
        3. 5.2.3.3 Key Developments | | |
        4. 5.2.3.4 SWOT Analysis | | |
        5. 5.2.3.5 Key Strategies | |
      4. 5.2.4 Continental (DE) | | |
        1. 5.2.4.1 Financial Overview | | |
        2. 5.2.4.2 Products Offered | | |
        3. 5.2.4.3 Key Developments | | |
        4. 5.2.4.4 SWOT Analysis | | |
        5. 5.2.4.5 Key Strategies | |
      5. 5.2.5 Bosch (DE) | | |
        1. 5.2.5.1 Financial Overview | | |
        2. 5.2.5.2 Products Offered | | |
        3. 5.2.5.3 Key Developments | | |
        4. 5.2.5.4 SWOT Analysis | | |
        5. 5.2.5.5 Key Strategies | |
      6. 5.2.6 Daimler (DE) | | |
        1. 5.2.6.1 Financial Overview | | |
        2. 5.2.6.2 Products Offered | | |
        3. 5.2.6.3 Key Developments | | |
        4. 5.2.6.4 SWOT Analysis | | |
        5. 5.2.6.5 Key Strategies | |
      7. 5.2.7 Harman (US) | | |
        1. 5.2.7.1 Financial Overview | | |
        2. 5.2.7.2 Products Offered | | |
        3. 5.2.7.3 Key Developments | | |
        4. 5.2.7.4 SWOT Analysis | | |
        5. 5.2.7.5 Key Strategies | |
      8. 5.2.8 Aptiv (IE) | | |
        1. 5.2.8.1 Financial Overview | | |
        2. 5.2.8.2 Products Offered | | |
        3. 5.2.8.3 Key Developments | | |
        4. 5.2.8.4 SWOT Analysis | | |
        5. 5.2.8.5 Key Strategies | |
      9. 5.2.9 Ford (US) | | |
        1. 5.2.9.1 Financial Overview | | |
        2. 5.2.9.2 Products Offered | | |
        3. 5.2.9.3 Key Developments | | |
        4. 5.2.9.4 SWOT Analysis | | |
        5. 5.2.9.5 Key Strategies |
    3. 5.3 Appendix | |
      1. 5.3.1 References | |
      2. 5.3.2 Related Reports 6 LIST OF FIGURES |
    4. 6.1 MARKET SYNOPSIS |
    5. 6.2 US MARKET ANALYSIS BY SERVICE |
    6. 6.3 US MARKET ANALYSIS BY HARDWARE |
    7. 6.4 US MARKET ANALYSIS BY FORM TYPE |
    8. 6.5 US MARKET ANALYSIS BY VEHICLE TYPE |
    9. 6.6 US MARKET ANALYSIS BY CONNECTIVITY |
    10. 6.7 US MARKET ANALYSIS BY AFTERMARKET |
    11. 6.8 US MARKET ANALYSIS BY SERVICE TYPE |
    12. 6.9 KEY BUYING CRITERIA OF AUTOMOBILE |
    13. 6.10 RESEARCH PROCESS OF MRFR |
    14. 6.11 DRO ANALYSIS OF AUTOMOBILE |
    15. 6.12 DRIVERS IMPACT ANALYSIS: AUTOMOBILE |
    16. 6.13 RESTRAINTS IMPACT ANALYSIS: AUTOMOBILE |
    17. 6.14 SUPPLY / VALUE CHAIN: AUTOMOBILE |
    18. 6.15 AUTOMOBILE, BY SERVICE, 2024 (% SHARE) |
    19. 6.16 AUTOMOBILE, BY SERVICE, 2024 TO 2035 (USD Million) |
    20. 6.17 AUTOMOBILE, BY HARDWARE, 2024 (% SHARE) |
    21. 6.18 AUTOMOBILE, BY HARDWARE, 2024 TO 2035 (USD Million) |
    22. 6.19 AUTOMOBILE, BY FORM TYPE, 2024 (% SHARE) |
    23. 6.20 AUTOMOBILE, BY FORM TYPE, 2024 TO 2035 (USD Million) |
    24. 6.21 AUTOMOBILE, BY VEHICLE TYPE, 2024 (% SHARE) |
    25. 6.22 AUTOMOBILE, BY VEHICLE TYPE, 2024 TO 2035 (USD Million) |
    26. 6.23 AUTOMOBILE, BY CONNECTIVITY, 2024 (% SHARE) |
    27. 6.24 AUTOMOBILE, BY CONNECTIVITY, 2024 TO 2035 (USD Million) |
    28. 6.25 AUTOMOBILE, BY AFTERMARKET, 2024 (% SHARE) |
    29. 6.26 AUTOMOBILE, BY AFTERMARKET, 2024 TO 2035 (USD Million) |
    30. 6.27 AUTOMOBILE, BY SERVICE TYPE, 2024 (% SHARE) |
    31. 6.28 AUTOMOBILE, BY SERVICE TYPE, 2024 TO 2035 (USD Million) |
    32. 6.29 BENCHMARKING OF MAJOR COMPETITORS 7 LIST OF TABLES |
    33. 7.1 LIST OF ASSUMPTIONS | |
      1. 7.1.1 |
    34. 7.2 US MARKET SIZE ESTIMATES; FORECAST | |
      1. 7.2.1 BY SERVICE, 2025-2035 (USD Million) | |
      2. 7.2.2 BY HARDWARE, 2025-2035 (USD Million) | |
      3. 7.2.3 BY FORM TYPE, 2025-2035 (USD Million) | |
      4. 7.2.4 BY VEHICLE TYPE, 2025-2035 (USD Million) | |
      5. 7.2.5 BY CONNECTIVITY, 2025-2035 (USD Million) | |
      6. 7.2.6 BY AFTERMARKET, 2025-2035 (USD Million) | |
      7. 7.2.7 BY SERVICE TYPE, 2025-2035 (USD Million) |
    35. 7.3 PRODUCT LAUNCH/PRODUCT DEVELOPMENT/APPROVAL | |
      1. 7.3.1 |
    36. 7.4 ACQUISITION/PARTNERSHIP | |

US Automobile Market Segmentation

Automobile By Service (USD Million, 2025-2035)

  • Automatic Crash Notification
  • Emergency Calling
  • Navigation
  • On-Road Assistance
  • Remote Diagnostics
  • Vehicle Tracking/Recovery (Fleet Management)
  • Insurance Risk Assessment
  • Driver Behavior
  • Billing Services
  • Others (Fuel efficiency Guidance, Geo-Fencing, Eco Driving)

Automobile By Hardware (USD Million, 2025-2035)

  • Telematic Control Unit
  • Navigation Systems
  • Communication Devices
  • Audio/Video Interface
  • CAN Bus

Automobile By Form Type (USD Million, 2025-2035)

  • Embedded
  • Tethered
  • Integrated

Automobile By Vehicle Type (USD Million, 2025-2035)

  • Passenger Car
  • LCV
  • Truck
  • Bus

Automobile By Connectivity (USD Million, 2025-2035)

  • Satellite
  • Cellular

Automobile By Aftermarket (USD Million, 2025-2035)

  • Passenger Car/Aftermarket
  • LCV Aftermarket
  • HCV Aftermarket

Automobile By Service Type (USD Million, 2025-2035)

  • Consulting
  • Implementation
  • Maintenance

Compare Licence

×
Features License Type
Single User Multiuser License Enterprise User
Price $4,950 $5,950 $7,250
Maximum User Access Limit 1 User Upto 10 Users Unrestricted Access Throughout the Organization
Free Customization
Direct Access to Analyst
Deliverable Format
Platform Access
Discount on Next Purchase 10% 15% 15%
Printable Versions